Aerodynamic Stability and Performance of Next-Generation ...
Aerodynamic Stability and Performance of Next-Generation ...
Aerodynamic Stability and Performance of Next-Generation ...

You also want an ePaper? Increase the reach of your titles
YUMPU automatically turns print PDFs into web optimized ePapers that Google loves.
Downloaded by GEORGIA INST OF TECHNOLOGY on April 1, 2013 | http://arc.aiaa.org | DOI: 10.2514/6.2013-1356<br />
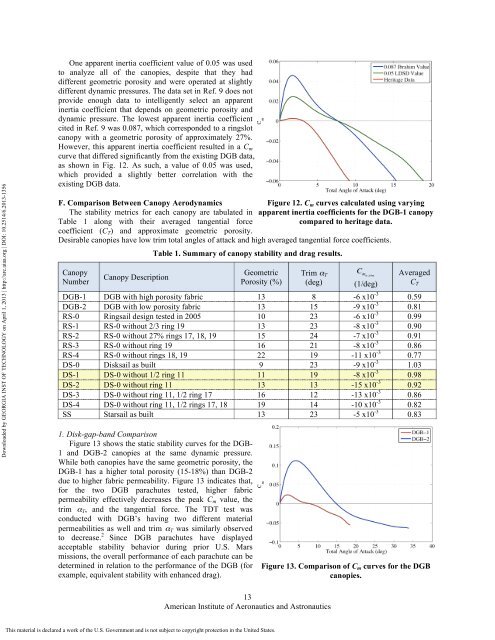
One apparent inertia coefficient value <strong>of</strong> 0.05 was used<br />
to analyze all <strong>of</strong> the canopies, despite that they had<br />
different geometric porosity <strong>and</strong> were operated at slightly<br />
different dynamic pressures. The data set in Ref. 9 does not<br />
provide enough data to intelligently select an apparent<br />
inertia coefficient that depends on geometric porosity <strong>and</strong><br />
dynamic pressure. The lowest apparent inertia coefficient<br />
cited in Ref. 9 was 0.087, which corresponded to a ringslot<br />
canopy with a geometric porosity <strong>of</strong> approximately 27%.<br />
However, this apparent inertia coefficient resulted in a C m<br />
curve that differed significantly from the existing DGB data,<br />
as shown in Fig. 12. As such, a value <strong>of</strong> 0.05 was used,<br />
which provided a slightly better correlation with the<br />
existing DGB data.<br />
F. Comparison Between Canopy <strong>Aerodynamic</strong>s<br />
Figure 12. C m curves calculated using varying<br />
The stability metrics for each canopy are tabulated in apparent inertia coefficients for the DGB-1 canopy<br />
Table 1 along with their averaged tangential force<br />
compared to heritage data.<br />
coefficient (C T ) <strong>and</strong> approximate geometric porosity.<br />
Desirable canopies have low trim total angles <strong>of</strong> attack <strong>and</strong> high averaged tangential force coefficients.<br />
Canopy<br />
Number<br />
Canopy Description<br />
Table 1. Summary <strong>of</strong> canopy stability <strong>and</strong> drag results.<br />
1. Disk-gap-b<strong>and</strong> Comparison<br />
Figure 13 shows the static stability curves for the DGB-<br />
1 <strong>and</strong> DGB-2 canopies at the same dynamic pressure.<br />
While both canopies have the same geometric porosity, the<br />
DGB-1 has a higher total porosity (15-18%) than DGB-2<br />
due to higher fabric permeability. Figure 13 indicates that,<br />
for the two DGB parachutes tested, higher fabric<br />
permeability effectively decreases the peak C m value, the<br />
trim α T , <strong>and</strong> the tangential force. The TDT test was<br />
conducted with DGB’s having two different material<br />
permeabilities as well <strong>and</strong> trim α T was similarly observed<br />
to decrease. 2 Since DGB parachutes have displayed<br />
acceptable stability behavior during prior U.S. Mars<br />
missions, the overall performance <strong>of</strong> each parachute can be<br />
determined in relation to the performance <strong>of</strong> the DGB (for<br />
example, equivalent stability with enhanced drag).<br />
Geometric<br />
Porosity (%)<br />
Trim α T<br />
(deg)<br />
(1/deg)<br />
Averaged<br />
C T<br />
DGB-1 DGB with high porosity fabric 13 8 -6 x10 -3 0.59<br />
DGB-2 DGB with low porosity fabric 13 15 -9 x10 -3 0.81<br />
RS-0 Ringsail design tested in 2005 10 23 -6 x10 -3 0.99<br />
RS-1 RS-0 without 2/3 ring 19 13 23 -8 x10 -3 0.90<br />
RS-2 RS-0 without 27% rings 17, 18, 19 15 24 -7 x10 -3 0.91<br />
RS-3 RS-0 without ring 19 16 21 -8 x10 -3 0.86<br />
RS-4 RS-0 without rings 18, 19 22 19 -11 x10 -3 0.77<br />
DS-0 Disksail as built 9 23 -9 x10 -3 1.03<br />
DS-1 DS-0 without 1/2 ring 11 11 19 -8 x10 -3 0.98<br />
DS-2 DS-0 without ring 11 13 13 -15 x10 -3 0.92<br />
DS-3 DS-0 without ring 11, 1/2 ring 17 16 12 -13 x10 -3 0.86<br />
DS-4 DS-0 without ring 11, 1/2 rings 17, 18 19 14 -10 x10 -3 0.82<br />
SS Starsail as built 13 23 -5 x10 -3 0.83<br />
Figure 13. Comparison <strong>of</strong> C m curves for the DGB<br />
canopies.<br />
13<br />
American Institute <strong>of</strong> Aeronautics <strong>and</strong> Astronautics<br />
This material is declared a work <strong>of</strong> the U.S. Government <strong>and</strong> is not subject to copyright protection in the United States.