Investigation of Transonic Drag Computations in Aerodynamic ...
Investigation of Transonic Drag Computations in Aerodynamic ...
Investigation of Transonic Drag Computations in Aerodynamic ...
Create successful ePaper yourself
Turn your PDF publications into a flip-book with our unique Google optimized e-Paper software.
<strong>Investigation</strong> <strong>of</strong> <strong>Transonic</strong> <strong>Drag</strong> <strong>Computations</strong> <strong>in</strong> APAS<br />
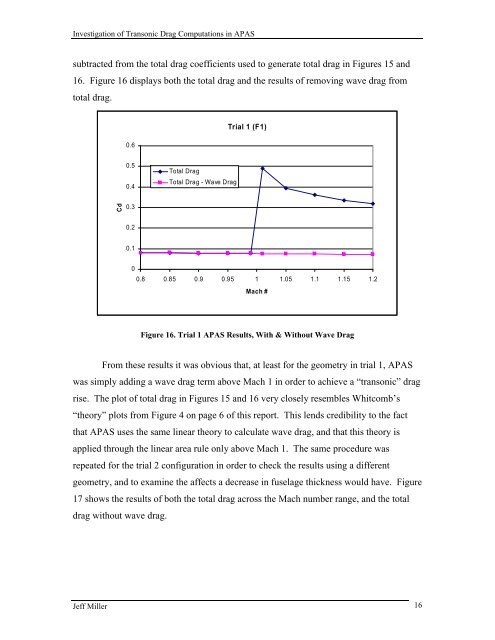
subtracted from the total drag coefficients used to generate total drag <strong>in</strong> Figures 15 and<br />
16. Figure 16 displays both the total drag and the results <strong>of</strong> remov<strong>in</strong>g wave drag from<br />
total drag.<br />
0.6<br />
Trial 1 (F1)<br />
0.5<br />
0.4<br />
Total <strong>Drag</strong><br />
Total <strong>Drag</strong> - Wave <strong>Drag</strong><br />
Cd<br />
0.3<br />
0.2<br />
0.1<br />
0<br />
0.8 0.85 0.9 0.95 1 1.05 1.1 1.15 1.2<br />
Mach #<br />
Figure 16. Trial 1 APAS Results, With & Without Wave <strong>Drag</strong><br />
From these results it was obvious that, at least for the geometry <strong>in</strong> trial 1, APAS<br />
was simply add<strong>in</strong>g a wave drag term above Mach 1 <strong>in</strong> order to achieve a “transonic” drag<br />
rise. The plot <strong>of</strong> total drag <strong>in</strong> Figures 15 and 16 very closely resembles Whitcomb’s<br />
“theory” plots from Figure 4 on page 6 <strong>of</strong> this report. This lends credibility to the fact<br />
that APAS uses the same l<strong>in</strong>ear theory to calculate wave drag, and that this theory is<br />
applied through the l<strong>in</strong>ear area rule only above Mach 1. The same procedure was<br />
repeated for the trial 2 configuration <strong>in</strong> order to check the results us<strong>in</strong>g a different<br />
geometry, and to exam<strong>in</strong>e the affects a decrease <strong>in</strong> fuselage thickness would have. Figure<br />
17 shows the results <strong>of</strong> both the total drag across the Mach number range, and the total<br />
drag without wave drag.<br />
Jeff Miller 16


