SINGALE 1-24.cdr - ONGC
SINGALE 1-24.cdr - ONGC
SINGALE 1-24.cdr - ONGC

Create successful ePaper yourself
Turn your PDF publications into a flip-book with our unique Google optimized e-Paper software.
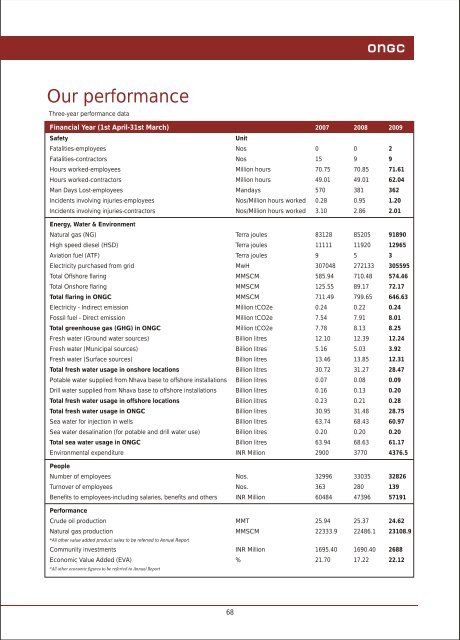
Our performance<br />
Three-year performance data<br />
Financial Year (1st April-31st March) 2007 2008 2009<br />
Safety<br />
Unit<br />
Fatalities-employees Nos 0 0 2<br />
Fatalities-contractors Nos 15 9 9<br />
Hours worked-employees Million hours 70.75 70.85 71.61<br />
Hours worked-contractors Million hours 49.01 49.01 62.04<br />
Man Days Lost-employees Mandays 570 381 362<br />
Incidents involving injuries-employees Nos/Million hours worked 0.28 0.95 1.20<br />
Incidents involving injuries-contractors Nos/Million hours worked 3.10 2.86 2.01<br />
Energy, Water & Environment<br />
Natural gas (NG) Terra joules 83128 85205 91890<br />
High speed diesel (HSD) Terra joules 11111 11920 12965<br />
Aviation fuel (ATF) Terra joules 9 5 3<br />
Electricity purchased from grid MwH 307048 272133 305595<br />
Total Offshore flaring MMSCM 585.94 710.48 574.46<br />
Total Onshore flaring MMSCM 125.55 89.17 72.17<br />
Total flaring in <strong>ONGC</strong> MMSCM 711.49 799.65 646.63<br />
Electricity - Indirect emission Million tCO2e 0.24 0.22 0.24<br />
Fossil fuel - Direct emission Million tCO2e 7.54 7.91 8.01<br />
Total greenhouse gas (GHG) in <strong>ONGC</strong> Million tCO2e 7.78 8.13 8.25<br />
Fresh water (Ground water sources) Billion litres 12.10 12.39 12.24<br />
Fresh water (Municipal sources) Billion litres 5.16 5.03 3.92<br />
Fresh water (Surface sources) Billion litres 13.46 13.85 12.31<br />
Total fresh water usage in onshore locations Billion litres 30.72 31.27 28.47<br />
Potable water supplied from Nhava base to offshore installations Billion litres 0.07 0.08 0.09<br />
Drill water supplied from Nhava base to offshore installations Billion litres 0.16 0.13 0.20<br />
Total fresh water usage in offshore locations Billion litres 0.23 0.21 0.28<br />
Total fresh water usage in <strong>ONGC</strong> Billion litres 30.95 31.48 28.75<br />
Sea water for injection in wells Billion litres 63.74 68.43 60.97<br />
Sea water desalination (for potable and drill water use) Billion litres 0.20 0.20 0.20<br />
Total sea water usage in <strong>ONGC</strong> Billion litres 63.94 68.63 61.17<br />
Environmental expenditure INR Million 2900 3770 4376.5<br />
People<br />
Number of employees Nos. 32996 33035 32826<br />
Turnover of employees Nos. 363 280 139<br />
Benefits to employees-including salaries, benefits and others INR Million 60484 47396 57191<br />
Performance<br />
Crude oil production MMT 25.94 25.37 24.62<br />
Natural gas production MMSCM 22333.9 22486.1 23108.9<br />
*All other value added product sales to be referred to Annual Report<br />
Community investments INR Million 1695.40 1690.40 2688<br />
Economic Value Added (EVA) % 21.70 17.22 22.12<br />
*All other economic figures to be referred to Annual Report<br />
68