

meoprobit - Stata
meoprobit - Stata
meoprobit - Stata

You also want an ePaper? Increase the reach of your titles
YUMPU automatically turns print PDFs into web optimized ePapers that Google loves.
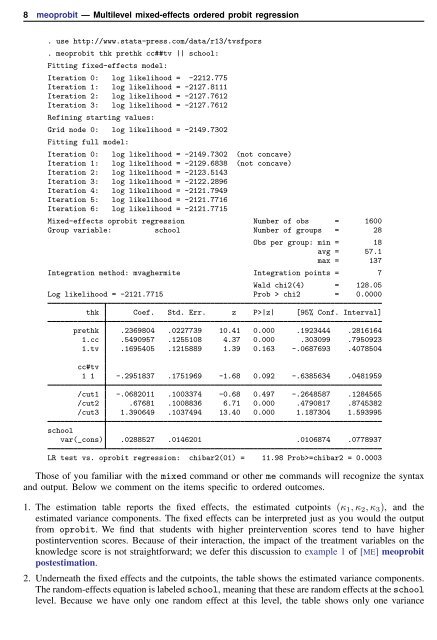
8 <strong>meoprobit</strong> — Multilevel mixed-effects ordered probit regression<br />
. use http://www.stata-press.com/data/r13/tvsfpors<br />
. <strong>meoprobit</strong> thk prethk cc##tv || school:<br />
Fitting fixed-effects model:<br />
Iteration 0: log likelihood = -2212.775<br />
Iteration 1: log likelihood = -2127.8111<br />
Iteration 2: log likelihood = -2127.7612<br />
Iteration 3: log likelihood = -2127.7612<br />
Refining starting values:<br />
Grid node 0: log likelihood = -2149.7302<br />
Fitting full model:<br />
Iteration 0: log likelihood = -2149.7302 (not concave)<br />
Iteration 1: log likelihood = -2129.6838 (not concave)<br />
Iteration 2: log likelihood = -2123.5143<br />
Iteration 3: log likelihood = -2122.2896<br />
Iteration 4: log likelihood = -2121.7949<br />
Iteration 5: log likelihood = -2121.7716<br />
Iteration 6: log likelihood = -2121.7715<br />
Mixed-effects oprobit regression Number of obs = 1600<br />
Group variable: school Number of groups = 28<br />
Obs per group: min = 18<br />
avg = 57.1<br />
max = 137<br />
Integration method: mvaghermite Integration points = 7<br />
Wald chi2(4) = 128.05<br />
Log likelihood = -2121.7715 Prob > chi2 = 0.0000<br />
thk Coef. Std. Err. z P>|z| [95% Conf. Interval]<br />
prethk .2369804 .0227739 10.41 0.000 .1923444 .2816164<br />
1.cc .5490957 .1255108 4.37 0.000 .303099 .7950923<br />
1.tv .1695405 .1215889 1.39 0.163 -.0687693 .4078504<br />
cc#tv<br />
1 1 -.2951837 .1751969 -1.68 0.092 -.6385634 .0481959<br />
/cut1 -.0682011 .1003374 -0.68 0.497 -.2648587 .1284565<br />
/cut2 .67681 .1008836 6.71 0.000 .4790817 .8745382<br />
/cut3 1.390649 .1037494 13.40 0.000 1.187304 1.593995<br />
school<br />
var(_cons) .0288527 .0146201 .0106874 .0778937<br />
LR test vs. oprobit regression: chibar2(01) = 11.98 Prob>=chibar2 = 0.0003<br />
Those of you familiar with the mixed command or other me commands will recognize the syntax<br />
and output. Below we comment on the items specific to ordered outcomes.<br />
1. The estimation table reports the fixed effects, the estimated cutpoints (κ 1 , κ 2 , κ 3 ), and the<br />
estimated variance components. The fixed effects can be interpreted just as you would the output<br />
from oprobit. We find that students with higher preintervention scores tend to have higher<br />
postintervention scores. Because of their interaction, the impact of the treatment variables on the<br />
knowledge score is not straightforward; we defer this discussion to example 1 of [ME] <strong>meoprobit</strong><br />
postestimation.<br />
2. Underneath the fixed effects and the cutpoints, the table shows the estimated variance components.<br />
The random-effects equation is labeled school, meaning that these are random effects at the school<br />
level. Because we have only one random effect at this level, the table shows only one variance


