- Page 1 and 2:
CHEMIA 3/2011
- Page 3 and 4:
CORINA COSTESCU, LAURA CORPAŞ, NIC
- Page 5 and 6:
Studia Universitatis Babes-Bolyai C
- Page 7 and 8:
MONICA BAIA, MONICA SCARISOREANU, I
- Page 9 and 10:
MONICA BAIA, MONICA SCARISOREANU, I
- Page 11 and 12:
MONICA BAIA, MONICA SCARISOREANU, I
- Page 13 and 14:
MONICA BAIA, MONICA SCARISOREANU, I
- Page 16 and 17:
STUDIA UBB CHEMIA, LVI, 3, 2011 (p.
- Page 18 and 19:
PREPARATION, CHARACTERIZATION AND S
- Page 20 and 21:
PREPARATION, CHARACTERIZATION AND S
- Page 22 and 23:
PREPARATION, CHARACTERIZATION AND S
- Page 24 and 25:
PREPARATION, CHARACTERIZATION AND S
- Page 26 and 27:
PREPARATION, CHARACTERIZATION AND S
- Page 28 and 29:
STUDIA UBB CHEMIA, LVI, 3, 2011 (p.
- Page 30 and 31:
SPECTROSCOPIC EVIDENCE OF COLLAGEN
- Page 32 and 33:
SPECTROSCOPIC EVIDENCE OF COLLAGEN
- Page 34:
SPECTROSCOPIC EVIDENCE OF COLLAGEN
- Page 37 and 38:
CORNEL-VIOREL POP, TRAIAN ŞTEFAN,
- Page 39 and 40:
CORNEL-VIOREL POP, TRAIAN ŞTEFAN,
- Page 41 and 42:
CORNEL-VIOREL POP, TRAIAN ŞTEFAN,
- Page 43 and 44:
CORNEL-VIOREL POP, TRAIAN ŞTEFAN,
- Page 45 and 46:
VITALY ERUKHIMOVITCH, IGOR MUKMANOV
- Page 47 and 48:
VITALY ERUKHIMOVITCH, IGOR MUKMANOV
- Page 49 and 50:
VITALY ERUKHIMOVITCH, IGOR MUKMANOV
- Page 51 and 52:
VITALY ERUKHIMOVITCH, IGOR MUKMANOV
- Page 53 and 54:
DUMITRU GEORGESCU, ZSOLT PAP, MONIC
- Page 55 and 56:
DUMITRU GEORGESCU, ZSOLT PAP, MONIC
- Page 57 and 58:
DUMITRU GEORGESCU, ZSOLT PAP, MONIC
- Page 59 and 60:
DUMITRU GEORGESCU, ZSOLT PAP, MONIC
- Page 61 and 62:
MAHDIEH AZARI, ALI IRANMANESH DEFIN
- Page 63 and 64:
MAHDIEH AZARI, ALI IRANMANESH V ( G
- Page 65 and 66:
MAHDIEH AZARI, ALI IRANMANESH Now,
- Page 67 and 68:
MAHDIEH AZARI, ALI IRANMANESH Let T
- Page 69 and 70:
MAHDIEH AZARI, ALI IRANMANESH Let G
- Page 71 and 72:
MAHDIEH AZARI, ALI IRANMANESH ACKNO
- Page 73 and 74:
CRISTINA GRUIAN, HEINZ-JÜRGEN STEI
- Page 75 and 76:
CRISTINA GRUIAN, HEINZ-JÜRGEN STEI
- Page 77 and 78:
CRISTINA GRUIAN, HEINZ-JÜRGEN STEI
- Page 79 and 80:
CRISTINA GRUIAN, HEINZ-JÜRGEN STEI
- Page 81 and 82:
CRISTINA GRUIAN, HEINZ-JÜRGEN STEI
- Page 84 and 85:
STUDIA UBB CHEMIA, LVI, 3, 2011 (p.
- Page 86 and 87:
CYCLODEXTRINS AND SMALL UNILAMELLAR
- Page 88 and 89:
CYCLODEXTRINS AND SMALL UNILAMELLAR
- Page 90 and 91:
STUDIA UBB CHEMIA, LVI, 3, 2011 (p.
- Page 92 and 93:
PROTEIN ADHESION TO BIOACTIVE MICRO
- Page 94 and 95:
PROTEIN ADHESION TO BIOACTIVE MICRO
- Page 96 and 97:
PROTEIN ADHESION TO BIOACTIVE MICRO
- Page 98 and 99:
STUDIA UBB CHEMIA, LVI, 3, 2011 (p.
- Page 100 and 101:
LC/MS ANALYSIS OF STEROLIC COMPOUND
- Page 102 and 103:
LC/MS ANALYSIS OF STEROLIC COMPOUND
- Page 104 and 105:
STUDIA UBB CHEMIA, LVI, 3, 2011 (p.
- Page 106 and 107:
INVESTIGATION OF THE EFFECTS OF DEG
- Page 108 and 109:
INVESTIGATION OF THE EFFECTS OF DEG
- Page 110 and 111:
INVESTIGATION OF THE EFFECTS OF DEG
- Page 112 and 113:
STUDIA UBB CHEMIA, LVI, 3, 2011 (p.
- Page 114 and 115:
PM3 CONFORMATIONAL ANALYSIS OF THE
- Page 116 and 117:
PM3 CONFORMATIONAL ANALYSIS OF THE
- Page 118 and 119:
PM3 CONFORMATIONAL ANALYSIS OF THE
- Page 120 and 121:
PM3 CONFORMATIONAL ANALYSIS OF THE
- Page 122 and 123:
PM3 CONFORMATIONAL ANALYSIS OF THE
- Page 124 and 125:
PM3 CONFORMATIONAL ANALYSIS OF THE
- Page 126 and 127:
PM3 CONFORMATIONAL ANALYSIS OF THE
- Page 128:
PM3 CONFORMATIONAL ANALYSIS OF THE
- Page 131 and 132:
MIHAELA POP, STEFAN TRAIAN, LIVIU D
- Page 133 and 134:
MIHAELA POP, STEFAN TRAIAN, LIVIU D
- Page 135 and 136:
MIHAELA POP, STEFAN TRAIAN, LIVIU D
- Page 137 and 138:
DIMITRI A. SVISTUNENKO, MARY ADELUS
- Page 139 and 140:
DIMITRI A. SVISTUNENKO, MARY ADELUS
- Page 141 and 142:
DIMITRI A. SVISTUNENKO, MARY ADELUS
- Page 143 and 144:
DIMITRI A. SVISTUNENKO, MARY ADELUS
- Page 145 and 146: DIMITRI A. SVISTUNENKO, MARY ADELUS
- Page 147 and 148: DIMITRI A. SVISTUNENKO, MARY ADELUS
- Page 149 and 150: MILICA TODEA, TEODORA MARCU, MONICA
- Page 151 and 152: MILICA TODEA, TEODORA MARCU, MONICA
- Page 153 and 154: MILICA TODEA, TEODORA MARCU, MONICA
- Page 155 and 156: MILICA TODEA, TEODORA MARCU, MONICA
- Page 157 and 158: MILICA TODEA, TEODORA MARCU, MONICA
- Page 159 and 160: EDINA DORDAI, DANA ALINA MĂGDAŞ,
- Page 161 and 162: EDINA DORDAI, DANA ALINA MĂGDAŞ,
- Page 163 and 164: EDINA DORDAI, DANA ALINA MĂGDAŞ,
- Page 166 and 167: STUDIA UBB CHEMIA, LVI, 3, 2011 (p.
- Page 168 and 169: UV ABSORPTION PROPERTIES OF DOPED P
- Page 170: UV ABSORPTION PROPERTIES OF DOPED P
- Page 173 and 174: HASTI ATEFI, MAHMOOD GHORANNEVISS,
- Page 175 and 176: HASTI ATEFI, MAHMOOD GHORANNEVISS,
- Page 177 and 178: HASTI ATEFI, MAHMOOD GHORANNEVISS,
- Page 179 and 180: HASTI ATEFI, MAHMOOD GHORANNEVISS,
- Page 181 and 182: LUCIANA UDRESCU, BOGDAN MARTA, MIHA
- Page 183 and 184: LUCIANA UDRESCU, BOGDAN MARTA, MIHA
- Page 185 and 186: LUCIANA UDRESCU, BOGDAN MARTA, MIHA
- Page 187 and 188: ALI MADANSHEKAF, MARJAN MORADI wher
- Page 189 and 190: ALI MADANSHEKAF, MARJAN MORADI and
- Page 191 and 192: ALI MADANSHEKAF, MARJAN MORADI Agai
- Page 193 and 194: ALI MADANSHEKAF, MARJAN MORADI 9. M
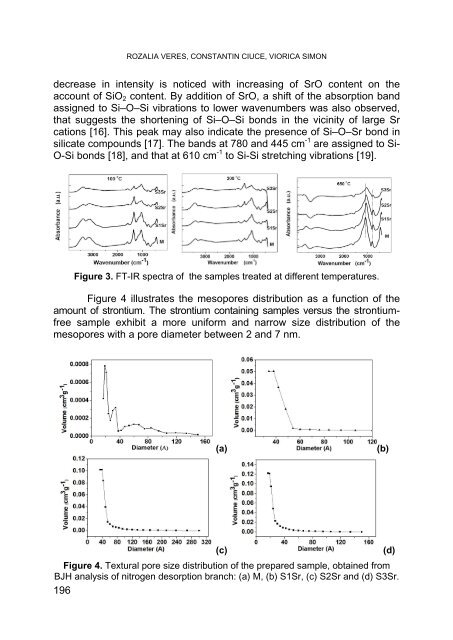
- Page 195: ROZALIA VERES, CONSTANTIN CIUCE, VI
- Page 199 and 200: ROZALIA VERES, CONSTANTIN CIUCE, VI
- Page 202 and 203: STUDIA UBB CHEMIA, LVI, 3, 2011 (p.
- Page 204 and 205: EVALUATION OF FREE RADICAL CONCENTR
- Page 206 and 207: EVALUATION OF FREE RADICAL CONCENTR
- Page 208 and 209: STUDIA UBB CHEMIA, LVI, 3, 2011 (p.
- Page 210 and 211: ECCENTRIC CONNECTIVITY INDEX OF TOR
- Page 212: ECCENTRIC CONNECTIVITY INDEX OF TOR
- Page 215 and 216: DORINA GIRBOVAN, MARIUS AUREL BODEA
- Page 217 and 218: DORINA GIRBOVAN, MARIUS AUREL BODEA
- Page 219 and 220: DORINA GIRBOVAN, MARIUS AUREL BODEA
- Page 221 and 222: DORINA GIRBOVAN, MARIUS AUREL BODEA
- Page 223 and 224: YONG WANG, TAMARIA G. DEWDNEY, ZHIG
- Page 225 and 226: YONG WANG, TAMARIA G. DEWDNEY, ZHIG
- Page 227 and 228: YONG WANG, TAMARIA G. DEWDNEY, ZHIG
- Page 229 and 230: YONG WANG, TAMARIA G. DEWDNEY, ZHIG
- Page 231 and 232: YONG WANG, TAMARIA G. DEWDNEY, ZHIG
- Page 233 and 234: ALEXANDRU LUPAN, CSONGOR MATYAS, AU
- Page 235 and 236: ALEXANDRU LUPAN, CSONGOR MATYAS, AU
- Page 237 and 238: ALEXANDRU LUPAN, CSONGOR MATYAS, AU
- Page 239 and 240: ALEXANDRU LUPAN, CSONGOR MATYAS, AU
- Page 241 and 242: EMILIA VANEA, SIMONA CAVALU, FLORIN
- Page 243 and 244: EMILIA VANEA, SIMONA CAVALU, FLORIN
- Page 245 and 246: EMILIA VANEA, SIMONA CAVALU, FLORIN
- Page 247 and 248:
EMILIA VANEA, SIMONA CAVALU, FLORIN
- Page 249 and 250:
ANDRA TĂMAŞ, MARTIN VINCZE The ma
- Page 251 and 252:
ANDRA TĂMAŞ, MARTIN VINCZE From t
- Page 253 and 254:
ANDRA TĂMAŞ, MARTIN VINCZE 2%B +
- Page 255 and 256:
ANDRA TĂMAŞ, MARTIN VINCZE increa
- Page 258 and 259:
STUDIA UBB CHEMIA, LVI, 3, 2011 (p.
- Page 260 and 261:
EFFECT OF CATALYST LAYER THICKNESS
- Page 262 and 263:
EFFECT OF CATALYST LAYER THICKNESS
- Page 264 and 265:
EFFECT OF CATALYST LAYER THICKNESS
- Page 266 and 267:
STUDIA UBB CHEMIA, LVI, 3, 2011 (p.
- Page 268 and 269:
SPECTRAL INVESTIGATIONS AND DFT STU
- Page 270 and 271:
SPECTRAL INVESTIGATIONS AND DFT STU
- Page 272 and 273:
SPECTRAL INVESTIGATIONS AND DFT STU
- Page 274 and 275:
STUDIA UBB CHEMIA, LVI, 3, 2011 (p.
- Page 276 and 277:
TOPOLOGICAL SYMMETRY OF TWO FAMILIE
- Page 278 and 279:
TOPOLOGICAL SYMMETRY OF TWO FAMILIE
- Page 280 and 281:
STUDIA UBB CHEMIA, LVI, 3, 2011 (p.
- Page 282 and 283:
NEW 1-AZABICYCLO[3.2.2]NONANE DERIV
- Page 284 and 285:
NEW 1-AZABICYCLO[3.2.2]NONANE DERIV
- Page 286 and 287:
NEW 1-AZABICYCLO[3.2.2]NONANE DERIV