Programming with SCILAB (pdf)
Programming with SCILAB (pdf)
Programming with SCILAB (pdf)

You also want an ePaper? Increase the reach of your titles
YUMPU automatically turns print PDFs into web optimized ePapers that Google loves.
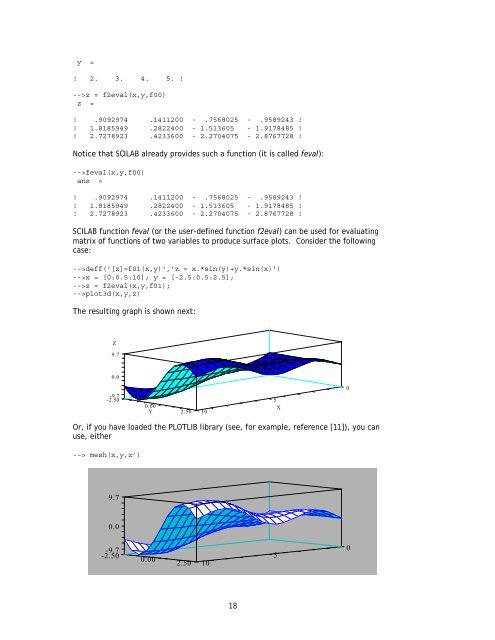
y =<br />
! 2. 3. 4. 5. !<br />
-->z = f2eval(x,y,f00)<br />
z =<br />
! .9092974 .1411200 - .7568025 - .9589243 !<br />
! 1.8185949 .2822400 - 1.513605 - 1.9178485 !<br />
! 2.7278923 .4233600 - 2.2704075 - 2.8767728 !<br />
Notice that <strong>SCILAB</strong> already provides such a function (it is called feval):<br />
-->feval(x,y,f00)<br />
ans =<br />
! .9092974 .1411200 - .7568025 - .9589243 !<br />
! 1.8185949 .2822400 - 1.513605 - 1.9178485 !<br />
! 2.7278923 .4233600 - 2.2704075 - 2.8767728 !<br />
<strong>SCILAB</strong> function feval (or the user-defined function f2eval) can be used for evaluating<br />
matrix of functions of two variables to produce surface plots. Consider the following<br />
case:<br />
-->deff('[z]=f01(x,y)','z = x.*sin(y)+y.*sin(x)')<br />
-->x = [0:0.5:10]; y = [-2.5:0.5:2.5];<br />
-->z = f2eval(x,y,f01);<br />
-->plot3d(x,y,z)<br />
The resulting graph is shown next:<br />
Z<br />
9.7<br />
0.0<br />
-9.7<br />
-2.50<br />
0.00<br />
Y 2.50 10<br />
5<br />
X<br />
0<br />
Or, if you have loaded the PLOTLIB library (see, for example, reference [11]), you can<br />
use, either<br />
--> mesh(x,y,z’)<br />
9.7<br />
0.0<br />
-9.7<br />
-2.50<br />
0.00<br />
2.50 10<br />
5<br />
0<br />
18