ANNUAL REPORT - MTA SzFKI
ANNUAL REPORT - MTA SzFKI
ANNUAL REPORT - MTA SzFKI

You also want an ePaper? Increase the reach of your titles
YUMPU automatically turns print PDFs into web optimized ePapers that Google loves.
Raman spectroscopy is widely used for the characterization of these materials. However it<br />
is rather difficult to obtain specific information on the bonding configuration of only the<br />
grain boundaries from Raman spectra of NCD thin films. These spectra give averaged<br />
information about the bonding configuration of all carbon atoms falling into the excitation<br />
volume being a part of the diamond crystallites or the surrounding amorphous matrix.<br />
Additionally the resonance enhancement of the scattering in the amorphous matrix causes<br />
the intense bands of this phase to overlap the scattering contribution of such minor parts of<br />
the structure, like the grain boundaries.<br />
To overcome these difficulties and to obtain information on the bonding configuration in<br />
grain boundaries from the Raman spectrum of NCD films we have lowered the excitation<br />
volume so that the excitation took place only on a few crystallites. Additionally the<br />
excitation energy was shifted in order to decrease the resonant Raman scattering. This way<br />
the characteristic vibrations from grain boundaries of NCD thin films of different grain<br />
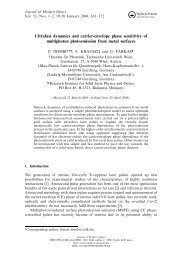
size were detected successfully (Fig. 1) and identified as characteristic bands of aromatic<br />
hydrocarbons and sp 3 CH 2 groups.<br />
A100<br />
Intensity [a.u.]<br />
A100<br />
A50<br />
Intensity [a.u.]<br />
A50<br />
A40<br />
A40<br />
A25<br />
A25<br />
800 1000 1200 1400 1600 1800 2000<br />
Raman shift [cm -1 ]<br />
800 1000 1200 1400 1600 1800 2000<br />
Raman shift [cm -1 ]<br />
Fig. 1. 488 nm (a) and 785 nm (b) excited Raman spectra of ultra-nanocrystalline diamond films of different<br />
grain size: A25, A40, A50 and A100 samples have grain sizes between 3-50 nm, 50-100 nm, 100-150 and<br />
200-300 nm respectively.<br />
The above described method cannot be used for UNCD films having grain sizes below 50<br />
nm, since excitation beam diameter is limited by the diffraction. In the case of these layers<br />
we have used Surface Enhanced Raman Scattering (SERS) to detect characteristic<br />
vibrations from grain boundaries. Putting SERS-active gold nanoparticles (average size is<br />
20 nm) in contact with the UNCD film, the excitation volume from where the SERS signal<br />
arises is limited to a few tens nm surrounding of these nanoparticles. As a result, we were<br />
able to detect characteristic vibrations of the grain boundaries of UNCD thin films too.<br />
66