ANNUAL REPORT - MTA SzFKI
ANNUAL REPORT - MTA SzFKI
ANNUAL REPORT - MTA SzFKI

Create successful ePaper yourself
Turn your PDF publications into a flip-book with our unique Google optimized e-Paper software.
emulsions can be used in a real-time holographic interferometric set-up for the in-situ<br />
microscopic observation of the build-up of holographic gratings in LiNbO 3 .<br />
Hydroxyl ions in potassium lithium niobate crystals. –– The OH – stretch mode spectra<br />
have been measured in both ferroelectric (KLN-1) and non-ferroelectric (KLN-2)<br />
potassium lithium niobate crystals grown from different melt compositions. O-H bond<br />
directions making angles of about 15, 60, and 15 degrees with the c-axis have been<br />
determined for the three main OH – bands in KLN-1 peaking at about 3440, 3500, and 3520<br />
cm -1 , respectively. Correlations have been found along the growth axis of the crystal<br />
between the decrease of the excess Nb content, the change of the hydroxyl band<br />
components at 3440 and 3520 cm -1 , and the Raman modes at 540 cm -1 and 640 cm -1 .<br />
Impurity-centred oxygen tetrahedra in sillenites. –– Fundamental and multi-mode<br />
transitions of the tetrahedral unit modes (A 1 and F 2 ) in Bi 12 SiO 20 , Bi 12 GeO 20 , and<br />
Bi 12 TiO 20 sillenite crystals have been studied by measuring Raman scattering and FTIR<br />
absorption spectra. The ν 1 and ν 3 frequencies related to the A 1 symmetric and F 2<br />
asymmetric stretching modes, respectively, were obtained for MO 4 and ImO 4 tetrahedral<br />
complexes, where M is the host matrix metal, i.e. Si 4+ , Ge 4+ , and Ti 4+ and Im is an<br />
impurity substituting for M. The Im considered belong to three different isoelectronic<br />
series as a) Al 3+ , Si 4+ , P 5+ , S 6+ , b) Ga 3+ , Ge 4+ , As 5+ , Se 6+ , and c) Ti 4+ , V 5+ , Cr 6+ . Ions with<br />
different valence charges, as Cr 4+ , Cr 5+ , Cr 6+ and Mn 4+ , Mn 5+ , were also considered.<br />
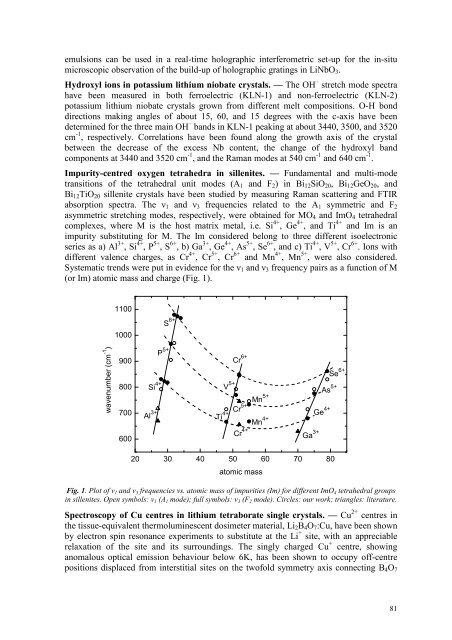
Systematic trends were put in evidence for the ν 1 and ν 3 frequency pairs as a function of M<br />
(or Im) atomic mass and charge (Fig. 1).<br />
1100<br />
S 6+<br />
1000<br />
wavenumber (cm -1 )<br />
900<br />
800<br />
700<br />
600<br />
P 5+<br />
Si 4+<br />
Al 3+<br />
Cr 6+<br />
Se 6+<br />
V 5+ As 5+<br />
Mn 5+<br />
Cr 5+<br />
Ge 4+<br />
Ti 4+ Mn 4+<br />
Cr 4+<br />
Ga 3+<br />
20 30 40 50 60 70 80<br />
atomic mass<br />
Fig. 1. Plot of ν 1 and ν 3 frequencies vs. atomic mass of impurities (Im) for different ImO 4 tetrahedral groups<br />
in sillenites. Open symbols: ν 1 (A 1 mode); full symbols: ν 3 (F 2 mode). Circles: our work; triangles: literature.<br />
Spectroscopy of Cu centres in lithium tetraborate single crystals. –– Cu 2+ centres in<br />
the tissue-equivalent thermoluminescent dosimeter material, Li 2 B 4 O 7 :Cu, have been shown<br />
by electron spin resonance experiments to substitute at the Li + site, with an appreciable<br />
relaxation of the site and its surroundings. The singly charged Cu + centre, showing<br />
anomalous optical emission behaviour below 6K, has been shown to occupy off-centre<br />
positions displaced from interstitial sites on the twofold symmetry axis connecting B 4 O 7<br />
81