Taupo District Flood Hazard Study - Whareroa Stream June 2012
Taupo District Flood Hazard Study - Whareroa Stream June 2012
Taupo District Flood Hazard Study - Whareroa Stream June 2012

Create successful ePaper yourself
Turn your PDF publications into a flip-book with our unique Google optimized e-Paper software.
<strong>Taupo</strong> <strong>District</strong> <strong>Flood</strong> <strong>Hazard</strong> <strong>Study</strong> - <strong>Whareroa</strong> <strong>Stream</strong><br />
consequently can on occasion carry a relatively high sediment load. In the lower catchment<br />
the channel slope decreases, reducing the flow velocity (Figure 2.4). As a result, the energy<br />
of the river decreases reducing its ability to transport sediment. Consequently, a<br />
considerable volume of material has been deposited on the flood plain. Changes to the river<br />
channel can be caused by both natural and anthropogenic processes. <strong>Flood</strong>s, eruptions,<br />
land use change, and tectonic uplift in the upper catchment can all increase the sediment<br />
supply to the river. Higher lake levels and tectonic subsidence can affect where this material<br />
is deposited within the lower <strong>Whareroa</strong> catchment.<br />
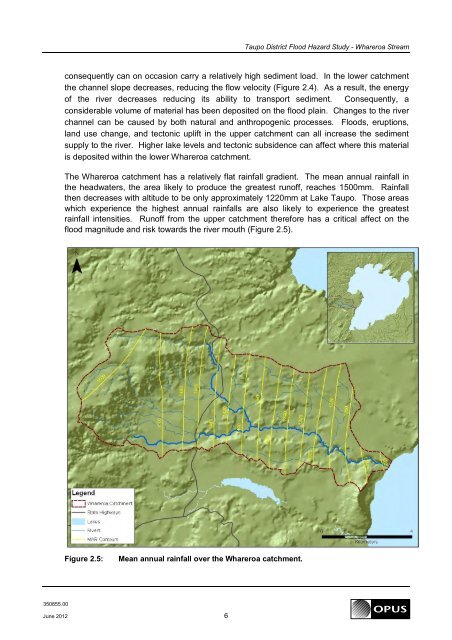
The <strong>Whareroa</strong> catchment has a relatively flat rainfall gradient. The mean annual rainfall in<br />
the headwaters, the area likely to produce the greatest runoff, reaches 1500mm. Rainfall<br />
then decreases with altitude to be only approximately 1220mm at Lake <strong>Taupo</strong>. Those areas<br />
which experience the highest annual rainfalls are also likely to experience the greatest<br />
rainfall intensities. Runoff from the upper catchment therefore has a critical affect on the<br />
flood magnitude and risk towards the river mouth (Figure 2.5).<br />
Figure 2.5:<br />
Mean annual rainfall over the <strong>Whareroa</strong> catchment.<br />
350855.00<br />
<strong>June</strong> <strong>2012</strong> 6