Taupo District Flood Hazard Study - Whareroa Stream June 2012
Taupo District Flood Hazard Study - Whareroa Stream June 2012
Taupo District Flood Hazard Study - Whareroa Stream June 2012

You also want an ePaper? Increase the reach of your titles
YUMPU automatically turns print PDFs into web optimized ePapers that Google loves.
<strong>Taupo</strong> <strong>District</strong> <strong>Flood</strong> <strong>Hazard</strong> <strong>Study</strong> - <strong>Whareroa</strong> <strong>Stream</strong><br />
Table 4.2:<br />
Tectonic deformation (mm) over various time periods.<br />
Time<br />
Period<br />
Kinloch<br />
Whakaipo<br />
Kaiapo<br />
Rangatira<br />
Point<br />
Acacia Bay<br />
Rainbow<br />
Point<br />
Horomatangi<br />
Reef<br />
Rotongaio<br />
Bulli Point<br />
Motuoapa<br />
Waihi<br />
Scenic Bay<br />
Waihaha<br />
Kawakawa<br />
mm/yr -6.8 -4.0 -1.2 2.1 0.6 0.0 2.2 1.1 0.1 -2.3 -2.6 0.6 -1.9 -3.5<br />
2.33 -9 -9 -3 5 1 0 5 3 0 -5 -6 1 -4 -8<br />
5 -34 -20 -6 11 3 0 11 6 1 -12 -13 3 -10 -18<br />
10 -68 -40 -12 21 6 0 22 11 1 -23 -26 6 -19 -35<br />
20 -136 -80 -24 42 12 0 44 22 2 -46 -52 12 -38 -70<br />
50 -340 -200 -60 105 30 0 110 55 5 -115 -130 30 -95 -175<br />
100 -680 -400 -120 210 60 0 220 110 10 -230 -260 60 -190 -350<br />
200 -1360 -800 -240 420 120 0 440 220 20 -460 -520 120 -380 -700<br />
500 -3400 -2000 -600 1050 300 0 1100 550 50 -1150 -1300 300 -950 -1750<br />
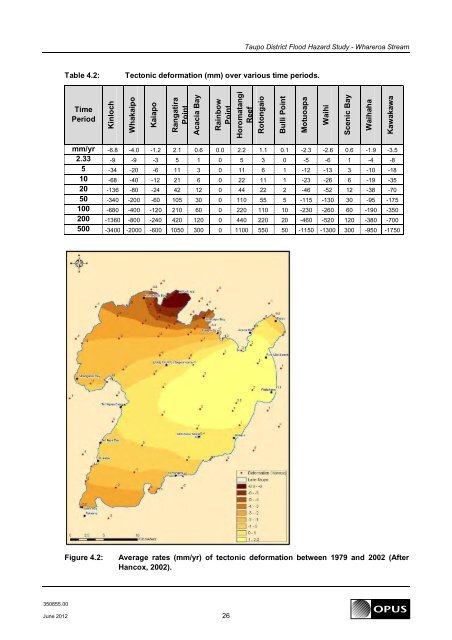
Figure 4.2:<br />
Average rates (mm/yr) of tectonic deformation between 1979 and 2002 (After<br />
Hancox, 2002).<br />
350855.00<br />
<strong>June</strong> <strong>2012</strong> 26