Taupo District Flood Hazard Study - Whareroa Stream June 2012
Taupo District Flood Hazard Study - Whareroa Stream June 2012
Taupo District Flood Hazard Study - Whareroa Stream June 2012

You also want an ePaper? Increase the reach of your titles
YUMPU automatically turns print PDFs into web optimized ePapers that Google loves.
<strong>Taupo</strong> <strong>District</strong> <strong>Flood</strong> <strong>Hazard</strong> <strong>Study</strong> - <strong>Whareroa</strong> <strong>Stream</strong><br />
Given how little exotic forest there is within the catchment, any conversion to pasture would<br />
have little effect on the risk of flooding. If anything, a conversion from pasture to forestry<br />
appears a more likely scenario. Such a conversion would cause a reduction in the flood<br />
peak rather than any increase.<br />
3.8 Potential effects of climate change<br />
If predicted global warming eventuates, it could cause more than just a rise in the world’s<br />
temperature. Warmer temperatures mean that more water vapour will enter the atmosphere.<br />
Higher temperatures will also increase the ability of the air to hold moisture. Therefore, apart<br />
from higher temperatures, the greatest effect of climate change is likely to be on water<br />
resources. Furthermore, sensitivity analysis has indicated that changes in rainfall are always<br />
amplified in runoff, and this effect is greater in drier catchments. A detailed discussion of the<br />
potential effects of climate change within the Lake <strong>Taupo</strong> catchment is provided in<br />
McConchie et al. (2008).<br />
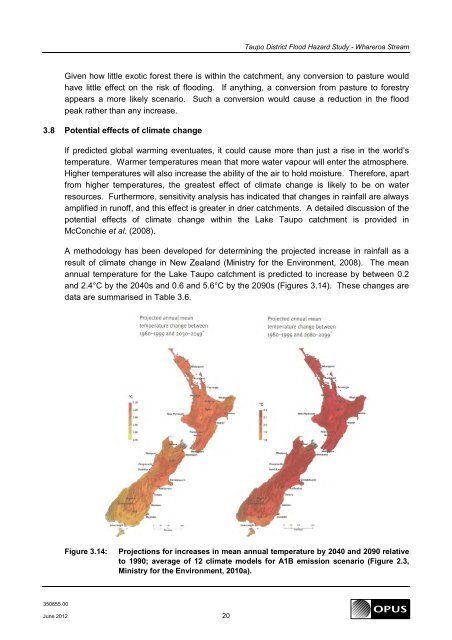
A methodology has been developed for determining the projected increase in rainfall as a<br />
result of climate change in New Zealand (Ministry for the Environment, 2008). The mean<br />
annual temperature for the Lake <strong>Taupo</strong> catchment is predicted to increase by between 0.2<br />
and 2.4°C by the 2040s and 0.6 and 5.6°C by the 2090s (Figures 3.14). These changes are<br />
data are summarised in Table 3.6.<br />
Figure 3.14:<br />
Projections for increases in mean annual temperature by 2040 and 2090 relative<br />
to 1990; average of 12 climate models for A1B emission scenario (Figure 2.3,<br />
Ministry for the Environment, 2010a).<br />
350855.00<br />
<strong>June</strong> <strong>2012</strong> 20