Taupo District Flood Hazard Study - Whareroa Stream June 2012
Taupo District Flood Hazard Study - Whareroa Stream June 2012
Taupo District Flood Hazard Study - Whareroa Stream June 2012

Create successful ePaper yourself
Turn your PDF publications into a flip-book with our unique Google optimized e-Paper software.
<strong>Taupo</strong> <strong>District</strong> <strong>Flood</strong> <strong>Hazard</strong> <strong>Study</strong> - <strong>Whareroa</strong> <strong>Stream</strong><br />
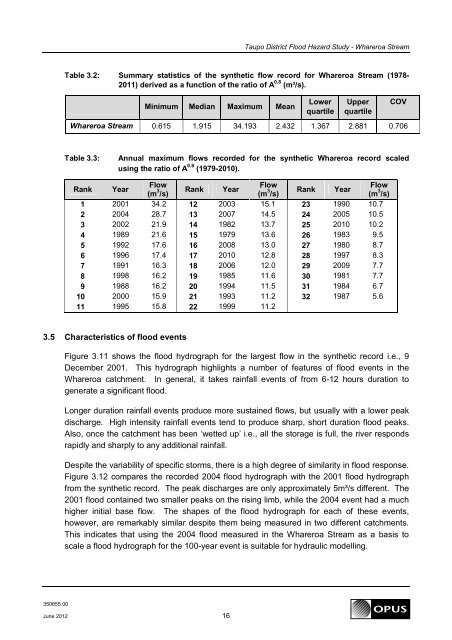
Table 3.2: Summary statistics of the synthetic flow record for <strong>Whareroa</strong> <strong>Stream</strong> (1978-<br />
2011) derived as a function of the ratio of A 0.8 (m³/s).<br />
Minimum Median Maximum Mean<br />
Lower<br />
quartile<br />
Upper<br />
quartile<br />
<strong>Whareroa</strong> <strong>Stream</strong> 0.615 1.915 34.193 2.432 1.367 2.881 0.706<br />
COV<br />
Table 3.3:<br />
Annual maximum flows recorded for the synthetic <strong>Whareroa</strong> record scaled<br />
using the ratio of A 0.8 (1979-2010).<br />
Rank Year<br />
Flow<br />
Flow<br />
Flow<br />
(m 3 Rank Year<br />
/s)<br />
(m 3 Rank Year<br />
/s)<br />
(m 3 /s)<br />
1 2001 34.2 12 2003 15.1 23 1990 10.7<br />
2 2004 28.7 13 2007 14.5 24 2005 10.5<br />
3 2002 21.9 14 1982 13.7 25 2010 10.2<br />
4 1989 21.6 15 1979 13.6 26 1983 9.5<br />
5 1992 17.6 16 2008 13.0 27 1980 8.7<br />
6 1996 17.4 17 2010 12.8 28 1997 8.3<br />
7 1991 16.3 18 2006 12.0 29 2009 7.7<br />
8 1998 16.2 19 1985 11.6 30 1981 7.7<br />
9 1988 16.2 20 1994 11.5 31 1984 6.7<br />
10 2000 15.9 21 1993 11.2 32 1987 5.6<br />
11 1995 15.8 22 1999 11.2<br />
3.5 Characteristics of flood events<br />
Figure 3.11 shows the flood hydrograph for the largest flow in the synthetic record i.e., 9<br />
December 2001. This hydrograph highlights a number of features of flood events in the<br />
<strong>Whareroa</strong> catchment. In general, it takes rainfall events of from 6-12 hours duration to<br />
generate a significant flood.<br />
Longer duration rainfall events produce more sustained flows, but usually with a lower peak<br />
discharge. High intensity rainfall events tend to produce sharp, short duration flood peaks.<br />
Also, once the catchment has been ‘wetted up’ i.e., all the storage is full, the river responds<br />
rapidly and sharply to any additional rainfall.<br />
Despite the variability of specific storms, there is a high degree of similarity in flood response.<br />
Figure 3.12 compares the recorded 2004 flood hydrograph with the 2001 flood hydrograph<br />
from the synthetic record. The peak discharges are only approximately 5m³/s different. The<br />
2001 flood contained two smaller peaks on the rising limb, while the 2004 event had a much<br />
higher initial base flow. The shapes of the flood hydrograph for each of these events,<br />
however, are remarkably similar despite them being measured in two different catchments.<br />
This indicates that using the 2004 flood measured in the <strong>Whareroa</strong> <strong>Stream</strong> as a basis to<br />
scale a flood hydrograph for the 100-year event is suitable for hydraulic modelling.<br />
350855.00<br />
<strong>June</strong> <strong>2012</strong> 16