Taupo District Flood Hazard Study - Whareroa Stream June 2012
Taupo District Flood Hazard Study - Whareroa Stream June 2012
Taupo District Flood Hazard Study - Whareroa Stream June 2012

You also want an ePaper? Increase the reach of your titles
YUMPU automatically turns print PDFs into web optimized ePapers that Google loves.
<strong>Taupo</strong> <strong>District</strong> <strong>Flood</strong> <strong>Hazard</strong> <strong>Study</strong> - <strong>Whareroa</strong> <strong>Stream</strong><br />
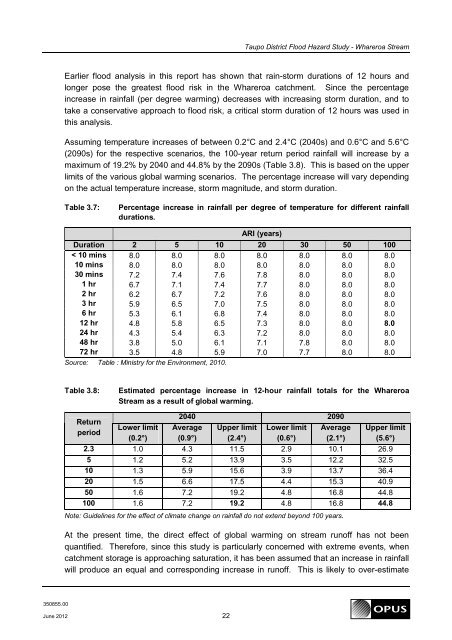
Earlier flood analysis in this report has shown that rain-storm durations of 12 hours and<br />
longer pose the greatest flood risk in the <strong>Whareroa</strong> catchment. Since the percentage<br />
increase in rainfall (per degree warming) decreases with increasing storm duration, and to<br />
take a conservative approach to flood risk, a critical storm duration of 12 hours was used in<br />
this analysis.<br />
Assuming temperature increases of between 0.2°C and 2.4°C (2040s) and 0.6°C and 5.6°C<br />
(2090s) for the respective scenarios, the 100-year return period rainfall will increase by a<br />
maximum of 19.2% by 2040 and 44.8% by the 2090s (Table 3.8). This is based on the upper<br />
limits of the various global warming scenarios. The percentage increase will vary depending<br />
on the actual temperature increase, storm magnitude, and storm duration.<br />
Table 3.7:<br />
Percentage increase in rainfall per degree of temperature for different rainfall<br />
durations.<br />
ARI (years)<br />
Duration 2 5 10 20 30 50 100<br />
< 10 mins 8.0 8.0 8.0 8.0 8.0 8.0 8.0<br />
10 mins 8.0 8.0 8.0 8.0 8.0 8.0 8.0<br />
30 mins 7.2 7.4 7.6 7.8 8.0 8.0 8.0<br />
1 hr 6.7 7.1 7.4 7.7 8.0 8.0 8.0<br />
2 hr 6.2 6.7 7.2 7.6 8.0 8.0 8.0<br />
3 hr 5.9 6.5 7.0 7.5 8.0 8.0 8.0<br />
6 hr 5.3 6.1 6.8 7.4 8.0 8.0 8.0<br />
12 hr 4.8 5.8 6.5 7.3 8.0 8.0 8.0<br />
24 hr 4.3 5.4 6.3 7.2 8.0 8.0 8.0<br />
48 hr 3.8 5.0 6.1 7.1 7.8 8.0 8.0<br />
72 hr 3.5 4.8 5.9 7.0 7.7 8.0 8.0<br />
Source: Table : Ministry for the Environment, 2010.<br />
Table 3.8:<br />
Estimated percentage increase in 12-hour rainfall totals for the <strong>Whareroa</strong><br />
<strong>Stream</strong> as a result of global warming.<br />
Return<br />
period<br />
Lower limit<br />
(0.2°)<br />
2040 2090<br />
Average<br />
(0.9°)<br />
Upper limit<br />
(2.4°)<br />
Lower limit<br />
(0.6°)<br />
Average<br />
(2.1°)<br />
Upper limit<br />
(5.6°)<br />
2.3 1.0 4.3 11.5 2.9 10.1 26.9<br />
5 1.2 5.2 13.9 3.5 12.2 32.5<br />
10 1.3 5.9 15.6 3.9 13.7 36.4<br />
20 1.5 6.6 17.5 4.4 15.3 40.9<br />
50 1.6 7.2 19.2 4.8 16.8 44.8<br />
100 1.6 7.2 19.2 4.8 16.8 44.8<br />
Note: Guidelines for the effect of climate change on rainfall do not extend beyond 100 years.<br />
At the present time, the direct effect of global warming on stream runoff has not been<br />
quantified. Therefore, since this study is particularly concerned with extreme events, when<br />
catchment storage is approaching saturation, it has been assumed that an increase in rainfall<br />
will produce an equal and corresponding increase in runoff. This is likely to over-estimate<br />
350855.00<br />
<strong>June</strong> <strong>2012</strong> 22