Taupo District Flood Hazard Study - Whareroa Stream June 2012
Taupo District Flood Hazard Study - Whareroa Stream June 2012
Taupo District Flood Hazard Study - Whareroa Stream June 2012

Create successful ePaper yourself
Turn your PDF publications into a flip-book with our unique Google optimized e-Paper software.
<strong>Taupo</strong> <strong>District</strong> <strong>Flood</strong> <strong>Hazard</strong> <strong>Study</strong> - <strong>Whareroa</strong> <strong>Stream</strong><br />
3.2 Synthetic flow series<br />
The short flow record from <strong>Whareroa</strong> <strong>Stream</strong> acts as a major constraint on the estimation of<br />
robust design flood magnitudes. Consequently, flows recorded in the adjacent Kuratau River<br />
at SH41 were used to create a long-term synthetic record for <strong>Whareroa</strong> <strong>Stream</strong>.<br />
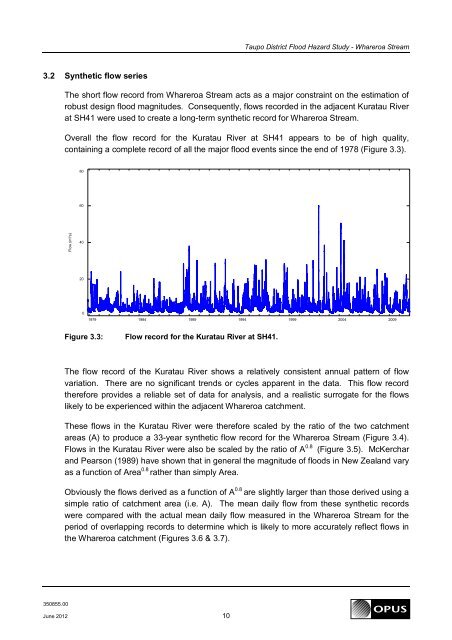
Overall the flow record for the Kuratau River at SH41 appears to be of high quality,<br />
containing a complete record of all the major flood events since the end of 1978 (Figure 3.3).<br />
80<br />
60<br />
Flow (m³/s)<br />
40<br />
20<br />
0<br />
1979 1984 1989 1994 1999 2004 2009<br />
Figure 3.3:<br />
Flow record for the Kuratau River at SH41.<br />
The flow record of the Kuratau River shows a relatively consistent annual pattern of flow<br />
variation. There are no significant trends or cycles apparent in the data. This flow record<br />
therefore provides a reliable set of data for analysis, and a realistic surrogate for the flows<br />
likely to be experienced within the adjacent <strong>Whareroa</strong> catchment.<br />
These flows in the Kuratau River were therefore scaled by the ratio of the two catchment<br />
areas (A) to produce a 33-year synthetic flow record for the <strong>Whareroa</strong> <strong>Stream</strong> (Figure 3.4).<br />
Flows in the Kuratau River were also be scaled by the ratio of A 0.8 (Figure 3.5). McKerchar<br />
and Pearson (1989) have shown that in general the magnitude of floods in New Zealand vary<br />
as a function of Area 0.8 rather than simply Area.<br />
Obviously the flows derived as a function of A 0.8 are slightly larger than those derived using a<br />
simple ratio of catchment area (i.e. A). The mean daily flow from these synthetic records<br />
were compared with the actual mean daily flow measured in the <strong>Whareroa</strong> <strong>Stream</strong> for the<br />
period of overlapping records to determine which is likely to more accurately reflect flows in<br />
the <strong>Whareroa</strong> catchment (Figures 3.6 & 3.7).<br />
350855.00<br />
<strong>June</strong> <strong>2012</strong> 10