MEASUREMENTS
MEASUREMENTS
MEASUREMENTS

Create successful ePaper yourself
Turn your PDF publications into a flip-book with our unique Google optimized e-Paper software.
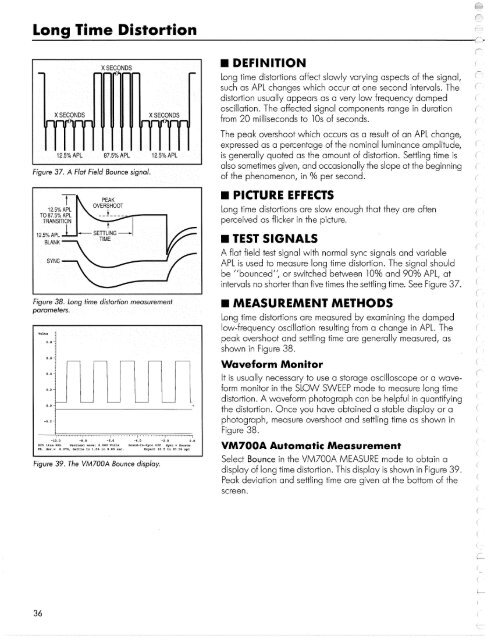
Long Time Distortion<br />
• DEFINITION<br />
Long time distortions affect slowly varying aspects of the signal,<br />
such as APL changes which occur at one second intervals. The<br />
distortion usually appears as a very low frequency damped<br />
oscillation. The affected signal components range in duration<br />
from 20 milliseconds to 10s of seconds.<br />
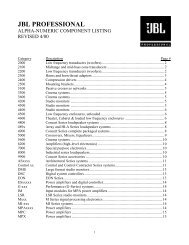
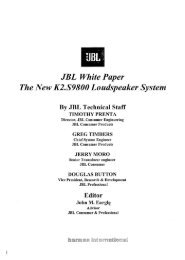
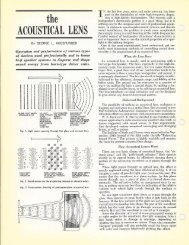
Figure 37. A Flat Field Bounce signal.<br />
The peak overshoot which occurs as a result of an APL change,<br />
expressed as a percentage of the nominal luminance amplitude,<br />
is generally quoted as the amount of distortion. Settling time is<br />
also sometimes given, and occasionally the slope at the beginning<br />
of the phenomenon, in % per second.<br />
• PICTURE EFFECTS<br />
Long time distortions are slow enough that they are often<br />
perceived as flicker in the picture.<br />
• TEST SIGNALS<br />
A flat field test signal with normal sync signals and variable<br />
APL is used to measure long time distortion. The signal should<br />
be "bounced", or switched between 10% and 90% APL, at<br />
intervals no shorter than five times the settling time. See Figure 37.<br />
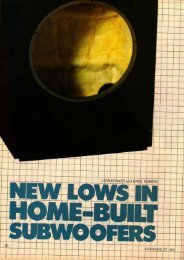
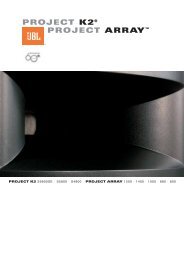
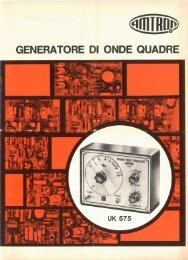
Figure 38. Long time distortion measurement<br />
parameters.<br />
• MEASUREMENT METHODS<br />
Long time distortions are measured by examining the damped<br />
low-frequency oscillation resulting from a change in APL. The<br />
peak overshoot and settling time are generally measured, as<br />
shown in Figure 38.<br />
Waveform Monitor<br />
It is usually necessary to use a storage oscilloscope or a waveform<br />
monitor in the SLOW SWEEP mode to measure long time<br />
distortion. A waveform photograph can be helpful in quantifying<br />
the distortion. Once you have obtained a stable display or a<br />
photograph, measure overshoot and settling time as shown in<br />
Figure 38.<br />
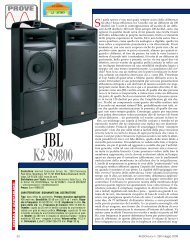
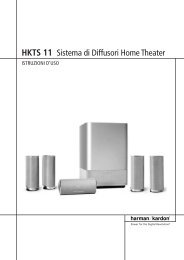
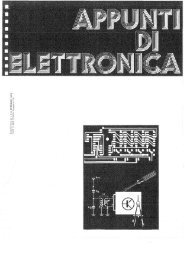
Figure 39. The VM700A Bounce display.<br />
VM700A Automatic Measurement<br />
Select Bounce in the VM700A MEASURE mode to obtain a<br />
display of long time distortion. This display is shown in Figure 39.<br />
Peak deviation and settling time are given at the bottom of the<br />
screen.<br />
36