MEASUREMENTS
MEASUREMENTS
MEASUREMENTS

Create successful ePaper yourself
Turn your PDF publications into a flip-book with our unique Google optimized e-Paper software.
Group Delay<br />
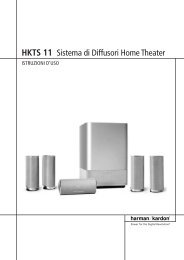
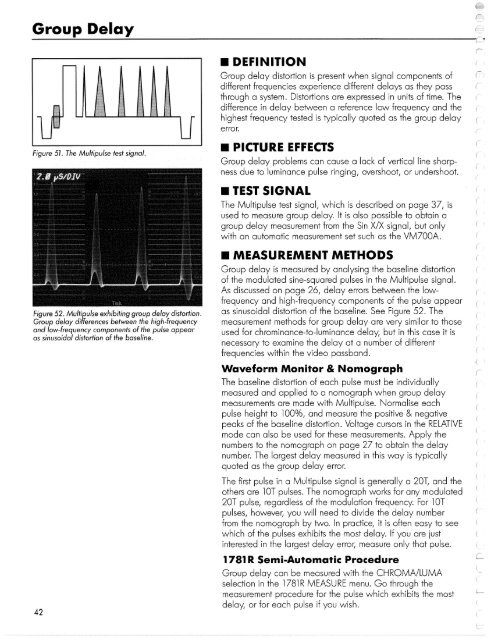
Figure 51. The Multipulse test signal.<br />
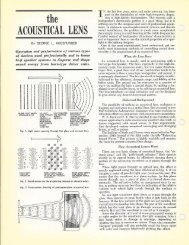
Figure 52. Multipulse exhibiting group delay distortion.<br />
Group delay differences between the high-frequency<br />
and low-frequency components of the pulse appear<br />
as sinusoidal distortion of the baseline.<br />
42<br />
• DEFINITION<br />
Group delay distortion is present when signal components of<br />
different frequencies experience different delays as they pass<br />
through a system. Distortions are expressed in units of time. The<br />
difference in delay between a reference low frequency and the<br />
highest frequency tested is typically quoted as the group delay<br />
error.<br />
• PICTURE EFFECTS<br />
Group delay problems can cause a lack of vertical line sharpness<br />
due to luminance pulse ringing, overshoot, or undershoot.<br />
• TEST SIGNAL<br />
The Multipulse test signal, which is described on page 37, is<br />
used to measure group delay. It is also possible to obtain a<br />
group delay measurement from the Sin X/X signal, but only<br />
with an automatic measurement set such as the VM700A.<br />
• MEASUREMENT METHODS<br />
Group delay is measured by analysing the baseline distortion<br />
of the modulated sine-squared pulses in the Multipulse signal.<br />
As discussed on page 26, delay errors between the lowfrequency<br />
and high-frequency components of the pulse appear<br />
as sinusoidal distortion of the baseline. See Figure 52. The<br />
measurement methods for group delay are very similar to those<br />
used for chrominance-to-luminance delay, but in this case it is<br />
necessary to examine the delay at a number of different<br />
frequencies within the video passband.<br />
Waveform Monitor & Nomograph<br />
The baseline distortion of each pulse must be individually<br />
measured and applied to a nomograph when group delay<br />
measurements are made with Multipulse. Normalise each<br />
pulse height to 100%, and measure the positive & negative<br />
peaks of the baseline distortion. Voltage cursors in the RELATIVE<br />
mode can also be used for these measurements. Apply the<br />
numbers to the nomograph on page 27 to obtain the delay<br />
number. The largest delay measured in this way is typically<br />
quoted as the group delay error.<br />
The first pulse in a Multipulse signal is generally a 20T, and the<br />
others are 10T pulses. The nomograph works for any modulated<br />
20T pulse, regardless of the modulation frequency. For 10T<br />
pulses, however, you will need to divide the delay number<br />
from the nomograph by two. In practice, it is often easy to see<br />
which of the pulses exhibits the most delay. If you are just<br />
interested in the largest delay error, measure only that pulse.<br />
1781R Semi-Auto ma tic Procedure<br />
Group delay can be measured with the CHROMA/LUMA<br />
selection in the 1Z81R MEASURE menu. Go through the<br />
measurement procedure for the pulse which exhibits the most<br />
delay, or for each pulse if you wish.