Sizing Guide Exchange Server 2003 - Fujitsu
Sizing Guide Exchange Server 2003 - Fujitsu
Sizing Guide Exchange Server 2003 - Fujitsu

You also want an ePaper? Increase the reach of your titles
YUMPU automatically turns print PDFs into web optimized ePapers that Google loves.
White Paper <strong>Sizing</strong> <strong>Guide</strong> <strong>Exchange</strong> <strong>Server</strong> <strong>2003</strong> Version: 4.2, July 2006<br />
Performance analysis<br />
Windows and applications such as <strong>Exchange</strong> <strong>Server</strong> provide performance counters for all relevant<br />
components. These performance counters can be viewed, monitored and recorded through a standardized<br />
interface with the performance monitor that is available in all Windows versions – also known as system<br />
monitor in some Windows versions.<br />
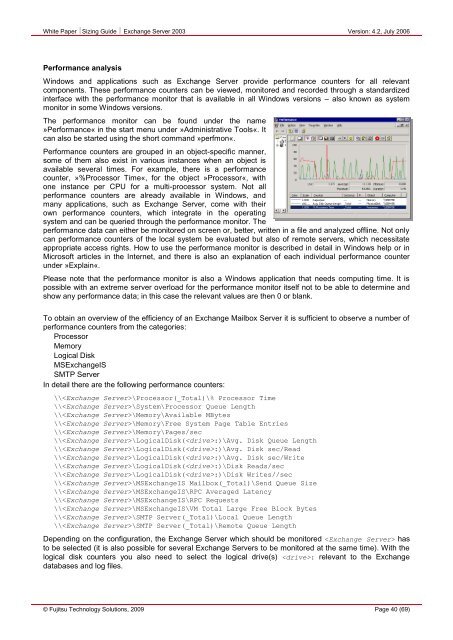
The performance monitor can be found under the name<br />
»Performance« in the start menu under »Administrative Tools«. It<br />
can also be started using the short command »perfmon«.<br />
Performance counters are grouped in an object-specific manner,<br />
some of them also exist in various instances when an object is<br />
available several times. For example, there is a performance<br />
counter, »%Processor Time«, for the object »Processor«, with<br />
one instance per CPU for a multi-processor system. Not all<br />
performance counters are already available in Windows, and<br />
many applications, such as <strong>Exchange</strong> <strong>Server</strong>, come with their<br />
own performance counters, which integrate in the operating<br />
system and can be queried through the performance monitor. The<br />
performance data can either be monitored on screen or, better, written in a file and analyzed offline. Not only<br />
can performance counters of the local system be evaluated but also of remote servers, which necessitate<br />
appropriate access rights. How to use the performance monitor is described in detail in Windows help or in<br />
Microsoft articles in the Internet, and there is also an explanation of each individual performance counter<br />
under »Explain«.<br />
Please note that the performance monitor is also a Windows application that needs computing time. It is<br />
possible with an extreme server overload for the performance monitor itself not to be able to determine and<br />
show any performance data; in this case the relevant values are then 0 or blank.<br />
To obtain an overview of the efficiency of an <strong>Exchange</strong> Mailbox <strong>Server</strong> it is sufficient to observe a number of<br />
performance counters from the categories:<br />
Processor<br />
Memory<br />
Logical Disk<br />
MS<strong>Exchange</strong>IS<br />
SMTP <strong>Server</strong><br />
In detail there are the following performance counters:<br />
\\\Processor(_Total)\% Processor Time<br />
\\\System\Processor Queue Length<br />
\\\Memory\Available MBytes<br />
\\\Memory\Free System Page Table Entries<br />
\\\Memory\Pages/sec<br />
\\\LogicalDisk(:)\Avg. Disk Queue Length<br />
\\\LogicalDisk(:)\Avg. Disk sec/Read<br />
\\\LogicalDisk(:)\Avg. Disk sec/Write<br />
\\\LogicalDisk(:)\Disk Reads/sec<br />
\\\LogicalDisk(:)\Disk Writes//sec<br />
\\\MS<strong>Exchange</strong>IS Mailbox(_Total)\Send Queue Size<br />
\\\MS<strong>Exchange</strong>IS\RPC Averaged Latency<br />
\\\MS<strong>Exchange</strong>IS\RPC Requests<br />
\\\MS<strong>Exchange</strong>IS\VM Total Large Free Block Bytes<br />
\\\SMTP <strong>Server</strong>(_Total)\Local Queue Length<br />
\\\SMTP <strong>Server</strong>(_Total)\Remote Queue Length<br />
Depending on the configuration, the <strong>Exchange</strong> <strong>Server</strong> which should be monitored has<br />
to be selected (it is also possible for several <strong>Exchange</strong> <strong>Server</strong>s to be monitored at the same time). With the<br />
logical disk counters you also need to select the logical drive(s) : relevant to the <strong>Exchange</strong><br />
databases and log files.<br />
© <strong>Fujitsu</strong> Technology Solutions, 2009 Page 40 (69)