East Belfast Sectoral Study - Northern Ireland Housing Executive
East Belfast Sectoral Study - Northern Ireland Housing Executive
East Belfast Sectoral Study - Northern Ireland Housing Executive

Create successful ePaper yourself
Turn your PDF publications into a flip-book with our unique Google optimized e-Paper software.
3.0 Demographic/Socio Economic Context<br />
3.1 Population<br />
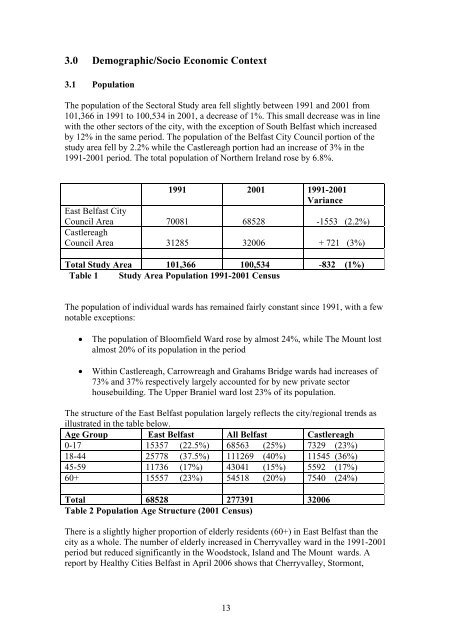
The population of the <strong>Sectoral</strong> <strong>Study</strong> area fell slightly between 1991 and 2001 from<br />
101,366 in 1991 to 100,534 in 2001, a decrease of 1%. This small decrease was in line<br />
with the other sectors of the city, with the exception of South <strong>Belfast</strong> which increased<br />
by 12% in the same period. The population of the <strong>Belfast</strong> City Council portion of the<br />
study area fell by 2.2% while the Castlereagh portion had an increase of 3% in the<br />
1991-2001 period. The total population of <strong>Northern</strong> <strong>Ireland</strong> rose by 6.8%.<br />
1991 2001 1991-2001<br />
Variance<br />
<strong>East</strong> <strong>Belfast</strong> City<br />
Council Area 70081 68528 -1553 (2.2%)<br />
Castlereagh<br />
Council Area 31285 32006 + 721 (3%)<br />
Total <strong>Study</strong> Area 101,366 100,534 -832 (1%)<br />
Table 1 <strong>Study</strong> Area Population 1991-2001 Census<br />
The population of individual wards has remained fairly constant since 1991, with a few<br />
notable exceptions:<br />
• The population of Bloomfield Ward rose by almost 24%, while The Mount lost<br />
almost 20% of its population in the period<br />
• Within Castlereagh, Carrowreagh and Grahams Bridge wards had increases of<br />
73% and 37% respectively largely accounted for by new private sector<br />
housebuilding. The Upper Braniel ward lost 23% of its population.<br />
The structure of the <strong>East</strong> <strong>Belfast</strong> population largely reflects the city/regional trends as<br />
illustrated in the table below.<br />
Age Group <strong>East</strong> <strong>Belfast</strong> All <strong>Belfast</strong> Castlereagh<br />
0-17 15357 (22.5%) 68563 (25%) 7329 (23%)<br />
18-44 25778 (37.5%) 111269 (40%) 11545 (36%)<br />
45-59 11736 (17%) 43041 (15%) 5592 (17%)<br />
60+ 15557 (23%) 54518 (20%) 7540 (24%)<br />
Total 68528 277391 32006<br />
Table 2 Population Age Structure (2001 Census)<br />
There is a slightly higher proportion of elderly residents (60+) in <strong>East</strong> <strong>Belfast</strong> than the<br />
city as a whole. The number of elderly increased in Cherryvalley ward in the 1991-2001<br />
period but reduced significantly in the Woodstock, Island and The Mount wards. A<br />
report by Healthy Cities <strong>Belfast</strong> in April 2006 shows that Cherryvalley, Stormont,<br />
13