- Page 1 and 2: National Wildfire Coordinating Grou
- Page 3 and 4: Ecosystems have evolved with, and a
- Page 5 and 6: discussions of fire effects on fuel
- Page 7 and 8: During the planning of fire managem
- Page 9 and 10: Land use planning systems used by m
- Page 11 and 12: individual resource functions. At t
- Page 13 and 14: living and dead vegetation, the lat
- Page 15 and 16: front heats adjacent fuel elements.
- Page 17 and 18: iv. Logging slash: the primary carr
- Page 19 and 20: viii. Fuel continuity. Fuel continu
- Page 21 and 22: much lower for light, airy fuels su
- Page 23 and 24: (4) Heat per unit area. Another mea
- Page 25 and 26: ii. Active crown fires are those in
- Page 27 and 28: of duff and organic layers, and the
- Page 29 and 30: (3) A high severity fire removes al
- Page 31 and 32: years and relating moisture levels
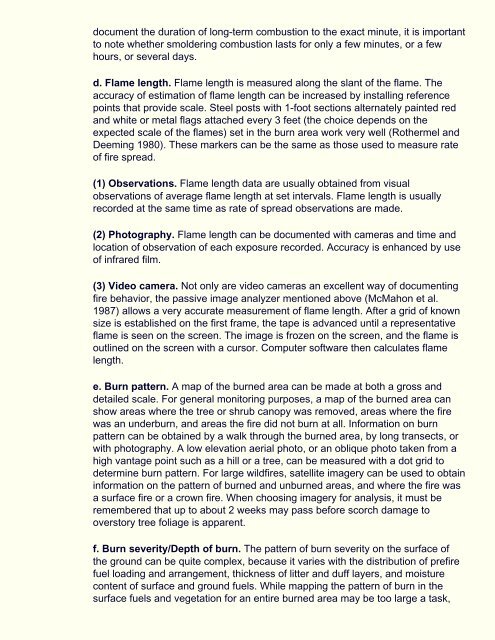
- Page 33 and 34: flame lengths can be greater. More
- Page 35: ight paint. Times are recorded with
- Page 39 and 40: National Wildfire Coordinating Grou
- Page 41 and 42: grass plants lying on or near the s
- Page 43 and 44: (3) Quality. Wood may be sound, rot
- Page 45 and 46: and Norum 1983); white spruce/subal
- Page 47 and 48: combination of atmospheric temperat
- Page 49 and 50: 1-hour timelag fuels (Anderson 1990
- Page 51 and 52: f. Effect of weather factors on fue
- Page 53 and 54: y species morphology and physiology
- Page 55 and 56: levels of moisture content. (See II
- Page 57 and 58: value reached by early September (P
- Page 59 and 60: time is, in many cases, not true (B
- Page 61 and 62: years has resulted in higher loadin
- Page 63 and 64: for heat release, if fuels are remo
- Page 65 and 66: for assessing fuels. The time of ye
- Page 67 and 68: Supplementary information on fire b
- Page 69 and 70: If fuels inside and outside of the
- Page 71 and 72: Results are obtained within about 1
- Page 73 and 74: conditions for a prescribed fire ma
- Page 75 and 76: Designated Class I Areas include sp
- Page 77 and 78: is inadequate to loft the smoke as
- Page 79 and 80: temperature of the fire. a. Combust
- Page 81 and 82: containing hydrogen, carbon, and ot
- Page 83 and 84: 1989 in Sandberg and Dost 1990). Na
- Page 85 and 86: when energy is most needed. Formald
- Page 87 and 88:
are based on limiting the consumpti
- Page 89 and 90:
management programs. Programs are t
- Page 91 and 92:
against ambient air quality standar
- Page 93 and 94:
National Wildfire Coordinating Grou
- Page 95 and 96:
fires typically result in soil surf
- Page 97 and 98:
(1) Organic matter. The reduction o
- Page 99 and 100:
Nitrobacter, two bacteria groups cr
- Page 101 and 102:
mixed results, in attempts to incre
- Page 103 and 104:
. Adjacent, unburned "control" site
- Page 105 and 106:
methods used to monitor fire effect
- Page 107 and 108:
tension into the time (up to 600 se
- Page 109 and 110:
temperature sampling scheme should
- Page 111 and 112:
dry material and cannot be ignited.
- Page 113 and 114:
diameter of most shrub stems, most
- Page 115 and 116:
is controlled by a phenomenon calle
- Page 117 and 118:
its moisture content when the fire
- Page 119 and 120:
plant and the rate at which the lit
- Page 121 and 122:
fire. However, there is considerabl
- Page 123 and 124:
. Carbohydrates. (1) Carbohydrate c
- Page 125 and 126:
dominate the community for varying
- Page 127 and 128:
Greatly increased amounts of flower
- Page 129 and 130:
(2) Duration of heating is generall
- Page 131 and 132:
(1) The amount and timing of high a
- Page 133 and 134:
Specific attributes of vegetation o
- Page 135 and 136:
3. Frequency of Occurrence. A quant
- Page 137 and 138:
(See 4. Weight) Changes in height a
- Page 139 and 140:
applied. Live tissue will turn brig
- Page 141 and 142:
National Wildfire Coordinating Grou
- Page 143 and 144:
ecosystem dynamics and the ramifica
- Page 145 and 146:
a. Ecological basis. Faunal success
- Page 147 and 148:
(4) The interplay between only one
- Page 149 and 150:
It is commonly assumed that increas
- Page 151 and 152:
of the external environment. A noti
- Page 153 and 154:
habitat size is approximately 200 a
- Page 155 and 156:
truncated ecosystems affected by ma
- Page 157 and 158:
plantations, fences, and recent pre
- Page 159 and 160:
(4) What postburn timelags for stru
- Page 161 and 162:
(2) Increase the size of the prescr
- Page 163 and 164:
3. Monitoring Level. The level of m
- Page 165 and 166:
Without adequate monitoring and eva
- Page 167 and 168:
sources as well as others noted. It
- Page 169 and 170:
1973). Beyond that temperature, sto
- Page 171 and 172:
obsidian artifact. Moisture is abso
- Page 173 and 174:
abundant cultural resources in the
- Page 175 and 176:
avoid rock outcrops where rock art
- Page 177 and 178:
E. Summary Damage to cultural resou
- Page 179 and 180:
1. General Need for Improved Manage
- Page 181 and 182:
at a rate to permit improvement" (D
- Page 183 and 184:
idahoensis), green needlegrass (Sti
- Page 185 and 186:
grass species are damaged or lackin
- Page 187 and 188:
(2) Severely depleted sites may req
- Page 189 and 190:
6. Economic Factors. The following
- Page 191 and 192:
National Wildfire Coordinating Grou
- Page 193 and 194:
are still suitable. (2) Wildfire. T
- Page 195 and 196:
h. Observe long-term changes. C. Ev
- Page 197 and 198:
(12) Resource maps, such as vegetat
- Page 199 and 200:
Recommendations. a. Prescribed fire
- Page 201 and 202:
(b) Feasibility of conducting salva
- Page 203 and 204:
h. Professional journals. i. Videos
- Page 205 and 206:
National Wildfire Coordinating Grou
- Page 207 and 208:
1 70 4900 2 90 8100 3 80 6400 4 70
- Page 209 and 210:
Sufficient rate of spread and flame
- Page 211 and 212:
available, the following example il
- Page 213 and 214:
work do not imply any cause and eff
- Page 215 and 216:
9. It is tempting to draw inappropr
- Page 217 and 218:
National Wildfire Coordinating Grou
- Page 219 and 220:
as 60 days of 24-hour observations
- Page 221 and 222:
have a low probability of occurring
- Page 223 and 224:
conditions based upon desired fire
- Page 225 and 226:
One can select one of these species
- Page 227 and 228:
employees can contact their nationa
- Page 229 and 230:
effects. The Bureau of Land Managem
- Page 231 and 232:
National Wildfire Coordinating Grou
- Page 233 and 234:
never moist as long as three consec
- Page 235 and 236:
url: a mass of woody tissue from wh
- Page 237 and 238:
coordinated resource management: a
- Page 239 and 240:
discrete variables: those variables
- Page 241 and 242:
experimental design: the process of
- Page 243 and 244:
absence of individuals of a species
- Page 245 and 246:
heat content: the net amount of hea
- Page 247 and 248:
- L - ladder fuels: fuels that can
- Page 249 and 250:
mycorrhiza (pl. mycorrhizae): a mut
- Page 251 and 252:
palatability: the relish that an an
- Page 253 and 254:
attain planned fire treatment and r
- Page 255 and 256:
oot crown: a mass of woody tissue f
- Page 257 and 258:
plant species to another using a co
- Page 259 and 260:
e estimated by heating it and measu
- Page 261 and 262:
|Disclaimer| | Privacy| | Copyright
- Page 263 and 264:
and Range Exp. Sta., Ogden, UT. 22
- Page 265 and 266:
Seasonal variation in moisture cont
- Page 267 and 268:
material. USDA, For. Serv. Gen. Tec
- Page 269 and 270:
Exp. Sta., Ogden, UT. 126 p. Burger
- Page 271 and 272:
Forest Service. Gen. Tech. Rep. PSW
- Page 273 and 274:
Exp. Sta., Berkeley, CA. 7 p. Dixon
- Page 275 and 276:
subalpine fir cover types. USDA, Fo
- Page 277 and 278:
management approaches. Wildl. Soc.
- Page 279 and 280:
Gen. Tech. Rep. INT-225. Intermt. R
- Page 281 and 282:
Hutchison, B. A. 1965. Snow accumul
- Page 283 and 284:
Washington, D.C. Lawrence, G. E. 19
- Page 285 and 286:
Dieterich, Stanley N. Hirsch, Von J
- Page 287 and 288:
McRae, Douglas J., Martin E. Alexan
- Page 289 and 290:
Norum, Rodney A. 1977. Preliminary
- Page 291 and 292:
Black (ed.). Methods of soil analys
- Page 293 and 294:
Reaves, Jimmy L., Charles G. Shaw,
- Page 295 and 296:
For. and Range Exp. Sta., Ogden, UT
- Page 297 and 298:
Contr. IAG EPA 83-291. Office Air P
- Page 299 and 300:
26 p. Short, H. L. 1982. Techniques
- Page 301 and 302:
Bot. 28:143-231. Switzer, Ronald R.
- Page 303 and 304:
for Title II-Related Agencies and t
- Page 305 and 306:
p. 358-366. IN Alan Ternes (ed.). A
- Page 307 and 308:
Wright, H. E., Jr. 1981. The role o
- Page 309 and 310:
study in Nevada, p. 66-84. IN Ken S
- Page 311 and 312:
Introduction - Dr. Bob Clark and Me
- Page 313:
Steve Lent, Bureau of Land Manageme