Baseline Study Report on CQ of WAB final - International ...
Baseline Study Report on CQ of WAB final - International ...
Baseline Study Report on CQ of WAB final - International ...

You also want an ePaper? Increase the reach of your titles
YUMPU automatically turns print PDFs into web optimized ePapers that Google loves.
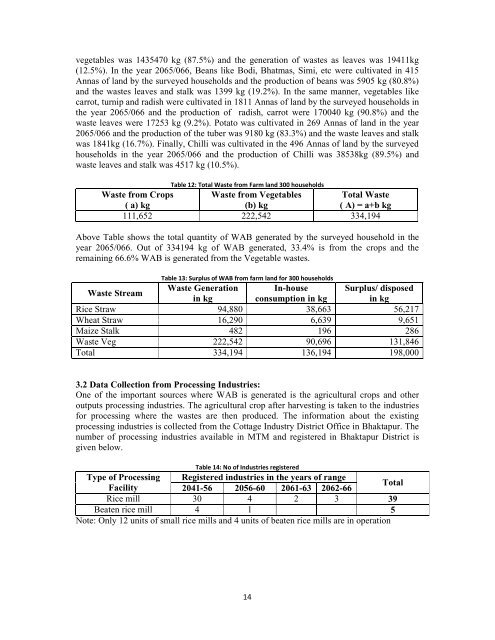
vegetables was 1435470 kg (87.5%) and the generati<strong>on</strong> <strong>of</strong> wastes as leaves was 19411kg<br />
(12.5%). In the year 2065/066, Beans like Bodi, Bhatmas, Simi, etc were cultivated in 415<br />
Annas <strong>of</strong> land by the surveyed households and the producti<strong>on</strong> <strong>of</strong> beans was 5905 kg (80.8%)<br />
and the wastes leaves and stalk was 1399 kg (19.2%). In the same manner, vegetables like<br />
carrot, turnip and radish were cultivated in 1811 Annas <strong>of</strong> land by the surveyed households in<br />
the year 2065/066 and the producti<strong>on</strong> <strong>of</strong> radish, carrot were 170040 kg (90.8%) and the<br />
waste leaves were 17253 kg (9.2%). Potato was cultivated in 269 Annas <strong>of</strong> land in the year<br />
2065/066 and the producti<strong>on</strong> <strong>of</strong> the tuber was 9180 kg (83.3%) and the waste leaves and stalk<br />
was 1841kg (16.7%). Finally, Chilli was cultivated in the 496 Annas <strong>of</strong> land by the surveyed<br />
households in the year 2065/066 and the producti<strong>on</strong> <strong>of</strong> Chilli was 38538kg (89.5%) and<br />
waste leaves and stalk was 4517 kg (10.5%).<br />
Table 12: Total Waste from Farm land 300 households<br />
Waste from Crops Waste from Vegetables Total Waste<br />
( a) kg<br />
(b) kg<br />
( A) = a+b kg<br />
111,652 222,542 334,194<br />
Above Table shows the total quantity <strong>of</strong> <strong>WAB</strong> generated by the surveyed household in the<br />
year 2065/066. Out <strong>of</strong> 334194 kg <strong>of</strong> <strong>WAB</strong> generated, 33.4% is from the crops and the<br />
remaining 66.6% <strong>WAB</strong> is generated from the Vegetable wastes.<br />
Table 13: Surplus <strong>of</strong> <strong>WAB</strong> from farm land for 300 households<br />
Waste Stream<br />
Waste Generati<strong>on</strong> In-house Surplus/ disposed<br />
in kg c<strong>on</strong>sumpti<strong>on</strong> in kg in kg<br />
Rice Straw 94,880 38,663 56,217<br />
Wheat Straw 16,290 6,639 9,651<br />
Maize Stalk 482 196 286<br />
Waste Veg 222,542 90,696 131,846<br />
Total 334,194 136,194 198,000<br />
3.2 Data Collecti<strong>on</strong> from Processing Industries:<br />
One <strong>of</strong> the important sources where <strong>WAB</strong> is generated is the agricultural crops and other<br />
outputs processing industries. The agricultural crop after harvesting is taken to the industries<br />
for processing where the wastes are then produced. The informati<strong>on</strong> about the existing<br />
processing industries is collected from the Cottage Industry District Office in Bhaktapur. The<br />
number <strong>of</strong> processing industries available in MTM and registered in Bhaktapur District is<br />
given below.<br />
Table 14: No <strong>of</strong> Industries registered<br />
Type <strong>of</strong> Processing Registered industries in the years <strong>of</strong> range<br />
Facility 2041-56 2056-60 2061-63 2062-66<br />
Total<br />
Rice mill 30 4 2 3 39<br />
Beaten rice mill 4 1 5<br />
Note: Only 12 units <strong>of</strong> small rice mills and 4 units <strong>of</strong> beaten rice mills are in operati<strong>on</strong><br />
14