Baseline Study Report on CQ of WAB final - International ...
Baseline Study Report on CQ of WAB final - International ...
Baseline Study Report on CQ of WAB final - International ...

Create successful ePaper yourself
Turn your PDF publications into a flip-book with our unique Google optimized e-Paper software.
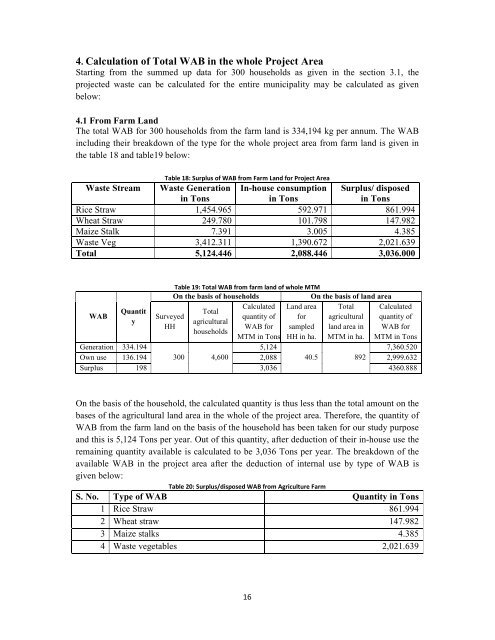
4. Calculati<strong>on</strong> <strong>of</strong> Total <strong>WAB</strong> in the whole Project Area<br />
Starting from the summed up data for 300 households as given in the secti<strong>on</strong> 3.1, the<br />
projected waste can be calculated for the entire municipality may be calculated as given<br />
below:<br />
4.1 From Farm Land<br />
The total <strong>WAB</strong> for 300 households from the farm land is 334,194 kg per annum. The <strong>WAB</strong><br />
including their breakdown <strong>of</strong> the type for the whole project area from farm land is given in<br />
the table 18 and table19 below:<br />
Table 18: Surplus <strong>of</strong> <strong>WAB</strong> from Farm Land for Project Area<br />
Waste Stream Waste Generati<strong>on</strong><br />
in T<strong>on</strong>s<br />
In-house c<strong>on</strong>sumpti<strong>on</strong><br />
in T<strong>on</strong>s<br />
Surplus/ disposed<br />
in T<strong>on</strong>s<br />
Rice Straw 1,454.965 592.971 861.994<br />
Wheat Straw 249.780 101.798 147.982<br />
Maize Stalk 7.391 3.005 4.385<br />
Waste Veg 3,412.311 1,390.672 2,021.639<br />
Total 5,124.446 2,088.446 3,036.000<br />
Table 19: Total <strong>WAB</strong> from farm land <strong>of</strong> whole MTM<br />
On the basis <strong>of</strong> households<br />
On the basis <strong>of</strong> land area<br />
Calculated Land area Total Calculated<br />
Quantit<br />
Total<br />
<strong>WAB</strong><br />
Surveyed<br />
quantity <strong>of</strong> for agricultural quantity <strong>of</strong><br />
y<br />
agricultural<br />
HH<br />
<strong>WAB</strong> for sampled land area in <strong>WAB</strong> for<br />
households<br />
MTM in T<strong>on</strong>s HH in ha. MTM in ha. MTM in T<strong>on</strong>s<br />
Generati<strong>on</strong> 334.194 5,124 7,360.520<br />
Own use 136.194 300 4,600 2,088 40.5 892 2,999.632<br />
Surplus 198<br />
3,036<br />
4360.888<br />
On the basis <strong>of</strong> the household, the calculated quantity is thus less than the total amount <strong>on</strong> the<br />
bases <strong>of</strong> the agricultural land area in the whole <strong>of</strong> the project area. Therefore, the quantity <strong>of</strong><br />
<strong>WAB</strong> from the farm land <strong>on</strong> the basis <strong>of</strong> the household has been taken for our study purpose<br />
and this is 5,124 T<strong>on</strong>s per year. Out <strong>of</strong> this quantity, after deducti<strong>on</strong> <strong>of</strong> their in-house use the<br />
remaining quantity available is calculated to be 3,036 T<strong>on</strong>s per year. The breakdown <strong>of</strong> the<br />
available <strong>WAB</strong> in the project area after the deducti<strong>on</strong> <strong>of</strong> internal use by type <strong>of</strong> <strong>WAB</strong> is<br />
given below:<br />
Table 20: Surplus/disposed <strong>WAB</strong> from Agriculture Farm<br />
S. No. Type <strong>of</strong> <strong>WAB</strong> Quantity in T<strong>on</strong>s<br />
1 Rice Straw 861.994<br />
2 Wheat straw 147.982<br />
3 Maize stalks 4.385<br />
4 Waste vegetables 2,021.639<br />
16