Baseline Study Report on CQ of WAB final - International ...
Baseline Study Report on CQ of WAB final - International ...
Baseline Study Report on CQ of WAB final - International ...

Create successful ePaper yourself
Turn your PDF publications into a flip-book with our unique Google optimized e-Paper software.
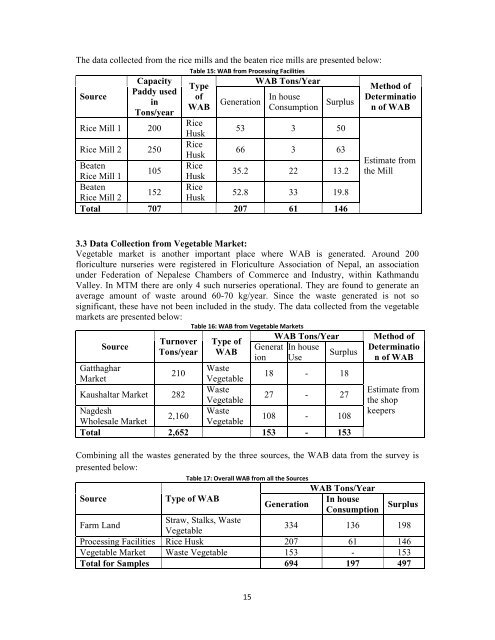
The data collected from the rice mills and the beaten rice mills are presented below:<br />
Table 15: <strong>WAB</strong> from Processing Facilities<br />
<strong>WAB</strong> T<strong>on</strong>s/Year<br />
Source<br />
Capacity<br />
Paddy used<br />
in<br />
T<strong>on</strong>s/year<br />
Type<br />
<strong>of</strong><br />
<strong>WAB</strong><br />
Generati<strong>on</strong><br />
In house<br />
C<strong>on</strong>sumpti<strong>on</strong><br />
Surplus<br />
Rice Mill 1 200<br />
Rice<br />
Husk<br />
53 3 50<br />
Rice Mill 2 250<br />
Rice<br />
Husk<br />
66 3 63<br />
Beaten<br />
Rice<br />
105<br />
Rice Mill 1<br />
Husk<br />
35.2 22 13.2<br />
Beaten<br />
Rice<br />
152<br />
Rice Mill 2<br />
Husk<br />
52.8 33 19.8<br />
Total 707 207 61 146<br />
Method <strong>of</strong><br />
Determinatio<br />
n <strong>of</strong> <strong>WAB</strong><br />
Estimate from<br />
the Mill<br />
3.3 Data Collecti<strong>on</strong> from Vegetable Market:<br />
Vegetable market is another important place where <strong>WAB</strong> is generated. Around 200<br />
floriculture nurseries were registered in Floriculture Associati<strong>on</strong> <strong>of</strong> Nepal, an associati<strong>on</strong><br />
under Federati<strong>on</strong> <strong>of</strong> Nepalese Chambers <strong>of</strong> Commerce and Industry, within Kathmandu<br />
Valley. In MTM there are <strong>on</strong>ly 4 such nurseries operati<strong>on</strong>al. They are found to generate an<br />
average amount <strong>of</strong> waste around 60-70 kg/year. Since the waste generated is not so<br />
significant, these have not been included in the study. The data collected from the vegetable<br />
markets are presented below:<br />
Table 16: <strong>WAB</strong> from Vegetable Markets<br />
<strong>WAB</strong> T<strong>on</strong>s/Year<br />
Source<br />
Turnover<br />
T<strong>on</strong>s/year<br />
Type <strong>of</strong><br />
<strong>WAB</strong><br />
Generat<br />
i<strong>on</strong><br />
In house<br />
Use<br />
Surplus<br />
Gatthaghar<br />
Waste<br />
210<br />
18 - 18<br />
Market<br />
Vegetable<br />
Waste<br />
Kaushaltar Market 282<br />
27 - 27<br />
Vegetable<br />
Nagdesh<br />
Waste<br />
2,160<br />
108 - 108<br />
Wholesale Market<br />
Vegetable<br />
Total 2,652 153 - 153<br />
Method <strong>of</strong><br />
Determinatio<br />
n <strong>of</strong> <strong>WAB</strong><br />
Estimate from<br />
the shop<br />
keepers<br />
Combining all the wastes generated by the three sources, the <strong>WAB</strong> data from the survey is<br />
presented below:<br />
Table 17: Overall <strong>WAB</strong> from all the Sources<br />
<strong>WAB</strong> T<strong>on</strong>s/Year<br />
Source<br />
Type <strong>of</strong> <strong>WAB</strong><br />
In house<br />
Generati<strong>on</strong><br />
C<strong>on</strong>sumpti<strong>on</strong><br />
Surplus<br />
Farm Land<br />
Straw, Stalks, Waste<br />
Vegetable<br />
334 136 198<br />
Processing Facilities Rice Husk 207 61 146<br />
Vegetable Market Waste Vegetable 153 - 153<br />
Total for Samples 694 197 497<br />
15