Intensity-modulated radiotherapy by means of static tomotherapy: A ...
Intensity-modulated radiotherapy by means of static tomotherapy: A ...
Intensity-modulated radiotherapy by means of static tomotherapy: A ...

Create successful ePaper yourself
Turn your PDF publications into a flip-book with our unique Google optimized e-Paper software.
832 M. Oldham and S. Webb: <strong>Intensity</strong>-<strong>modulated</strong> <strong>radiotherapy</strong> 832<br />
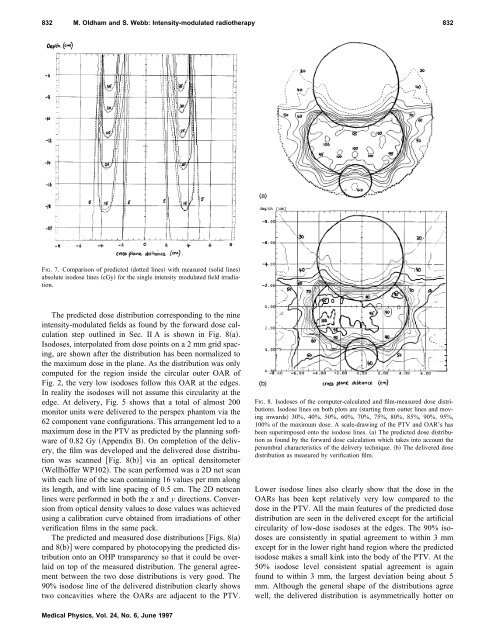
FIG. 7. Comparison <strong>of</strong> predicted dotted lines with measured solid lines<br />
absolute isodose lines cGy for the single intensity <strong>modulated</strong> field irradiation.<br />
The predicted dose distribution corresponding to the nine<br />
intensity-<strong>modulated</strong> fields as found <strong>by</strong> the forward dose calculation<br />
step outlined in Sec. II A is shown in Fig. 8a.<br />
Isodoses, interpolated from dose points on a2mmgrid spacing,<br />
are shown after the distribution has been normalized to<br />
the maximum dose in the plane. As the distribution was only<br />
computed for the region inside the circular outer OAR <strong>of</strong><br />
Fig. 2, the very low isodoses follow this OAR at the edges.<br />
In reality the isodoses will not assume this circularity at the<br />
edge. At delivery, Fig. 5 shows that a total <strong>of</strong> almost 200<br />
monitor units were delivered to the perspex phantom via the<br />
62 component vane configurations. This arrangement led to a<br />
maximum dose in the PTV as predicted <strong>by</strong> the planning s<strong>of</strong>tware<br />
<strong>of</strong> 0.82 Gy Appendix B. On completion <strong>of</strong> the delivery,<br />
the film was developed and the delivered dose distribution<br />
was scanned Fig. 8b via an optical densitometer<br />
Wellhöffer WP102. The scan performed was a 2D net scan<br />
with each line <strong>of</strong> the scan containing 16 values per mm along<br />
its length, and with line spacing <strong>of</strong> 0.5 cm. The 2D netscan<br />
lines were performed in both the x and y directions. Conversion<br />
from optical density values to dose values was achieved<br />
using a calibration curve obtained from irradiations <strong>of</strong> other<br />
verification films in the same pack.<br />
The predicted and measured dose distributions Figs. 8a<br />
and 8b were compared <strong>by</strong> photocopying the predicted distribution<br />
onto an OHP transparency so that it could be overlaid<br />
on top <strong>of</strong> the measured distribution. The general agreement<br />
between the two dose distributions is very good. The<br />
90% isodose line <strong>of</strong> the delivered distribution clearly shows<br />
two concavities where the OARs are adjacent to the PTV.<br />
FIG. 8. Isodoses <strong>of</strong> the computer-calculated and film-measured dose distributions.<br />
Isodose lines on both plots are starting from outter lines and moving<br />
inwards 30%, 40%, 50%, 60%, 70%, 75%, 80%, 85%, 90%, 95%,<br />
100% <strong>of</strong> the maximum dose. A scale-drawing <strong>of</strong> the PTV and OAR’s has<br />
been superimposed onto the isodose lines. a The predicted dose distribution<br />
as found <strong>by</strong> the forward dose calculation which takes into account the<br />
penumbral characteristics <strong>of</strong> the delivery technique. b The delivered dose<br />
distribution as measured <strong>by</strong> verification film.<br />
Lower isodose lines also clearly show that the dose in the<br />
OARs has been kept relatively very low compared to the<br />
dose in the PTV. All the main features <strong>of</strong> the predicted dose<br />
distribution are seen in the delivered except for the artificial<br />
circularity <strong>of</strong> low-dose isodoses at the edges. The 90% isodoses<br />
are consistently in spatial agreement to within 3 mm<br />
except for in the lower right hand region where the predicted<br />
isodose makes a small kink into the body <strong>of</strong> the PTV. At the<br />
50% isodose level consistent spatial agreement is again<br />
found to within 3 mm, the largest deviation being about 5<br />
mm. Although the general shape <strong>of</strong> the distributions agree<br />
well, the delivered distribution is asymmetrically hotter on<br />
Medical Physics, Vol. 24, No. 6, June 1997