Intensity-modulated radiotherapy by means of static tomotherapy: A ...
Intensity-modulated radiotherapy by means of static tomotherapy: A ...
Intensity-modulated radiotherapy by means of static tomotherapy: A ...

Create successful ePaper yourself
Turn your PDF publications into a flip-book with our unique Google optimized e-Paper software.
833 M. Oldham and S. Webb: <strong>Intensity</strong>-<strong>modulated</strong> <strong>radiotherapy</strong> 833<br />
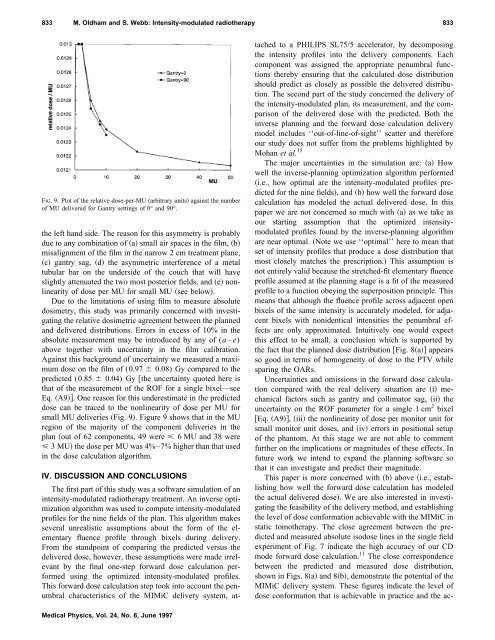
FIG. 9. Plot <strong>of</strong> the relative dose-per-MU arbitrary units against the number<br />
<strong>of</strong> MU delivered for Gantry settings <strong>of</strong> 0° and 90°.<br />
the left hand side. The reason for this asymmetry is probably<br />
due to any combination <strong>of</strong> a small air spaces in the film, b<br />
misalignment <strong>of</strong> the film in the narrow 2 cm treatment plane,<br />
c gantry sag, d the asymmetric interference <strong>of</strong> a metal<br />
tubular bar on the underside <strong>of</strong> the couch that will have<br />
slightly attenuated the two most posterior fields, and e nonlinearity<br />
<strong>of</strong> dose per MU for small MU see below.<br />
Due to the limitations <strong>of</strong> using film to measure absolute<br />
dosimetry, this study was primarily concerned with investigating<br />
the relative dosimetric agreement between the planned<br />
and delivered distributions. Errors in excess <strong>of</strong> 10% in the<br />
absolute measurement may be introduced <strong>by</strong> any <strong>of</strong> (a – e)<br />
above together with uncertainty in the film calibration.<br />
Against this background <strong>of</strong> uncertainty we measured a maximum<br />
dose on the film <strong>of</strong> (0.97 0.08) Gy compared to the<br />
predicted (0.85 0.04) Gy the uncertainty quoted here is<br />
that <strong>of</strong> the measurement <strong>of</strong> the ROF for a single bixel—see<br />
Eq. A9. One reason for this underestimate in the predicted<br />
dose can be traced to the nonlinearity <strong>of</strong> dose per MU for<br />
small MU deliveries Fig. 9. Figure 9 shows that in the MU<br />
region <strong>of</strong> the majority <strong>of</strong> the component deliveries in the<br />
plan out <strong>of</strong> 62 components, 49 were 6 MU and 38 were<br />
3MUthe dose per MU was 4%–7% higher than that used<br />
in the dose calculation algorithm.<br />
IV. DISCUSSION AND CONCLUSIONS<br />
The first part <strong>of</strong> this study was a s<strong>of</strong>tware simulation <strong>of</strong> an<br />
intensity-<strong>modulated</strong> <strong>radiotherapy</strong> treatment. An inverse optimization<br />
algorithm was used to compute intensity-<strong>modulated</strong><br />
pr<strong>of</strong>iles for the nine fields <strong>of</strong> the plan. This algorithm makes<br />
several unrealistic assumptions about the form <strong>of</strong> the elementary<br />
fluence pr<strong>of</strong>ile through bixels during delivery.<br />
From the standpoint <strong>of</strong> comparing the predicted versus the<br />
delivered dose, however, these assumptions were made irrelevant<br />
<strong>by</strong> the final one-step forward dose calculation performed<br />
using the optimized intensity-<strong>modulated</strong> pr<strong>of</strong>iles.<br />
This forward dose calculation step took into account the penumbral<br />
characteristics <strong>of</strong> the MIMiC delivery system, attached<br />
to a PHILIPS SL75/5 accelerator, <strong>by</strong> decomposing<br />
the intensity pr<strong>of</strong>iles into the delivery components. Each<br />
component was assigned the appropriate penumbral functions<br />
there<strong>by</strong> ensuring that the calculated dose distribution<br />
should predict as closely as possible the delivered distribution.<br />
The second part <strong>of</strong> the study concerned the delivery <strong>of</strong><br />
the intensity-<strong>modulated</strong> plan, its measurement, and the comparison<br />
<strong>of</strong> the delivered dose with the predicted. Both the<br />
inverse planning and the forward dose calculation delivery<br />
model includes ‘‘out-<strong>of</strong>-line-<strong>of</strong>-sight’’ scatter and therefore<br />
our study does not suffer from the problems highlighted <strong>by</strong><br />
Mohan et al. 15<br />
The major uncertainties in the simulation are: a How<br />
well the inverse-planning optimization algorithm performed<br />
i.e., how optimal are the intensity-<strong>modulated</strong> pr<strong>of</strong>iles predicted<br />
for the nine fields, and b how well the forward dose<br />
calculation has modeled the actual delivered dose. In this<br />
paper we are not concerned so much with a as we take as<br />
our starting assumption that the optimized intensity<strong>modulated</strong><br />
pr<strong>of</strong>iles found <strong>by</strong> the inverse-planning algorithm<br />
are near optimal. Note we use ‘‘optimal’’ here to mean that<br />
set <strong>of</strong> intensity pr<strong>of</strong>iles that produce a dose distribution that<br />
most closely matches the prescription. This assumption is<br />
not entirely valid because the stretched-fit elementary fluence<br />
pr<strong>of</strong>ile assumed at the planning stage is a fit <strong>of</strong> the measured<br />
pr<strong>of</strong>ile to a function obeying the superposition principle. This<br />
<strong>means</strong> that although the fluence pr<strong>of</strong>ile across adjacent open<br />
bixels <strong>of</strong> the same intensity is accurately modeled, for adjacent<br />
bixels with nonidentical intensities the penumbral effects<br />
are only approximated. Intuitively one would expect<br />
this effect to be small, a conclusion which is supported <strong>by</strong><br />
the fact that the planned dose distribution Fig. 8a appears<br />
so good in terms <strong>of</strong> homogeneity <strong>of</strong> dose to the PTV while<br />
sparing the OARs.<br />
Uncertainties and omissions in the forward dose calculation<br />
compared with the real delivery situation are i mechanical<br />
factors such as gantry and collimator sag, ii the<br />
uncertainty on the ROF parameter for a single 1 cm 2 bixel<br />
Eq. A9, iii the nonlinearity <strong>of</strong> dose per monitor unit for<br />
small monitor unit doses, and iv errors in positional setup<br />
<strong>of</strong> the phantom. At this stage we are not able to comment<br />
further on the implications or magnitudes <strong>of</strong> these effects. In<br />
future work we intend to expand the planning s<strong>of</strong>tware so<br />
that it can investigate and predict their magnitude.<br />
This paper is more concerned with b above i.e., establishing<br />
how well the forward dose calculation has modeled<br />
the actual delivered dose. We are also interested in investigating<br />
the feasibility <strong>of</strong> the delivery method, and establishing<br />
the level <strong>of</strong> dose conformation achievable with the MIMiC in<br />
<strong>static</strong> <strong>tomotherapy</strong>. The close agreement between the predicted<br />
and measured absolute isodose lines in the single field<br />
experiment <strong>of</strong> Fig. 7 indicate the high accuracy <strong>of</strong> our CD<br />
mode forward dose calculation. 11 The close correspondence<br />
between the predicted and measured dose distribution,<br />
shown in Figs. 8a and 8b, demonstrate the potential <strong>of</strong> the<br />
MIMiC delivery system. These figures indicate the level <strong>of</strong><br />
dose conformation that is achievable in practice and the ac-<br />
Medical Physics, Vol. 24, No. 6, June 1997