the deadliest, costliest, and most intense united states hurricanes ...
the deadliest, costliest, and most intense united states hurricanes ...
the deadliest, costliest, and most intense united states hurricanes ...

You also want an ePaper? Increase the reach of your titles
YUMPU automatically turns print PDFs into web optimized ePapers that Google loves.
(7) What was <strong>the</strong> largest number of <strong>hurricanes</strong> in <strong>the</strong> Atlantic Ocean at <strong>the</strong> same time?<br />
According to information on <strong>the</strong> current version of <strong>the</strong> master data file of Neumann et al. (1999).<br />
until September 25, 1998 <strong>the</strong>re had not been four <strong>hurricanes</strong> in <strong>the</strong> North Atlantic at <strong>the</strong> same<br />
time in over 100 years. Hurricanes Georges, Ivan, Jeanne <strong>and</strong> Karl persisted into September 2Th.<br />
1998 as <strong>hurricanes</strong>. One hundred five years earlier, on August 22, 1893 four <strong>hurricanes</strong><br />
co-existed, one of <strong>the</strong>m killing an estimated 1,000-2,000 people in Georgia-South Carolina. On<br />
September 11, 1961, three <strong>hurricanes</strong> <strong>and</strong> possibly a fourth occurred simultaneously. The onl)"<br />
o<strong>the</strong>r years after 1900 with three <strong>hurricanes</strong> on <strong>the</strong> map at <strong>the</strong> same time were 1950 <strong>and</strong> 1967" In<br />
1971 from September 10 to 12, <strong>the</strong>re were five tropical cyclones at <strong>the</strong> same time; however.<br />
while <strong>most</strong> of <strong>the</strong>se ultimately achieved hurricane intensity, <strong>the</strong>re were never more than two<br />
<strong>hurricanes</strong> at anyone time.<br />
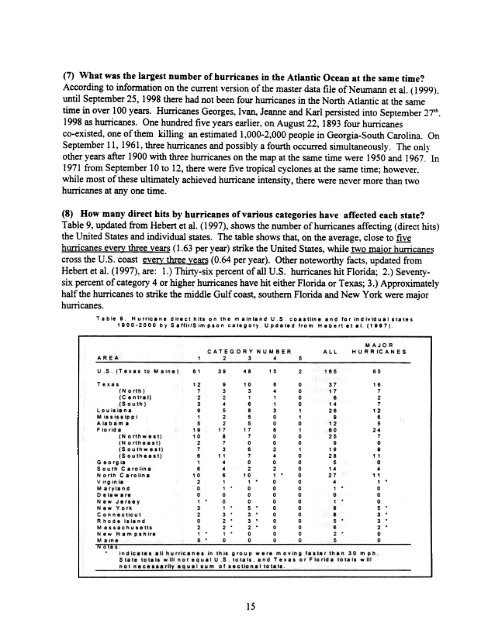
(8) How many direct hits by <strong>hurricanes</strong> of various categories have affected each state?<br />
Table 9, updated from Hebert et al. (1997), shows <strong>the</strong> number of <strong>hurricanes</strong> affecting (direct hits)<br />
<strong>the</strong> United States <strong>and</strong> individual <strong>states</strong>. The 'table shows that, on <strong>the</strong> average, close to ~<br />
<strong>hurricanes</strong> eveD: three years (1.63 per year) strike <strong>the</strong> United States, while two major <strong>hurricanes</strong><br />
cross <strong>the</strong> U.S. coast every three years (0.64 per year). O<strong>the</strong>r noteworthy facts, updated from<br />
Hebert et al. (1997), are: 1.) Thirty-six percent of all U.S. <strong>hurricanes</strong> hit Florida; 2.) Seventysix<br />
percent of category 4 or higher <strong>hurricanes</strong> have hit ei<strong>the</strong>r Florida or Texas; 3.) Approximately<br />
half <strong>the</strong> <strong>hurricanes</strong> to strike <strong>the</strong> middle Gulf coast, sou<strong>the</strong>rn Florida <strong>and</strong> New York were major<br />
<strong>hurricanes</strong>.<br />
Tab Ie 9. H u rric 8 n e dire c I hils 0 n Ih e m 8 in 18 n d U. S co 8 I Ilin e 8 n d fo r in d iv id U 8 I I la Ie S<br />
1900 -2 0 0 0 by Sa ffirlS im pion C a Ie gory. Up d 8 Ie d fro m H e b e rl e I a I. (1887)<br />
CATEGORY NUMBER<br />
AREA 1 2 3 4 5<br />
ALL<br />
MAJOR<br />
HURRICANES<br />
U.S(TexastoMaine) 61 39 46 15 2 165 65<br />
Texas 12 9 10 6 0 37 16<br />
(N 0 rth) 7 3 3 4 0 17 7<br />
(Central) 2 2 1 1 0 6 2<br />
(South) 3 4 6 1 0 14 7<br />
Louisiana 9 5 8 3 1 26 12<br />
Mississippi 1 2 5 0 1 9 6<br />
A la b a m a 5 2 5 0 0 1 2 5<br />
Florida 19 17 17 6 1 60 24<br />
(Northwest) 10 8 7 0 0 25 7<br />
(N or<strong>the</strong>ast) 2 7 0 0 0 9 0<br />
(Southwest) 7 3 6 2 1 19 8<br />
(Sou<strong>the</strong>ast) 6 11 7 4 0 28 11<br />
G eo rg ia 1 4 0 0 0 5 0<br />
Sou th C a ro lin a 6 4 2 2 0 1 4 4<br />
North C a ro lin a 1 0 6 1 0 1. 0 27 1 1<br />
Virginia 2 1 1. 0 0 4 1 .<br />
Maryl<strong>and</strong> 0 1. 0 0 0 1 .0<br />
De la w 8 re 0 0 0 0 0 0 0<br />
New J e r. e y<br />
New York<br />
1.<br />
3<br />
0<br />
l'<br />
0<br />
5. 0 0<br />
1 .0<br />
9 5 .<br />
Connecticut 2 3' 3. 0 0 8 3 .<br />
Rhode 1.l<strong>and</strong> 0 2. 3. 0 0 5 .3 .<br />
Massachusetts 2 2' 2. 0 0 6 2 .<br />
New Hampshire 1.1.0 0 0 2. 0<br />
M a in e 5. 0 0 0 0 5 0<br />
Note s<br />
.Indicate. all hurricane. in this group were moving faster than 30 m ph.<br />
State totals will not equal U S totals. <strong>and</strong> Texas or Florida totals will<br />
not nece.s8rlly equ81sum of section81 tot8ls.<br />
15