the deadliest, costliest, and most intense united states hurricanes ...
the deadliest, costliest, and most intense united states hurricanes ...
the deadliest, costliest, and most intense united states hurricanes ...

You also want an ePaper? Increase the reach of your titles
YUMPU automatically turns print PDFs into web optimized ePapers that Google loves.
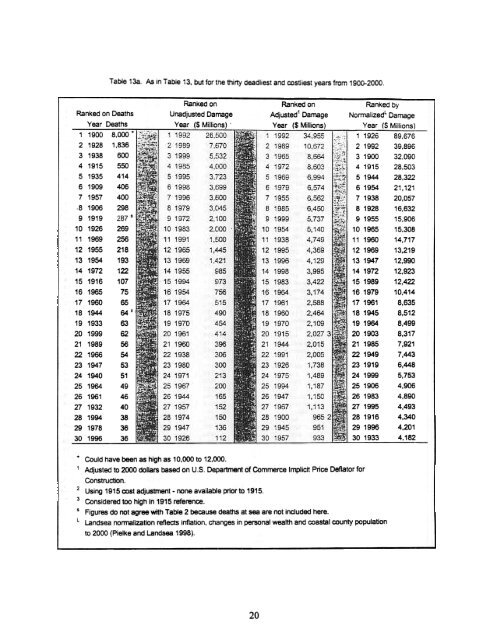
Table 13a. As in Table 13. but for <strong>the</strong> thii1y <strong>deadliest</strong> <strong>and</strong> <strong>costliest</strong> years from 1900-2000.<br />
Ranked on Deaths<br />
Year Deaths<br />
8.000 +<br />
1 1900<br />
2 1928<br />
3 1938<br />
4 1915<br />
5 1935<br />
6 1909<br />
7 1957<br />
.8 1906<br />
9 1919<br />
10 1926<br />
11 1969<br />
12 1955<br />
13 1954<br />
14 1972<br />
15 1916<br />
16 1965<br />
17 1960<br />
18 1944<br />
19 1933<br />
20 1999<br />
21 1989<br />
22 1966<br />
23 1947<br />
24 1940<br />
25 1964<br />
26 1961<br />
27 1932<br />
28 1994<br />
29 1978<br />
30 1996<br />
1.836<br />
600<br />
550<br />
414<br />
406<br />
400<br />
298<br />
269<br />
256<br />
218<br />
193<br />
122<br />
107<br />
75<br />
65<br />
64<br />
63<br />
62<br />
56<br />
54<br />
53<br />
51<br />
49<br />
46<br />
40<br />
38<br />
36<br />
36<br />
Ranked on<br />
Unadjusted Damage<br />
y~ ($ Millions) .<br />
Ranked on<br />
Adjusted1 Damage<br />
Year ($ Millio~<br />
Ranked by<br />
NormalizedL Damage<br />
Year ~<br />
11926<br />
21992<br />
3 1900<br />
41915<br />
5 1944<br />
6 1954<br />
71938<br />
81928<br />
91955<br />
10 1965<br />
11 1960<br />
12 1969<br />
13 1947<br />
141972<br />
151989<br />
161979<br />
171961<br />
18 1945<br />
19 1964<br />
201903<br />
21 1985<br />
221949<br />
231919<br />
24 1999<br />
251906<br />
261983<br />
271995<br />
281916<br />
29 1996<br />
301933<br />
Millions)<br />
89,676<br />
39,896<br />
32,090<br />
28,503<br />
28,322<br />
21,121<br />
20,057<br />
16,632<br />
15,906<br />
15,308<br />
14,717<br />
13,219<br />
12,990<br />
12,923<br />
12,422<br />
10,414<br />
8,635<br />
8,512<br />
8.499<br />
8,317<br />
7,921<br />
7,443<br />
6,448<br />
5,753<br />
4,906<br />
4,890<br />
4,493<br />
4,340<br />
4,201<br />
4,182<br />
+ Could have been as high as 10,000 to 12,~)Q.<br />
1 Adjusted to 2000 dollars based on U.S. De~)artment of Commerce Implicit Price Deflator for<br />
Construction.<br />
2 Using 1915 cost adjustment -none available prior to 1915.<br />
3 Considered too high in 1915 reference.<br />
S Figures do not agree with Table 2 because deaths at sea are not included here.<br />
L L<strong>and</strong>sea normalization reflects inflation, chclnges in personal wealth <strong>and</strong> coastal county population<br />
to 2000 (Pielke <strong>and</strong> L<strong>and</strong>sea 1998).<br />
20