Working papers published by IMAD ISSN: 1318-1920 ... - UMAR
Working papers published by IMAD ISSN: 1318-1920 ... - UMAR
Working papers published by IMAD ISSN: 1318-1920 ... - UMAR

Create successful ePaper yourself
Turn your PDF publications into a flip-book with our unique Google optimized e-Paper software.
An analysis of past and future GDP growth in Slovenia<br />
Base projection for the period 2002-2013<br />
<strong>Working</strong> paper 3/2004<br />
<strong>IMAD</strong><br />
39<br />
to use 0.5% of TFP growth in the future when using the CES-weighted human<br />
capital index, 0.3% when using the average wages human capital index, and 1.3%<br />
when using average years of schooling. Hence, I exclude the ‘outlier’ 1994, but<br />
do not assume a downward trend. We consider the impact of lower and higher<br />
TFP growth in the sensitivity analysis below.<br />
4.6. Base projection for output<br />
Using the projected inputs above we make a projection for GDP growth. For the<br />
period 2002-2013 we project an average annual growth in labour of 0.12%, in the<br />
capital-output ratio of 1.05% (i.e. we project capital to grow 1.05% faster than<br />
GDP annually), and in TFP of 0.5% when we use the CES-weighted human<br />
capital series, 0.3% when we use the average wages relative to the wages of the<br />
least-skilled human capital series, and 1.3% when we use average years of schooling<br />
for human capital. Furthermore, we expect the CES-weighted index of human<br />
capital to grow at 2.3% per year, the average wages relative to the wages of the<br />
least skilled to grow at 2.5% per year and the average years of schooling index to<br />
grow at 0.5% per year. We assume that the production function is Cobb-Douglas<br />
with constant returns to scale and the elasticity of output with respect to labour is<br />
0.7.<br />
GDP growth is<br />
projected to be<br />
somewhat lower,<br />
3.6%, mostly due<br />
to lower capital<br />
deepening than<br />
in the past<br />
Using the CES-weighted composite of low- and high-skilled labour for the human<br />
capital index, we then project an average annual GDP growth of 3.6% over the<br />
period 2002-2013. Using the average wage relative to the least skilled gives 3.5%<br />
and using average years of schooling gives 2.9%. In the last case, the drop in<br />
capital accumulation is only partly compensated for <strong>by</strong> the higher human capital<br />
growth.<br />
Hence, we project GDP growth to slow down somewhat compared to the period<br />
1993-2002. This is the result of lower projected capital deepening in the future<br />
than in the past, this drop dominates the projected increase in the growth rate of<br />
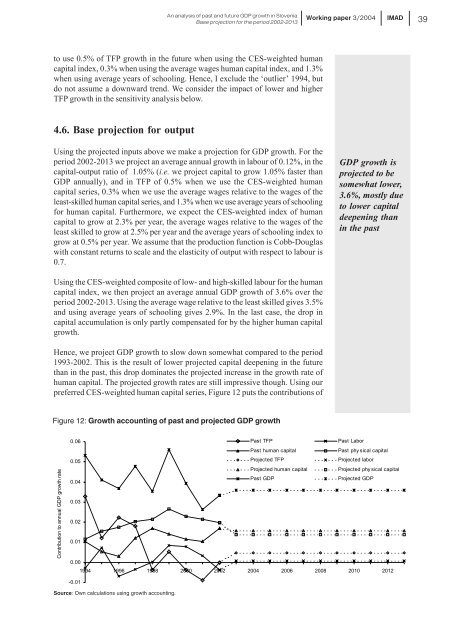
human capital. The projected growth rates are still impressive though. Using our<br />
preferred CES-weighted human capital series, Figure 12 puts the contributions of<br />
Figure 12: Growth accounting of past and projected GDP growth<br />
Contribution to annual GDP growth rate<br />
0.06<br />
Past TFP<br />
Past human capital<br />
Past Labor<br />
Past physical capital<br />
0.05<br />
Projected TFP<br />
Projected labor<br />
Projected human capital<br />
Projected phy sical capital<br />
0.04<br />
Past GDP<br />
Projected GDP<br />
0.03<br />
0.02<br />
0.01<br />
0.00<br />
1994 1996 1998 2000 2002 2004 2006 2008 2010 2012<br />
-0.01<br />
Source: Own calculations using growth accounting.