Working papers published by IMAD ISSN: 1318-1920 ... - UMAR
Working papers published by IMAD ISSN: 1318-1920 ... - UMAR
Working papers published by IMAD ISSN: 1318-1920 ... - UMAR
You also want an ePaper? Increase the reach of your titles
YUMPU automatically turns print PDFs into web optimized ePapers that Google loves.
An analysis of past and future GDP growth in Slovenia<br />
Sensitivity analysis of base projection<br />
<strong>Working</strong> paper 3/2004<br />
<strong>IMAD</strong><br />
43<br />
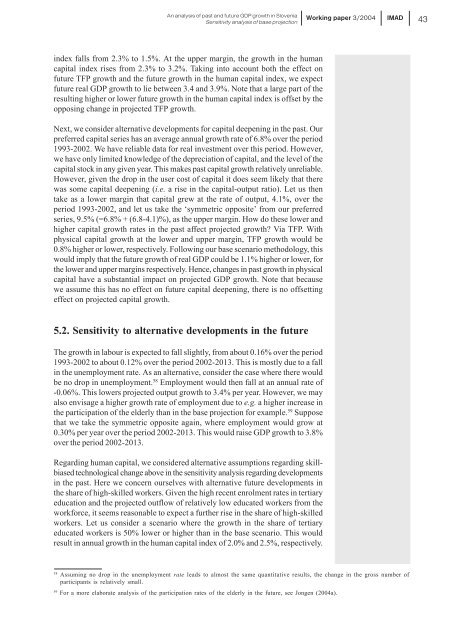
index falls from 2.3% to 1.5%. At the upper margin, the growth in the human<br />
capital index rises from 2.3% to 3.2%. Taking into account both the effect on<br />
future TFP growth and the future growth in the human capital index, we expect<br />
future real GDP growth to lie between 3.4 and 3.9%. Note that a large part of the<br />
resulting higher or lower future growth in the human capital index is offset <strong>by</strong> the<br />
opposing change in projected TFP growth.<br />
Next, we consider alternative developments for capital deepening in the past. Our<br />
preferred capital series has an average annual growth rate of 6.8% over the period<br />
1993-2002. We have reliable data for real investment over this period. However,<br />
we have only limited knowledge of the depreciation of capital, and the level of the<br />
capital stock in any given year. This makes past capital growth relatively unreliable.<br />
However, given the drop in the user cost of capital it does seem likely that there<br />
was some capital deepening (i.e. a rise in the capital-output ratio). Let us then<br />
take as a lower margin that capital grew at the rate of output, 4.1%, over the<br />
period 1993-2002, and let us take the ‘symmetric opposite’ from our preferred<br />
series, 9.5% (=6.8% + (6.8-4.1)%), as the upper margin. How do these lower and<br />
higher capital growth rates in the past affect projected growth? Via TFP. With<br />
physical capital growth at the lower and upper margin, TFP growth would be<br />
0.8% higher or lower, respectively. Following our base scenario methodology, this<br />
would imply that the future growth of real GDP could be 1.1% higher or lower, for<br />
the lower and upper margins respectively. Hence, changes in past growth in physical<br />
capital have a substantial impact on projected GDP growth. Note that because<br />
we assume this has no effect on future capital deepening, there is no offsetting<br />
effect on projected capital growth.<br />
5.2. Sensitivity to alternative developments in the future<br />
The growth in labour is expected to fall slightly, from about 0.16% over the period<br />
1993-2002 to about 0.12% over the period 2002-2013. This is mostly due to a fall<br />
in the unemployment rate. As an alternative, consider the case where there would<br />
be no drop in unemployment. 58 Employment would then fall at an annual rate of<br />
-0.06%. This lowers projected output growth to 3.4% per year. However, we may<br />
also envisage a higher growth rate of employment due to e.g. a higher increase in<br />
the participation of the elderly than in the base projection for example. 59 Suppose<br />
that we take the symmetric opposite again, where employment would grow at<br />
0.30% per year over the period 2002-2013. This would raise GDP growth to 3.8%<br />
over the period 2002-2013.<br />
Regarding human capital, we considered alternative assumptions regarding skillbiased<br />
technological change above in the sensitivity analysis regarding developments<br />
in the past. Here we concern ourselves with alternative future developments in<br />
the share of high-skilled workers. Given the high recent enrolment rates in tertiary<br />
education and the projected outflow of relatively low educated workers from the<br />
workforce, it seems reasonable to expect a further rise in the share of high-skilled<br />
workers. Let us consider a scenario where the growth in the share of tertiary<br />
educated workers is 50% lower or higher than in the base scenario. This would<br />
result in annual growth in the human capital index of 2.0% and 2.5%, respectively.<br />
58<br />
Assuming no drop in the unemployment rate leads to almost the same quantitative results, the change in the gross number of<br />
participants is relatively small.<br />
59<br />
For a more elaborate analysis of the participation rates of the elderly in the future, see Jongen (2004a).


