Innovation Network Denmark Performance Accounts 2011
Innovation Network Denmark Performance Accounts 2011
Innovation Network Denmark Performance Accounts 2011

Create successful ePaper yourself
Turn your PDF publications into a flip-book with our unique Google optimized e-Paper software.
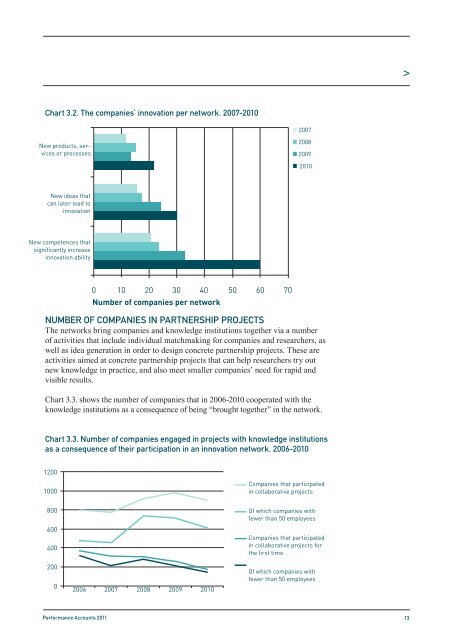
Chart 3.2. The companies’ innovation per network, 2007-2010<br />
2007<br />
New products, services<br />
or processes<br />
2008<br />
2009<br />
2010<br />
New ideas that<br />
can later lead to<br />
innovation<br />
New competences that<br />
significantly increase<br />
innovation ability<br />
0<br />
10<br />
20<br />
30<br />
40<br />
50<br />
60<br />
70<br />
Number of companies per network<br />
NUMBER OF COMPANIES IN PARTNERSHIP PROJECTS<br />
The networks bring companies and knowledge institutions together via a number<br />
of activities that include individual matchmaking for companies and researchers, as<br />
well as idea generation in order to design concrete partnership projects. These are<br />
activities aimed at concrete partnership projects that can help researchers try out<br />
new knowledge in practice, and also meet smaller companies’ need for rapid and<br />
visible results.<br />
Chart 3.3. shows the number of companies that in 2006-2010 cooperated with the<br />
knowledge institutions as a consequence of being “brought together” in the network.<br />
Chart 3.3. Number of companies engaged in projects with knowledge institutions<br />
as a consequence of their participation in an innovation network, 2006-2010<br />
1200<br />
1000<br />
Companies that participated<br />
in collaborative projects<br />
800<br />
600<br />
400<br />
200<br />
0<br />
2006 2007 2008 2009 2010<br />
Of which companies with<br />
fewer than 50 employees<br />
Companies that participated<br />
in collaborative projects for<br />
the first time<br />
Of which companies with<br />
fewer than 50 employees<br />
<strong>Performance</strong> <strong>Accounts</strong> <strong>2011</strong> 13