Innovation Network Denmark Performance Accounts 2011
Innovation Network Denmark Performance Accounts 2011
Innovation Network Denmark Performance Accounts 2011

Create successful ePaper yourself
Turn your PDF publications into a flip-book with our unique Google optimized e-Paper software.
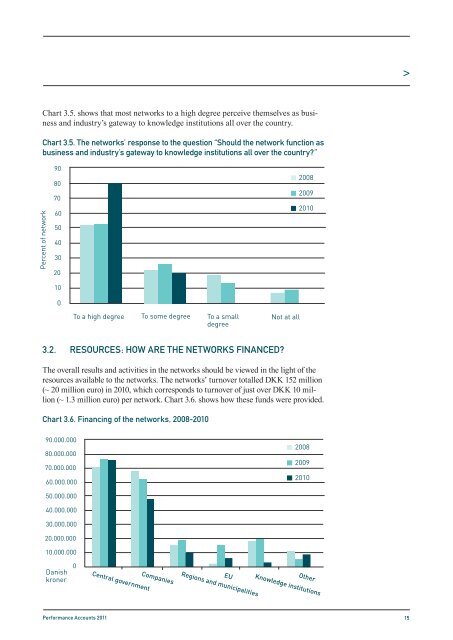
Chart 3.5. shows that most networks to a high degree perceive themselves as business<br />
and industry’s gateway to knowledge institutions all over the country.<br />
Chart 3.5. The networks’ response to the question “Should the network function as<br />
business and industry’s gateway to knowledge institutions all over the country?”<br />
Percent of network<br />
90<br />
80<br />
70<br />
60<br />
50<br />
40<br />
30<br />
20<br />
10<br />
0<br />
2008<br />
2009<br />
2010<br />
To a high degree To some degree To a small<br />
degree<br />
Not at all<br />
3.2. RESOURCES: HOW ARE THE NETWORKS FINANCED?<br />
The overall results and activities in the networks should be viewed in the light of the<br />
resources available to the networks. The networks’ turnover totalled DKK 152 million<br />
(~ 20 million euro) in 2010, which corresponds to turnover of just over DKK 10 million<br />
(~ 1.3 million euro) per network. Chart 3.6. shows how these funds were provided.<br />
Chart 3.6. Financing of the networks, 2008-2010<br />
90.000.000<br />
80.000.000<br />
70.000.000<br />
60.000.000<br />
2008<br />
2009<br />
2010<br />
50.000.000<br />
40.000.000<br />
30.000.000<br />
20.000.000<br />
Danish<br />
kroner<br />
0<br />
Central government<br />
Companies<br />
Other<br />
Knowledge institutions<br />
EU<br />
Regions and municipalities<br />
10.000.000<br />
<strong>Performance</strong> <strong>Accounts</strong> <strong>2011</strong> 15