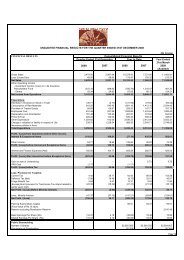
FINANCIAL HIGHLIGHTS - CONSOLIDATED <strong>Aditya</strong> <strong>Birla</strong> <strong>Nuvo</strong> Limited FINANCIAL HIGHLIGHTS PROFIT AND LOSS ACCOUNT 1 <strong>2012</strong>-13 2011-12 2010-11 2009-10 2008-09 USD Million 9 ` Crore ` Crore ` Crore ` Crore ` Crore Financial Services 1,166 6,295 6,392 6,131 5,725 4,679 Life Insurance 933 5,037 5,691 5,534 5,309 4,429 Other Financial Services 2 233 1,258 702 596 416 250 Fashion & Lifestyle 913 4,930 3,281 2,576 1,826 1,688 Branded Apparels & Accessories 704 3,802 2,243 1,811 1,251 1,116 Textiles (Linen Yarn & Fabric, Worsted Yarn & Wool Tops) 212 1,144 1,046 774 577 573 Inter-segment Elimination (3) (16) (8) (9) (2) (1) Telecom 3 1,049 5,662 4,933 3,918 3,331 2,892 IT-ITeS 457 2,466 2,082 1,692 1,530 1,777 Manufacturing 770 4,155 3,255 2,327 1,988 2,212 Agri (Fertilisers, Agro-Chemicals & Seeds) 542 2,924 2,107 1,244 1,022 1,250 Rayon (Viscose Filament Yarn, Caustic Soda and Allied Chemicals) 144 777 680 565 538 537 Insulators 84 454 468 518 428 425 Carbon Black 4 377 2,036 1,943 1,588 1,161 1,096 Inter-Segment elimination (10) (54) (46) (44) (37) (13) Revenue 4,720 25,490 21,840 18,188 15,523 14,331 EBITDA 767 4,142 3,259 2,685 1,686 867 Less : Depreciation and Amortisation 240 1,295 1,092 941 866 696 EBIT 527 2,847 2,167 1,745 820 172 Less : Finance Costs related to NBFC 84 456 202 112 80 84 Less : Other Finance Costs 160 865 636 438 582 637 Earnings before Tax and Exceptional Items 283 1,526 1,330 1,195 158 (549) Add : Exceptional Gain / (Loss) — — (104) (104) — — Less : Tax Expenses 63 342 216 183 114 81 Net Profit / (Loss) before Minority Interest 219 1,184 1,010 908 44 (630) Less : Minority Interest and Share in (Profit) / Loss of Associates 23 125 120 86 (111) (195) Net Profit / (Loss) 196 1,059 890 822 155 (436) BALANCE SHEET <strong>2012</strong>-13 2011-12 2010-11 2009-10 2008-09 USD Million 9 ` Crore ` Crore ` Crore ` Crore ` Crore Net Fixed Assets (Including Capital Advances) 1,977 10,677 9,354 8,840 6,942 6,623 Goodwill 894 4,825 3,177 3,042 2,939 3,471 Life Insurance (Policyholders’ Investments) 3,992 21,559 20,095 19,063 15,625 8,701 Life Insurance (Shareholders’ Investments) 254 1,371 1,015 697 504 467 Other Investments 574 3,097 797 1,039 827 1,914 Total Investments 4,820 26,026 21,907 20,799 16,956 11,082 NBFC Lending 1,481 8,000 3,425 1,850 900 600 Net Working Capital 5 278 1,503 2,432 961 1,248 1,926 Total Funds Utilised 9,450 51,031 40,295 35,493 28,985 23,703 Net Worth 1,738 9,384 7,517 6,678 5,475 5,742 Life Insurance Policyholders’ Fund 6 3,996 21,576 19,964 18,977 15,652 8,726 Total Debt 5 2,185 11,799 9,224 7,763 6,710 8,058 NBFC borrowings 1,278 6,903 2,973 1,538 722 778 Minority Interest 174 940 301 278 186 179 Deferred Tax Liabilities (Net) 79 428 317 259 241 220 Total Funds Employed 9,450 51,031 40,295 35,493 28,985 23,703 RATIOS AND STATISTICS Unit <strong>2012</strong>-13 2011-12 2010-11 2009-10 2008-09 Interest Cover (EBITDA / Finance Costs) x 3.1 3.9 4.9 2.5 1.2 Net Debt to Equity (Net Debt 7 / Net Worth) x 1.0 1.0 0.9 1.0 0.8 Net Debt to EBITDA (Net Debt 7 / EBITDA) x 2.3 2.3 2.3 3.1 5.5 ROACE (EBIT / Average Capital Employed 8 ) % 11.4 11.8 11.7 5.8 1.3 ROAE (Net Profit / Average Net Worth) % 12.5 12.5 13.5 2.8 (8.9) EPS (Weighted Average) ` 93.2 (USD 1.7) 78.4 77.6 15.4 (46.3) Book Value per Equity Share ` 781 (USD 14.5) 662 586 529 602 No. of Equity Shareholders Number 146,139 146,636 153,896 158,163 155,497 Closing Share Price as on 31 st March (NSE) ` 975.6 (USD 18.1) 945 814 906 445 Market Capitalisation (NSE) ` Crore 11,727 (USD 2.2 billion) 10,723 9,244 9,336 4,227 Note 1 : The Profit and Loss Account for 2010-11, 2011-12 and <strong>2012</strong>-13 has been prepared as per the revised Schedule VI of the Companies Act, 1956 Note 2 : Include Asset Management, NBFC, Private Equity, Broking, Wealth Management & General Insurance Advisory. Asset Management business has been proportionately consolidated at 50%, being a 50:50 Joint Venture till 9 th October <strong>2012</strong> and thereafter consolidated as subsidiary since <strong>Aditya</strong> <strong>Birla</strong> Financial Services holds 51% w.e.f. 10 th October <strong>2012</strong> Note 3 : Represents ABNL’s share. Being a joint venture, Idea has been consolidated at 31.78% from 10 th March 2007 upto 12 th August, 2008, at 27.02% upto 1 st March, 2010, and at ~25.3% thereafter, as per AS-27. Note 4 : Having received shareholders approval, ABNL is in the process of divesting the Carbon Black business, w.e.f. 1 st April <strong>2013</strong> Note 5 : Total Debt and Net Working Capital are excluding MTM gain of ` 22 Crore as on 31 st March <strong>2013</strong> and MTM loss of ` 104 Crore as on 31 st March <strong>2012</strong> w.r.t. fully hedged foreign currency working capital debt Note 6 : Including Fund for Future Appropriations Note 7 : Total Debt less Cash Surplus 10 Note 8 : Excluding Life Insurance Policyholders’ Fund Note 9 : 1 USD = ` 54 ; 10 Million = 1 Crore Note 10 : Cash Surplus including cash, bank balances and current investments 18 <strong>Annual</strong> Report <strong>2012</strong>-<strong>2013</strong>
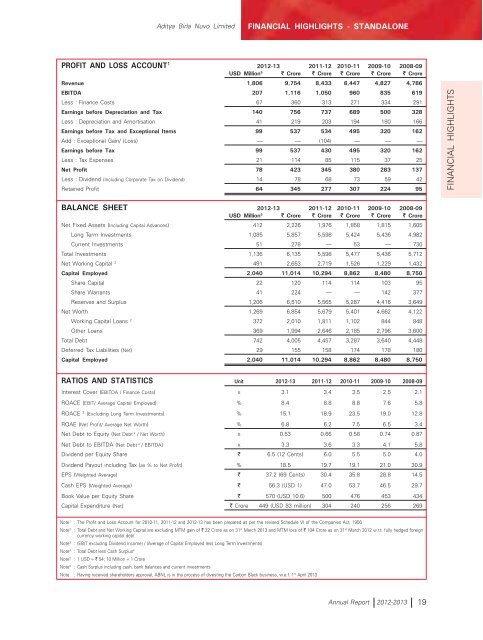
<strong>Aditya</strong> <strong>Birla</strong> <strong>Nuvo</strong> Limited FINANCIAL HIGHLIGHTS - STANDALONE PROFIT AND LOSS ACCOUNT 1 <strong>2012</strong>-13 2011-12 2010-11 2009-10 2008-09 USD Million 5 ` Crore ` Crore ` Crore ` Crore ` Crore Revenue 1,806 9,754 8,433 6,447 4,827 4,786 EBITDA 207 1,116 1,050 960 835 619 Less : Finance Costs 67 360 313 271 334 291 Earnings before Depreciation and Tax 140 756 737 689 500 328 Less : Depreciation and Amortisation 41 219 203 194 180 166 Earnings before Tax and Exceptional Items 99 537 534 495 320 162 Add : Exceptional Gain/ (Loss) — — (104) — — — Earnings before Tax 99 537 430 495 320 162 Less : Tax Expenses 21 114 85 115 37 25 Net Profit 78 423 345 380 283 137 Less : Dividend (Including Corporate Tax on Dividend) 14 78 68 73 59 42 Retained Profit 64 345 277 307 224 95 FINANCIAL HIGHLIGHTS BALANCE SHEET <strong>2012</strong>-13 2011-12 2010-11 2009-10 2008-09 USD Million 5 ` Crore ` Crore ` Crore ` Crore ` Crore Net Fixed Assets (Including Capital Advances) 412 2,226 1,976 1,858 1,815 1,605 Long Term Investments 1,085 5,857 5,598 5,424 5,436 4,982 Current Investments 51 278 — 53 — 730 Total Investments 1,136 6,135 5,598 5,477 5,436 5,712 Net Working Capital 2 491 2,653 2,719 1,526 1,229 1,432 Capital Employed 2,040 11,014 10,294 8,862 8,480 8,750 Share Capital 22 120 114 114 103 95 Share Warrants 41 224 — — 142 377 Reserves and Surplus 1,206 6,510 5,565 5,287 4,416 3,649 Net Worth 1,269 6,854 5,679 5,401 4,662 4,122 Working Capital Loans 2 372 2,010 1,811 1,102 844 848 Other Loans 369 1,994 2,646 2,185 2,796 3,600 Total Debt 742 4,005 4,457 3,287 3,640 4,448 Deferred Tax Liabilities (Net) 29 155 158 174 178 180 Capital Employed 2,040 11,014 10,294 8,862 8,480 8,750 RATIOS AND STATISTICS Unit <strong>2012</strong>-13 2011-12 2010-11 2009-10 2008-09 Interest Cover (EBITDA / Finance Costs) x 3.1 3.4 3.5 2.5 2.1 ROACE (EBIT/ Average Capital Employed) % 8.4 8.8 8.8 7.6 5.8 ROACE 3 (Excluding Long Term Investments) % 15.1 18.9 23.5 19.0 12.8 ROAE (Net Profit/ Average Net Worth) % 6.8 6.2 7.5 6.5 3.4 Net Debt to Equity (Net Debt 4 / Net Worth) x 0.53 0.66 0.58 0.74 0.87 Net Debt to EBITDA (Net Debt 4 / EBITDA) x 3.3 3.6 3.3 4.1 5.8 Dividend per Equity Share ` 6.5 (12 Cents) 6.0 5.5 5.0 4.0 Dividend Payout including Tax (as % to Net Profit) % 18.5 19.7 19.1 21.0 30.9 EPS (Weighted Average) ` 37.2 (69 Cents) 30.4 35.8 28.8 14.5 Cash EPS (Weighted Average) ` 56.3 (USD 1) 47.0 53.7 46.5 29.7 Book Value per Equity Share ` 570 (USD 10.6) 500 476 453 434 Capital Expenditure (Net) ` Crore 449 (USD 83 million) 304 240 256 269 Note 1 : The Profit and Loss Account for 2010-11, 2011-12 and <strong>2012</strong>-13 has been prepared as per the revised Schedule VI of the Companies Act, 1956 Note 2 : Total Debt and Net Working Capital are excluding MTM gain of ` 22 Crore as on 31 st March <strong>2013</strong> and MTM loss of ` 104 Crore as on 31 st March <strong>2012</strong> w.r.t. fully hedged foreign currency working capital debt Note 3 : (EBIT excluding Dividend Income) / (Average of Capital Employed less Long Term Investments) Note 4 : Total Debt less Cash Surplus 6 Note 5 : 1 USD = ` 54; 10 Million = 1 Crore Note 6 : Cash Surplus including cash, bank balances and current investments Note : Having received shareholders approval, ABNL is in the process of divesting the Carbon Black business, w.e.f. 1 st April <strong>2013</strong> <strong>Annual</strong> Report <strong>2012</strong>-<strong>2013</strong> 19