What Is Evidence-Based Medicine?1 - Surgical Planning Laboratory
What Is Evidence-Based Medicine?1 - Surgical Planning Laboratory
What Is Evidence-Based Medicine?1 - Surgical Planning Laboratory

Create successful ePaper yourself
Turn your PDF publications into a flip-book with our unique Google optimized e-Paper software.
Special Report<br />
Radiology Alliance for Health Services Research<br />
<strong>What</strong> <strong>Is</strong> <strong>Evidence</strong>-<strong>Based</strong> <strong>Medicine</strong>? 1<br />
Critical Thinking Skills Symposium<br />
Kelly H. Zou, PhD, Julia R. Fielding, MD, Silvia Ondategui-Parra, MD, MPH, MSc<br />
Rationale and Objectives. In this review article, we present the definition and useful concepts of evidence-based medicine<br />
(EBM). The principles of EBM are provided and major steps of practicing EBM are described.<br />
Materials and Methods. We emphasize the importance of the Cochrane Collaboration (see http://www.cochrane.org),<br />
which initiated the research and practice in this area. Because it can be difficult to systematically access and review individual<br />
research studies, it is often useful to focus on a critical overview of clinical trials by conducting a meta-analysis.<br />
Results. Useful literature and resources related to meta-analysis are provided.<br />
Conclusion. Statistical methods for evaluating radiologic diagnostic performances derived from meta-analysis are summarized,<br />
with a special focus on summary outcomes measures.<br />
Key Words. <strong>Evidence</strong>-based medicine; evidence-based radiology; meta-analysis; sensitivity; specificity; receiver operating<br />
characteristic curve.<br />
© AUR, 2004<br />
Acad Radiol 2004; 11:127–133<br />
1<br />
From the Radiology Management Group, Department of Radiology,<br />
Brigham and Women’s Hospital, Harvard Medical School, Boston, MA; Department<br />
of Health Care Policy, Harvard Medical School, Boston, MA; Department<br />
of Radiology, University of North Carolina at Chapel Hill, Chapel<br />
Hill, NC; Department of Health Policy and Management, Harvard School of<br />
Publish Health, Boston, MA. Received July 14, 2003; revision requested<br />
August 28; received in revised form September 8; accepted September 9.<br />
Partially supported by a research grant R03HS13234-01 from the National<br />
Institutes of Health. Address correspondence to Kelly H. Zou e-mail:<br />
zou@bwh.harvard.edu<br />
© AUR, 2004<br />
doi:10.1016/S1076-6332(03)00650-0<br />
<strong>Evidence</strong>-based medicine (EBM), also called evidencebased<br />
health care, was developed because of the awareness<br />
of the limitations of traditional determinants. The<br />
principles of EBM offer a useful solution to clinical problems<br />
to acquire valid and current information for clinical<br />
and policy decisions (1). EBM is defined as the process<br />
of systematically finding, critically appraising, and using<br />
contemporary research published in the medical literature<br />
as a basis for making decisions regarding individual patient<br />
care and health care policy. It is also a habit that is<br />
recommended to all practicing radiologists so that they<br />
use the best logical thinking techniques to derive treatment<br />
plans (2–4).<br />
A comprehensive review of EBM applied to radiology<br />
was recently published (1). However, so far these developments<br />
have received limited applications in radiology.<br />
The link between EBM and evidence-based radiology is<br />
aimed at integration of evaluative sciences and technology<br />
assessment into clinical practice (2).<br />
There are several approaches for EBM. It is recognized<br />
that one of the best methods for reviewing a field of information<br />
and to systematically access individual research<br />
studies is to conduct a meta-analysis. It is important for<br />
radiologists to realize that EBM offers solutions that can<br />
be applied at many levels of professional involvement. A<br />
unique feature of EBM is that it can be used readily by<br />
practicing radiologists working at the effectiveness level:<br />
performance in their own departments under ordinary<br />
clinical practice (1).<br />
127
ZOU ET AL Academic Radiology, Vol 11, No 2, February 2004<br />
Table 1<br />
Trends in <strong>Evidence</strong>-based <strong>Medicine</strong> From 1995 to 2002 Using<br />
MEDLINE Search with Subject Heading Words “<strong>Evidence</strong>based<br />
<strong>Medicine</strong>”<br />
Year Number of Publications Relative Frequency (%)<br />
1995 20 0.2<br />
1996 215 2.0<br />
1997 678 6.2<br />
1998 1075 9.8<br />
1999 1611 14.7<br />
2000 1889 17.2<br />
2001 2573 23.4<br />
2002 2919 26.6<br />
Total 10980 100.0<br />
First, in this article, we will focus on how to integrate<br />
EBM techniques into daily clinical practice. We will then<br />
review the basic steps required to perform a meta-analysis.<br />
Finally, a summary and concluding remarks are provided.<br />
EVIDENCE-BASED MEDICINE IN RADIOLOGY<br />
RADIOLOGY<br />
The number of articles published on EBM has seen a<br />
dramatic increase. The trends of conducting EBM between<br />
1995 and 2002, based on a MEDLINE search using<br />
the subject heading “evidence-based medicine,” are<br />
provided (Table 1). The major work of evidence-based<br />
medicine is to draw conclusions from results collected<br />
from literature, and alternatively, from narrative reviews<br />
and data pooled from independent studies—often clinical<br />
trials. The main methodologic approach is to perform a<br />
systematic statistical analysis to extract, compare, and<br />
combine the reported results from these studies to derive<br />
quantifiable outcomes (2). Explicit criteria are necessary<br />
to render an objective assessment of the study’s value.<br />
Such criteria include inclusion and exclusion subject criteria<br />
with assessment of bias, reasonableness of the clinical<br />
intervention, appropriateness of the statistical evaluation,<br />
and overall credibility when compared with a practitioner’s<br />
medical knowledge.<br />
There are four major steps to the practice of evidencebased<br />
medicine (4), as described in the following sections.<br />
Step 1. Formulate the Clinical Question<br />
This first step is the single most important one, and<br />
requires careful thought. It is best to formulate the clinical<br />
question in the form of an exposure and patient outcome.<br />
For example, “Does the use of contrast-enhanced<br />
computed tomography (CT) scan of the chest (exposure/<br />
possible harm) as a primary test for dyspnea in a 68-yearold<br />
woman with a normal chest radiograph reduce her<br />
risk of dying of pulmonary embolus?” The more detail<br />
incorporated into the clinical question, the more specific<br />
is the relevant literature review. In this example, the patient’s<br />
age, symptoms, and chest radiograph findings are<br />
included. Thus, in the literature review, one could disregard<br />
articles describing young patients, asymptomatic patients,<br />
and those patients with abnormal chest radiographs.<br />
Step 2. Find the <strong>Evidence</strong><br />
Conventionally, radiologists may search for useful evidence<br />
for clinical practice without applying appropriate or<br />
scientific methods. For example, one may discuss a case<br />
with a colleague or mentor, retrieve individual research<br />
articles, and review quality and relevance-filtered publications.<br />
The limitation in such practice is that the expert<br />
opinion can be out of date and even incorrect, particularly<br />
when confronted with a very rare disease or unusual manifestation<br />
of a more common ailment. Alternatively, many<br />
radiologists keep paper or electronic files of individual<br />
research articles, usually divided by organ system. These<br />
files, when critically reviewed and kept up to date, may<br />
help understand the current status of imaging a particular<br />
disease. Unfortunately, the clinical information from these<br />
personal files typically does not represent that using a<br />
population-based approach, which is relevant to the individual<br />
case to be diagnosed or treated. Therefore, sophisticated<br />
and robust methods are needed for systematically<br />
combining evidence.<br />
Computer databases such as MEDLINE and PUBMED<br />
have shown to be invaluable in these cases. The Cochrane<br />
Collaboration, based in the United Kingdom, recommends<br />
performing meta-analyses rather than the ad hoc combination<br />
of information present in the literature. Founded by<br />
Dr. Archie Cochrane in 1972, the goal of the group is to<br />
determine, in well-designed studies, which therapies are<br />
effective and then to use health care resources to provide<br />
these therapies to the population in an equitable and presumably<br />
cost-effective manner. In this group, reviewers,<br />
consumers, translators, and hand searchers submit work to<br />
an editorial team assigned to a particular health care<br />
project. Using predetermined eligibility criteria, studies<br />
are selected to provide the largest dataset possible. A<br />
meta-analysis is then performed on these studies. The<br />
results of the analysis form the basis of a report that<br />
128
Academic Radiology, Vol 11, No 2, February 2004<br />
WHAT IS EVIDENCE-BASED MEDICINE?<br />
makes recommendations on the usefulness of a particular<br />
test or therapy. In the United States, for example, technology<br />
assessment is reviewed by the Quality Interagency<br />
Coordination Task Force based in Washington, DC.<br />
Step 3. Critical Appraisal<br />
When reviewing an individual research study or conducting<br />
a meta-analysis, one must assess the work for<br />
relevance and methodologic rigor. This is a critical step<br />
for developing epidemiologic tools to assess the validity<br />
and the quality of the evidence found in the literature.<br />
There are different levels of evidence and grades for<br />
recommendation. The medical literature may be classified<br />
according to its quality level ranging from type (1), the<br />
highest quality, to type (5) the lowest. Type (1) evidence<br />
is from a systematic review, which includes at least one<br />
randomized controlled trial and a summary of all included<br />
studies. Examples of these studies include those published<br />
by the Cochrane Collaboration, the National Health Service<br />
Centre for Reviews and Dissemination, and the<br />
Agency for Healthcare Research and Quality. The evidence<br />
from such a review requires careful appraisal; if<br />
well done, such evidence is powerful. Type (2) evidence<br />
is from a properly designed randomized controlled trial of<br />
appropriate size. Type (3) evidence is from a well-designed<br />
intervention study without randomization. <strong>Evidence</strong><br />
in this category will only be included if no type (1)<br />
or (2) evidence is available. A common research design is<br />
the before-and-after study. Type (4) evidence is supplied<br />
from a well-designed nonexperimental study (eg, cohort,<br />
case-control or cross-sectional study and any study using<br />
purely qualitative methods). Studies in this category will<br />
only be included if no type (1), (2), or (3) evidence is<br />
available. Economic analyses (cost-effectiveness studies)<br />
are also classified as type (4) evidence. Type (5) evidence<br />
consists of opinions of respected authorities based on<br />
clinical evidence, descriptive studies, or reports of expert<br />
consensus committees.<br />
Step 4. Develop Solutions<br />
Research results, even those that are carefully reviewed,<br />
should not be used to determine patient treatment.<br />
Instead, the practitioner should combine the information<br />
gathered from literature reviews with his or her<br />
clinical expertise and available external evidence. In most<br />
cases, this evidence will consist of the patient’s history<br />
and physical examination and laboratory test results. In<br />
this way, the best diagnostic and therapeutic options<br />
available can be matched to a specific patient’s condition.<br />
Table 2<br />
Trends in Meta-analysis <strong>Medicine</strong> From 1995 to 2002 Using<br />
MEDLINE Search with Subject Heading Words “Metaanalysis”<br />
Year Number of Publications Relative Frequency (%)<br />
1995 274 8.6<br />
1996 261 8.2<br />
1997 331 10.4<br />
1998 350 11.0<br />
1999 397 12.5<br />
2000 491 15.4<br />
2001 544 17.1<br />
2002 534 16.8<br />
Total 3182 100.0<br />
META-ANALYSIS<br />
Definition and Trends<br />
Meta-analysis is a quantitative method for combining<br />
the results of independent studies, usually drawn from<br />
published literature, and for synthesizing summaries and<br />
conclusions, which may be used to evaluate therapeutic<br />
effectiveness and plan new studies (5,6). It has increasingly<br />
been used for evaluating and comparing diagnostic<br />
performances, for example, of imaging modalities (7–9),<br />
biopsy techniques (10), and vascular interventions (11).<br />
The number of papers published on meta-analyses has<br />
increased steadily in the past 10 years. See the trends of<br />
conducting meta-analysis between 1995 and 2002 in the<br />
results of a MEDLINE search using the subject heading<br />
of “meta-analysis” (Table 2).<br />
Advantages<br />
For the purpose of critically evaluating a clinical hypothesis<br />
based on published clinical trials, meta-analysis<br />
is an efficient tool for summarizing the results in the literature<br />
numerically. Meta-analysis allows for an objective<br />
appraisal of the evidence, which may lead to resolution of<br />
uncertainty and disagreement. It can reduce the probability<br />
of false-negative results and thus prevent undue delays<br />
in the introduction of effective treatments into clinical<br />
practice. A priori hypotheses regarding treatment effects<br />
in subgroups of patients may be tested. It may also explore<br />
and sometimes explain the heterogeneity between<br />
study results. Finally, the analysis may help guide the<br />
design of future research. Specifically, the sample size<br />
needed in future studies may be calculated more accurately.<br />
Classic textbooks on meta-analysis have been writ-<br />
129
ZOU ET AL Academic Radiology, Vol 11, No 2, February 2004<br />
ten by several authors (12–15). In the late 1990s, the British<br />
Journal of <strong>Medicine</strong> published a series of articles on<br />
this topic (17–23).<br />
Tools<br />
There are several epidemiologic and statistical tools<br />
required to scientifically synthesize and assemble literature<br />
data in a meta-analysis: (1) a carefully considered<br />
and detailed protocol should be written before beginning<br />
the project; (2) an a priori definition of eligibility criteria<br />
should be included, with a comprehensive search for such<br />
studies as a central part of the work; (3) the results<br />
should be graphed on a common scale to allow a visual<br />
examination of the heterogeneity between studies; (4) an<br />
appropriate statistical method should be chosen for combining<br />
data; and (5) a thorough “sensitivity” analysis<br />
should be performed to assess the robustness of combined<br />
estimates using different assumptions and inclusion criteria.<br />
In Table 3, we illustrate these five tools on a wellconducted<br />
meta-analysis by Oei et al. (9). The authors<br />
evaluated the diagnostic performance of magnetic resonance<br />
imaging of the menisci and cruciate ligaments of<br />
the knee and assessed the effect of study design characteristics<br />
and magnetic field strength on diagnostic performance.<br />
<strong>Based</strong> on 29 of the 120 retrieved articles, the authors<br />
found that the performance of magnetic resonance<br />
imaging differed according to lesion types and was influenced<br />
by study designs. In addition, higher magnetic field<br />
strength moderately improved diagnostic accuracy, with a<br />
significant effect on the identification of anterior cruciate<br />
ligament tears.<br />
Sources of Biases<br />
We have already defined the classification system of<br />
quality of the literature under EBM. However, there are<br />
several biases that may lead to an erroneous conclusion.<br />
The most common types of bias include: (1) publication<br />
bias: significant results are more likely to get published;<br />
(2) language and citation bias: among published studies,<br />
those with significant results are more likely to get published<br />
in English, to be cited, and to be published repeatedly;<br />
(3) database bias: in less developed countries, studies<br />
with significant results may be more likely to get published<br />
in a journal indexed in a literature database; and<br />
(4) inclusion bias: criteria for including studies in a metaanalysis<br />
may be influenced by knowledge of the results of<br />
the set of potential studies. To minimize these possible<br />
biases, one must search the world literature thoroughly<br />
Table 3<br />
A Step-by-Step Illustration of a Toolbox for Meta-analysis on<br />
a Published Study on MRI of the Menisci and Cruciate<br />
Ligaments<br />
Step Tools Methods Applied<br />
1. Detailed<br />
protocol<br />
2. Eligibility<br />
criteria<br />
3. Graphical<br />
display<br />
4. Statistical<br />
methods<br />
5. Sensitivity<br />
analysis<br />
Search engine: MEDLINE<br />
Date: January 1991–December 2000<br />
Purpose: Diagnostic performance of MRI<br />
of knee lesions<br />
Terms: Magnetic resonance imaging, knee,<br />
meniscus, cruciate ligament, arthroscopy<br />
Extractors: Two independent readers, with<br />
third reader assessing discrepancies<br />
Study characteristics: Publication year,<br />
country, setting, patient characteristics,<br />
aspects of study design, verification<br />
bias, characteristics of MRI<br />
Likelihood for inclusion: Yes, possible, no<br />
(1) Inclusion criteria:<br />
Language: English<br />
Diagnosis: MRI of lesions of medial or<br />
lateral meniscus, ACL, or PCL<br />
Sample size: At least 30 subjects<br />
Gold standard: Arthroscopy<br />
Measurement: Magnetic field strength<br />
Threshold: Positive criteria for MRI<br />
Outcome data: Absolute numbers of TP,<br />
FN, TN, and FP<br />
(2) Exclusion:<br />
Patient population: Consists of infants or<br />
adolescents<br />
Study objective: MRI for postoperative<br />
evaluation<br />
Study design: Case-control<br />
Ligaments: Only the medial and lateral<br />
meniscus combined<br />
Measurement: Various magnetic field<br />
strengths<br />
Outcome data: Only the diagnostic value<br />
of specific features and indirect signs of<br />
knee lesions at MRI<br />
Funnel plot of log odds ratio<br />
Summary ROC plot<br />
Pooled weighted analysis of sensitivity and<br />
specificity<br />
Random effects model<br />
Summary ROC analysis per lesion and for<br />
all lesions<br />
Delete-one Jackknife method<br />
Note.—MRI magnetic resonance imaging; ACL anterior<br />
cruciate ligament; PCL posterior cruciate ligament; TP true<br />
positive; FN false negative; TN true negative; FP false<br />
positive; ROC receiver operating characteristic.<br />
130
Academic Radiology, Vol 11, No 2, February 2004<br />
WHAT IS EVIDENCE-BASED MEDICINE?<br />
Table 4<br />
Summary Measures Commonly Used for Conducting Meta-analysis in Radiology<br />
Summary Measure<br />
Sensitivity (true positive rate)<br />
Specificity (true negative rate)<br />
Positive predictive value<br />
Negative predictive value<br />
Likelihood ratio<br />
Odds ratio<br />
Relative risk<br />
Receiver operating curve<br />
Definition<br />
The proportion of subjects with disease who have a positive test.<br />
The proportion of subjects without disease who have a negative test<br />
The proportion of test positive subjects who truly have disease.<br />
The proportion of test negative subjects who truly do not have disease.<br />
The probability that a subject with disease would have a particular test result divided by the probability<br />
that a subject without the disease would have that result.<br />
The probability of the disease occurring divided by the probability that it doesn’t occur.<br />
The probability of the disease in the risk group divided by the probability of the disease in the control<br />
group.<br />
A plot of (1-specificity, sensitivity) at all possible decision threshold.<br />
Table 5<br />
Absolute Diagnostic Rates in the Computed Tomography of Metastasis in Lung Cancer(35)<br />
Study<br />
Sample<br />
Size (n)<br />
True<br />
Positive<br />
(TP)<br />
False<br />
Negative<br />
(FN)<br />
False<br />
Positive<br />
(FP)<br />
True<br />
Negative<br />
(TN) Sensitivity Specificity<br />
1 50 11 7 6 26 0.611 0.813<br />
2* 35 2 5 15 13 0.287 0.464<br />
3 51 15 2 2 32 0.833 0.941<br />
4 22 4 1 4 13 0.800 0.765<br />
5 50 22 21 1 6 0.512 0.857<br />
6 42 17 1 9 15 0.944 0.625<br />
7 94 29 10 1 54 0.744 0.982<br />
8 41 8 6 4 23 0.571 0.852<br />
9 50 7 6 12 25 0.538 0.676<br />
10 49 20 1 10 18 0.952 0.643<br />
11 48 19 1 9 19 0.950 0.679<br />
12 97 18 6 8 65 0.750 0.890<br />
13 41 18 1 9 13 0.947 0.591<br />
14 75 17 3 6 49 0.850 0.891<br />
Note—*Data from Study 2 were not included in the analysis because of inhomogeneity. Sensitivity TP/(TP FN) and Specificity <br />
TN/(FP TN)<br />
and use eligibility criteria stringently (24–26). A tutorial<br />
article addressing the statistical methods for meta-analysis<br />
including reduction of bias was published in 1999 by<br />
Normand (27).<br />
Diagnostic Imaging: A Receiver Operating<br />
Characteristic Curve<br />
There are several summary outcomes derived from<br />
meta-analyses useful for imaging research (28–30). These<br />
include sensitivity, specificity, predictive value, likelihood<br />
ratio, odds ratio, relative risk, and summary receiver operating<br />
characteristic (SROC) curve (Table 4). SROC methods<br />
are designed to show the accuracy of a specific test at<br />
predetermined sensitivity and specificity levels. There are<br />
several methods to derive such a curve. Kardaun and<br />
Kardaun (31) used a bivariate normal maximum-likelihood<br />
method. Littenberg et al. (32) employed a logit difference–sum<br />
regression model, in which the logit-transformed<br />
true-positive fraction and false-positive fraction<br />
have a linear relationship; logit(p) ln{p/(1p)}. Recently,<br />
the logit difference–sum method was validated via<br />
statistical simulations (33). A more complicated approach<br />
using a latent-scale logistic regression analysis model was<br />
developed by Rutter and Gatsonis (34).<br />
As a simple example for derivation of the summary<br />
ROC curve, Table 5 provides the subset data from 14<br />
131
ZOU ET AL Academic Radiology, Vol 11, No 2, February 2004<br />
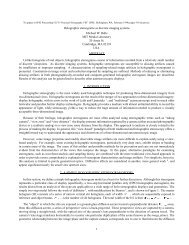
Figure 1. Summary Receiver Operating Curves of Diagnostic Rates in the Computed<br />
Tomography of Metastasis in Lung Cancer by Two Estimation Methods.<br />
studies found by Inouye and Sox (35) and analyzed by<br />
both Kardaun and Kardaun and by Litternberg et al. The<br />
intention of this meta-analysis was to evaluate the diagnostic<br />
accuracy of CT scans for detecting metastases in<br />
patients with non–small-cell lung cancer. Summary ROC<br />
curves were constructed based on 13 studies. Data from<br />
study 2 were omitted because the sensitivity and specificity<br />
were less than 0.5, which was not homogeneous with<br />
remaining data. The two analysis models yielded the summary<br />
ROC curves, both displayed in Figure 1. The logit<br />
difference–sum model gave the estimated regression equation<br />
logit(TP) 3.26 1.12 logit(FP), whereas the<br />
bivariate normal maximum-likelihood model gave the<br />
estimated equation logit(TP) 3.71 1.64 logit(FP).<br />
The large area under the ROC curves showed that CT<br />
was accurate in diagnosis of metastatic lung nodes.<br />
SUMMARY<br />
In this brief review article, we present the concepts<br />
and steps for EBM and meta-analysis, with a focus on<br />
evidence-based radiology. Careful scientific methodology<br />
is called for to minimize biases and to systematically synthesize<br />
medical literature. The application of EBM principles<br />
to diagnostic imaging can facilitate the interpretation<br />
of imaging studies and create a well-conducted radiologic<br />
evaluation.<br />
REFERENCES<br />
1. The <strong>Evidence</strong>-<strong>Based</strong> Radiology Working Group. <strong>Evidence</strong>-based<br />
radiology: a new approach to the practice of radiology. Radiology<br />
2001; 220:566–575.<br />
2. Eisenberg JM. Then lesions for evidence-based technology assessment.<br />
JAMA 1999; 282:1865–1869.<br />
3. Hoffrage U, Lindsey S, Hertwig R, et al. <strong>Medicine</strong> communicating statistical<br />
information. Science 2000; 290:2261–2262.<br />
4. Sackett DL, Straus SE, Richardson S, et al: <strong>Evidence</strong>-based medicinehow<br />
to practice and teach EBM. 2nd ed. Edinburgh, Scotland:<br />
Churchill Livingstone, 2000.<br />
5. Jaeschke R, Guyatt G, Sackett DLfor the <strong>Evidence</strong>-<strong>Based</strong> <strong>Medicine</strong><br />
Working Group. Users’ guides to the medical literature, III. How to<br />
use an article about a diagnostic test. B. <strong>What</strong> are the results and<br />
will they help me in caring for my patients? JAMA 1994; 271:703–<br />
707.<br />
6. Langlotz CP, Sonnad SS. Meta-analysis of diagnostic procedures: A<br />
brief overview. Academic Radiology 1998; 5(Suppl. 2):S269–S273.<br />
132
Academic Radiology, Vol 11, No 2, February 2004<br />
WHAT IS EVIDENCE-BASED MEDICINE?<br />
7. Visser K, Hunink MG. Peripheral arterial disease: A gadolinium-enhanced<br />
MR angiography versus color-guided duplex US—meta-analysis.<br />
Radiology 2000; 216:67–77.<br />
8. Kinkel K, Lu Y, Both M, et al. Detection of hepatic metastases from<br />
cancers of the gastrointestinal tract by using noninvasive imaging<br />
methods (US, CT, MR imaging, PET): A meta-analysis. Radiology<br />
2002; 224:748–756.<br />
9. Oei EHG, Nikken JJ, Verstignen ACM, et al. MR imaging of the menisci<br />
and cruciate ligaments: A systematic review. Radiology 2003;<br />
226:837–848.<br />
10. Samson DJ, Flamm CR, Pisano ED, et al. Should FDG PET be used to<br />
decide whether a patient with an abnormal mammogram or breast<br />
finding at physical examination should undergo biopsy? Acad Radiol<br />
2002; 9:773–783.<br />
11. MacEneaney PM, Malone DE. Applying “evidence-based medicine”<br />
theory to interventional radiology. II. A spreadsheet for swift assessment<br />
of procedural benefit and harm. Clin Radiol 2000; 55:938–945.<br />
12. Hedges LV, Olkin I. Statistical methods for meta-analysis. New York:<br />
Academic Press, 1985.<br />
13. Eddy DM, Hasselblad V, Shachter R. Meta-analysis by the confidence<br />
profile method. The statistical synthesis of evidence. Boston: Academic<br />
Press, 1992.<br />
14. Petitti DB. Meta-analysis, decision analysis, and cost-effectiveness<br />
analysis. Methods for quantitative synthesis in medicine. New York:<br />
Oxford University Press, 1994.<br />
15. Cooper H, Hedges LV. The handbook of research synthesis. New<br />
York: Russell Sage Foundation, 1994.<br />
16. Rosenberg W, Donald A. <strong>Evidence</strong> based medicine: An approach to<br />
clinical problem-solving. BMJ 1995; 310:1122–1126.<br />
17. Sackett DL, Rosenberg WM, Gray JA, et al. <strong>Evidence</strong> based medicine:<br />
<strong>What</strong> it is and what it isn’t. BMJ 1996; 312:71–72.<br />
18. Egger M, Smith DG. Meta-analysis: Potential and promise. BMJ 1997;<br />
315:1371–1374.<br />
19. Egger M, Davey Smith G. Meta-analysis: Principles and procedure.<br />
BMJ 1997; 315:1533–1537.<br />
20. Smith DG, Egger M, Phillips AN. Meta-analysis: Beyond the grand<br />
mean. BMJ 1997; 315:1610–1614.<br />
21. Egger M, Smith DG. Meta-analysis: Bias in location and selection<br />
studies. BMJ 1998; 316:61–66.<br />
22. Egger M, Schneider M, Smith DG. Spurious precision? Meta-analysis<br />
of observational studies. BMJ 1998; 316:140–144.<br />
23. Smith DG, Egger M. Meta-analysis: Unresolved issues and future developments.<br />
BMJ 1998; 316:221–225.<br />
24. Lyengar S, Greenhouse J. Selection models and the file-drawer problem.<br />
Stat Sci 1988; 3:109–135.<br />
25. Dear KB, Begg CB. An approach for assessing publication bias prior<br />
to performing a meta-analysis. Stat Sci 1992; 7:237–245.<br />
26. Hedges LV. Modeling publication selection effects in meta-analysis.<br />
Stat Sci 1992; 7:246–255.<br />
27. Normand S-LT. Meta-analysis: Formulating, evaluating, combining,<br />
and reporting. Stat Med 1999; 18:321–359.<br />
28. Rockette HE, Gur D, Campbell WL, et al. Use of meta-analysis in the<br />
evaluation of imaging systems. Acad Radiol 1994; 1:63–69.<br />
29. Walter SD, Jadad AR. Meta-analysis of screening data: A survey of<br />
the literature. Stat Med 1999; 18:3409–3424.<br />
30. Irwig L, Macaskill P, Glasziou P, et al. Meta-analytic methods for diagnostic<br />
test accuracy. J Clin Epidemiol 1995; 48:119–130.<br />
31. Kardaun JWPF, Kardaun OJWF. Comparative diagnostic performance<br />
of three radiological procedures for detection of lumbar disk herniation.<br />
Meth Info Med 1990; 29:12–22.<br />
32. Moses LE, Shapiro D, Littenberg B. Combining independent studies of<br />
a diagnostic test into a summary ROC curve: Data-analytic approaches<br />
and some additional considerations. Stat Med 1993;<br />
12:1293–1316.<br />
33. Mitchell MD. Validation of the summary ROC for diagnostic test metaanalysis:<br />
A monte-carlo simulation. Acad Radiol 2003; 10:25–31.<br />
34. Rutter CM, Gatsonis CA. Regression methods for meta-analysis of<br />
diagnostic test data. Acad Radiol 1995; 2(Suppl. 1):S48–S56.<br />
35. Inouye SK, Sox HC. Standard and computed tomography in the evaluation<br />
of neoplasms of the chest. Ann Int Med 1986; 105:906–924.<br />
133