Read the full report (PDF27.8 MB) - CO2CRC
Read the full report (PDF27.8 MB) - CO2CRC
Read the full report (PDF27.8 MB) - CO2CRC

Create successful ePaper yourself
Turn your PDF publications into a flip-book with our unique Google optimized e-Paper software.
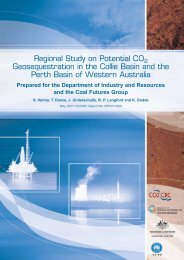
Site Specific Studies for Geological Storage of Carbon Dioxide<br />
Sou<strong>the</strong>ast Queensland CO 2 Storage<br />
Sites – Geological Basins Desk-Top Study<br />
Includes a detailed assessment of <strong>the</strong> Bowen Basin<br />
in particular <strong>the</strong> Wunger Ridge<br />
Jacques Sayers, Cameron Marsh, Adam Scott, Yildiray Cinar, John Bradshaw,<br />
Allison Hennig, Aleks Kalinowski, Annette Patchett, Ric Daniel,<br />
Stuart Barclay, and Jim Underschultz<br />
December 2006, <strong>CO2CRC</strong> Report No: RPT05-0225<br />
Australian School of Petroleum
Site Specific Studies for Geological Storage of Carbon Dioxide.<br />
Sou<strong>the</strong>ast Queensland CO 2 Storage<br />
Sites – Geological Basins Desk-Top Study.<br />
Includes a detailed assessment of <strong>the</strong> Bowen Basin<br />
in particular <strong>the</strong> Wunger Ridge<br />
Jacques Sayers, Cameron Marsh, Adam Scott, Yildiray Cinar, John Bradshaw,<br />
Allison Hennig, Aleks Kalinowski, Annette Patchett, Ric Daniel, Stuart<br />
Barclay, and Jim Underschultz<br />
December 2006, <strong>CO2CRC</strong> Report No: RPT05-0225
Cooperative Research Centre for Greenhouse Gas Technologies (<strong>CO2CRC</strong>)<br />
GPO Box 463<br />
Level 3, 24 Marcus Clarke Street<br />
Canberra ACT 2601<br />
Phone: +61 2 6200 3366<br />
Fax: +61 2 6230 0448<br />
Email: pjcook@co2crc.com.au<br />
Web: www.co2crc.com.au<br />
Reference: Sayers, J., Marsh, C., Scott, A., Cinar, Y., Bradshaw, J., Hennig, A., Kalinowski, A., Patchett, A.,<br />
Daniel, R., Barclay, S., & Underschultz, J., 2005. Site Specific Studies for Geological Storage of Carbon<br />
Dioxide. Sou<strong>the</strong>ast Queensland CO 2 Storage Sites-Geological Basins Desk-Top Study. Includes a detailed<br />
assessment of <strong>the</strong> Bowen Basin in particular <strong>the</strong> Wunger Ridge . <strong>CO2CRC</strong> Publication No. RPT05-0225.<br />
© <strong>CO2CRC</strong> 2006<br />
Unless o<strong>the</strong>rwise specified, <strong>the</strong> Cooperative Research Centre for Greenhouse Gas Technologies (<strong>CO2CRC</strong>)<br />
Retains copyright over this publication through its commercial arm, Innovative Carbon Technologies Pty Ltd.<br />
You must not reproduce, distribute, publish, copy, transfer or commercially exploit any information contained<br />
in this publication that would be an infringement of any copyright, patent, trademark, design or o<strong>the</strong>r<br />
intellectual property right.<br />
Requests and inquires concerning copyright should be addressed to <strong>the</strong> Communications Manager, <strong>CO2CRC</strong>,<br />
GPO BOX 463, CANBERRA, ACT, 2601. Telephone: +61 2 6200 336.
Table of Contents<br />
Preface............................................................................................................................................... vii<br />
Executive Summary ........................................................................................................................... 1<br />
1. Introduction .................................................................................................................................... 3<br />
2. Geographical and Industrial Setting ............................................................................................ 5<br />
2.1. Setting ...................................................................................................................................... 5<br />
2.2. CO 2 Properties.......................................................................................................................... 8<br />
2.3. Chapter References .................................................................................................................. 9<br />
3. Geological Setting, Regional Stratigraphy and Structure ........................................................ 10<br />
3.1. Eastern Queensland Basins .................................................................................................... 10<br />
3.1.1. North Queensland Coastal Cenozoic Basins (includes Oil Shale Basins – Duaringa,<br />
Yaamba, Casuarina, Hillsborough, Narrows and Nagoorin)................................................. 10<br />
3.1.2. North Queensland Coastal Mesozoic Basin (Laura Basin). ......................................... 10<br />
3.1.3. Styx Basin...................................................................................................................... 11<br />
3.1.4. Clarence-Moreton Basin............................................................................................... 11<br />
3.1.5. Nambour Basin. ............................................................................................................ 12<br />
3.1.6. Maryborough Basin. ..................................................................................................... 14<br />
3.1.7. Callide Basin................................................................................................................. 14<br />
3.1.8. Esk and Abercorn Troughs. .......................................................................................... 14<br />
3.1.9.Tarong Basin.................................................................................................................. 14<br />
3.1.10.Calen Basin.................................................................................................................. 14<br />
3.1.11. Lakefield Basin............................................................................................................ 15<br />
3.2. Great Artesian, Surat, Eromanga, Carpentaria and Mulgildie Basins................................... 15<br />
3.3. Older/Deeper Basins .............................................................................................................. 16<br />
3.3.1 Cooper Basin ................................................................................................................. 16<br />
3.3.2 Devonian to Carboniferous Basins (Warburton, Adavale, Drummond, Hodgkinson,<br />
Gilberton, Bundock, Clarke River, and Burdekin Basins). ..................................................... 16<br />
3.4. Galilee Basin .......................................................................................................................... 17<br />
3.5. Bowen Basin .......................................................................................................................... 17<br />
3.6. Wunger Ridge – Bowen Basin............................................................................................... 24<br />
3.7. Chapter References ................................................................................................................ 25<br />
4. Geological and Geophysical Datasets ......................................................................................... 28<br />
4.1. Geological data....................................................................................................................... 28<br />
4.2. Geophysical data .................................................................................................................... 30<br />
5. Bowen Basin Summary Reviews................................................................................................. 31<br />
5.1. Introduction............................................................................................................................ 31<br />
5.2. Denison Through Study Area.................................................................................................31<br />
5.3. East Bowen Basin Study Area – Burunga Anticline / Dulucca Area..................................... 32<br />
5.4. Sou<strong>the</strong>ast Bowen Basin Study Area....................................................................................... 33<br />
5.4.1. Well Data and Result .................................................................................................... 33<br />
5.4.2. Seismic Data ................................................................................................................. 35<br />
5.5. Roma Shelf Study Area.......................................................................................................... 36<br />
5.6. Nor<strong>the</strong>ast Bowen Basin Study Area....................................................................................... 37<br />
i
5.7. Chapter References ................................................................................................................ 37<br />
6. Southwest Bowen Basin Study Area - Wunger Ridge Flank................................................... 39<br />
6.1. Seismic Interpretation ............................................................................................................ 39<br />
6.1.1. Previous Work and Structural Framework................................................................... 39<br />
6.1.2. Time Interpretation Seismic horizons .......................................................................... 39<br />
Basement (BASE) ........................................................................................................................................... 41<br />
Bandanna Formation (BAND)........................................................................................................................ 41<br />
Rewan Formation (REWA)............................................................................................................................. 41<br />
Showgrounds Sandstone (SHOW) .................................................................................................................. 41<br />
Snake Creek Mudstone (SNAK)...................................................................................................................... 41<br />
Moolayember Formation (MOOL)................................................................................................................. 41<br />
Walloon Coal Measures (WALL) ................................................................................................................... 41<br />
Orallo Formation (ORAL).............................................................................................................................. 42<br />
Faults ............................................................................................................................................................. 42<br />
6.1.3. Depth Conversion .........................................................................................................42<br />
6.1.4. Mapping ........................................................................................................................ 43<br />
Potential Storage Site Options Meandarra updip-to-Weribone East .................................... 43<br />
Kinkabilla updip-to-Taylor downdip .............................................................................................................. 44<br />
Teelba Creek updip-to-Nardoo downdip ........................................................................................................ 44<br />
Maps and Basin Fill ...................................................................................................................................... 51<br />
6.2. Geological Overview ............................................................................................................. 51<br />
6.2.1. Basement ....................................................................................................................... 51<br />
6.2.2. Permian Sediments........................................................................................................51<br />
The Back Creek Group ................................................................................................................................... 51<br />
6.2.3. Triassic Sediments ........................................................................................................ 52<br />
Rewan Formation........................................................................................................................................... 52<br />
Showgrounds Sandstone/Snake Creek Mudstone ........................................................................................... 53<br />
Clematis Sandstone ........................................................................................................................................ 53<br />
Moolayember Formation................................................................................................................................ 54<br />
6.3. Showgrounds Sandstone-Snake Creek Mudstone reservoir/seal pairs.................................. 54<br />
6.3.1. Previous Work............................................................................................................... 54<br />
6.3.2. Cathodoluminescence Petrography .............................................................................. 55<br />
6.3.3. Thin Section Petrography ............................................................................................. 56<br />
6.3.4. X-ray Diffractometry.....................................................................................................57<br />
6.3.5. Analysis of Results ........................................................................................................ 57<br />
6.3.6. Showgrounds Sandstone Sedimentology....................................................................... 57<br />
6.3.7. Core Interpretation ....................................................................................................... 59<br />
6.3.8. Electrical Well-Log to Core Comparison ..................................................................... 66<br />
6.3.9. Petrophysics.................................................................................................................. 69<br />
6.3.10. Showgrounds- Snake Creek Mudstone Stratigraphy................................................... 70<br />
6.3.11. Reservoir Prediction and distribution: Vertical and lateral Facies Extent and<br />
Connectivity. ........................................................................................................................... 72<br />
6.3.12. Showgrounds Sandstone Reservoir Prediction and Distribution................................ 75<br />
6.4. Containment Potential: Implications for CO 2 Storage ........................................................... 77<br />
6.4.1. Seal Distribution and Continuity .................................................................................. 77<br />
6.4.2. Seal Capacity ................................................................................................................ 80<br />
6.5. Geomechanical Modelling ..................................................................................................... 81<br />
6.6. Hydrodynamic Modelling ...................................................................................................... 81<br />
6.6.1. Introduction................................................................................................................... 81<br />
6.6.2. Pre-production Flow System......................................................................................... 82<br />
6.6.3. Post-production Flow System ....................................................................................... 82<br />
6.6.4. Hydraulic Communication............................................................................................ 85<br />
Rewan Formation- Showgrounds Sandstone.................................................................................................. 87<br />
ii
Showgrounds Sandstone- Precipice Formation............................................................................................. 87<br />
6.6.5. Water Salinity................................................................................................................ 87<br />
6.6.6. Analysis of Results ........................................................................................................ 87<br />
6.6.7. Fur<strong>the</strong>r Work ................................................................................................................ 88<br />
6.7. Reservoir Model and Simulation ........................................................................................... 88<br />
6.7.1. Introduction................................................................................................................... 88<br />
6.7.2. Model Description......................................................................................................... 88<br />
6.7.3. Simulation Scenarios.....................................................................................................89<br />
6.7.4. Simulation Results......................................................................................................... 93<br />
6.8. Conclusions from reservoir simulation of coarse scale models ............................................. 94<br />
Suitability of Reservoir, Seal and Trap........................................................................................................... 94<br />
Aquifer Connectivity....................................................................................................................................... 95<br />
Injection Characteristics ................................................................................................................................ 95<br />
Impact of Modelled Site on Existing Natural Resources ................................................................................ 96<br />
6.9. Chapter References ................................................................................................................ 96<br />
7. Summary and Implications - Sou<strong>the</strong>ast Queensland CO 2 Storage Sites................................. 99<br />
Summary ....................................................................................................................................... 99<br />
Implications................................................................................................................................. 100<br />
8. Recommendations- Sou<strong>the</strong>ast Queensland CO 2 Storage Sites.............................................. 101<br />
Transportable Knowledge Base .................................................................................................. 101<br />
Non-transportable Knowledge Base ........................................................................................... 101<br />
O<strong>the</strong>r............................................................................................................................................ 102<br />
9. Acknowledgements..................................................................................................................... 103<br />
10. Appendices ................................................................................................................................ 104<br />
List of authors................................................................................................................................. 105<br />
List of contributors......................................................................................................................... 106<br />
List of reviewers ............................................................................................................................. 106<br />
iii
Tables<br />
Table 2.1. Physical properties of Carbon Dioxide.............................................................................. 8<br />
Table 3.1. Summary of <strong>the</strong> key risk factors associated with geological storage of CO 2 in Queensland<br />
sedimentary basins. ........................................................................................................................... 13<br />
Table 5.1. Preliminary assessment of wells of <strong>the</strong> sou<strong>the</strong>ast Bowen Basin area. ............................. 34<br />
Table 6.1. Interpreted and phantomed horizons ............................................................................... 40<br />
Table 6.2. Listing of petrography samples numbers.. ....................................................................... 55<br />
Table 6.3. Porosity and net reservoir thickness of <strong>the</strong> Showgrounds Sandstone. ............................. 70<br />
Table 6.4. Sample numbers and location of where seal samples were taken from. .......................... 80<br />
Table 6.5. Reservoir properties......................................................................................................... 91<br />
Table 6.6. Variation with pressure of CO 2 properties....................................................................... 91<br />
Table 6.7. Relative permeability and capillary pressure .................................................................. 91<br />
Table 6.8. Summary of simulation study.. ......................................................................................... 92<br />
iv
Figures<br />
Figure 2.1. Location map showing key study areas and features in sou<strong>the</strong>ast Queensland ............... 5<br />
Figure 2.2. Close-up images of study areas in <strong>the</strong> Bowen Basin........................................................ 7<br />
Figure 2.3. Phase diagram for carbon dioxide. .................................................................................. 9<br />
Figure 3.1. Location of selected sedimentary basins in sou<strong>the</strong>ast Queensland................................ 11<br />
Figure 3.2. Stratigraphy of <strong>the</strong> Great Artesian Basin....................................................................... 15<br />
Figure 3. 3. Basic elements of <strong>the</strong> Galilee Basin. ............................................................................. 18<br />
Figure 3.4. Sequence Stratigraphy of <strong>the</strong> Bowen and Surat basins. ................................................. 20<br />
Figure 3.5. Structure of <strong>the</strong> Denison Trough.. .................................................................................. 21<br />
Figure 3.6. Key structural elements of <strong>the</strong> Taroom Trough.............................................................. 22<br />
Figure 3.7.Schematic geological cross-section through <strong>the</strong> Roma Shelf area.................................. 23<br />
Figure 3.8. Geological cross-sections through <strong>the</strong> nor<strong>the</strong>rn Bowen Basin. ..................................... 24<br />
Figure 5.1. Generic geological cross-section of <strong>the</strong> sou<strong>the</strong>ast Bowen Basin area........................... 34<br />
Figure 5.2. Seismic lines used in <strong>the</strong> sou<strong>the</strong>ast Bowen Basin study area. ........................................ 35<br />
Figure 5.3. Hydrocarbon fields on <strong>the</strong> Roma Shelf – Bowen Basin.................................................. 36<br />
Figure 6.1. Seismic sections across <strong>the</strong> Wunger Ridge study area. .................................................. 45<br />
Figure 6.2. Seismic sections across <strong>the</strong> Wunger Ridge study area. .................................................. 45<br />
Figure 6.3. Depth map of basement across <strong>the</strong> Wunger Ridge study area ....................................... 46<br />
Figure 6.4. TWT–depth pairs for 41 wells located in <strong>the</strong> Wunger Ridge study area........................ 47<br />
Figure 6.5. Depth conversion flowchart. .......................................................................................... 47<br />
Figure 6.6. Potential storage site options in Wunger Ridge study area.. ......................................... 48<br />
Figure 6.7. BANDANNA-to-SHOWGROUNDS isopach map........................................................... 49<br />
Figure 6.8. Seismic sections across <strong>the</strong> Wunger Ridge study area. East–west seismic-line C81-6, tie<br />
to Kinkabilla-1 & Inglestone-1.......................................................................................................... 49<br />
Figure 6.9. Seismic sections across <strong>the</strong> Wunger Ridge study area. East–west seismic line C81-3,<br />
north of Kinkabilla-1......................................................................................................................... 50<br />
Figure 6.10. Seismic section across <strong>the</strong> Wunger Ridge study area. (a) East-west seismic line HIS-<br />
1008, Wunger Ridge flank. (b) East-west seismic line HIS-1001, downdip Wunger Ridge flank..... 50<br />
Figure 6.11. Diagrammatic cross-section of <strong>the</strong> Wunger Ridge study area. .................................... 52<br />
Figure 6.12. Petrographical classification of samples.. ................................................................... 56<br />
Figure 6.13. Cross plots of permeability and porosity vs depth for Wunger Ridge samples ............ 58<br />
Figure 6.14. Cross plot of porosity vs permeability for Wunger Ridge facies type samples............. 59<br />
Figure 6.15.East–west/south–north cross-section of <strong>the</strong> Wunger Ridge flank.................................. 60<br />
Figure 6.16. Photograph of Waggamba-1 core. Shows lowstand – late lowstand systems tract...... 62<br />
Figure 6.17. Photograph of Namarah-2 core. Shows Showgrounds Sandstone, an interpreted fluvial<br />
section. .............................................................................................................................................. 62<br />
Figure 6.18. Photograph of Namarah-2 core. Shows Showgrounds Sandstone, shoreface to delta<br />
distributary sandstone....................................................................................................................... 62<br />
v
Figure 6.19. Photograph of Harbour-1 core. Shows approximately one metre of high permeability<br />
Showgrounds Sandstone cross bedded sandstone reservoir. ............................................................ 62<br />
Figure 6.20. Photograph of Sirrah-5 core. Depicts a low permeability baffle which is related to a<br />
conglomeratic facies in Sirrah-5....................................................................................................... 64<br />
Figure 6.21. Photograph of Sirrah-5 core. Depicts <strong>the</strong> Showgrounds Sandstone. Cross bedding<br />
indicates traction current processes typical of a fluvial system........................................................ 64<br />
Figure 6.22. Photograph of Glen Fosslyn-1 core. At <strong>the</strong> top of <strong>the</strong> figure is a wave modified ripple<br />
in <strong>the</strong> Showgrounds Sandstone indicating shallow semi open–open water .................................... 64<br />
Figure 6.23. Photograph of Namarah-2 core. Shows <strong>the</strong> vertical (v )and horizontal (h) bioturbation<br />
within <strong>the</strong> Showgrounds Sandstone at Namarah-2 ........................................................................... 64<br />
Figure 6.24. Core description of <strong>the</strong> Sirrah-5 core .......................................................................... 65<br />
Figure 6.25. Core plug analysis for Sirrah-5....................................................................................66<br />
Figure 6.26. Well log display from Glen Fosslyn-1 covering <strong>the</strong> Showgrounds Sandstone ............. 67<br />
Figure 6.27. Idealised braided fluvial facies and grainsize profile .................................................. 68<br />
Figure 6.28. Photograph of Harbour-1 core. Depicts <strong>the</strong> fining upward section............................. 68<br />
Figure 6.29. Idealised meandering fluvial facies and grainsize profile............................................ 68<br />
Figure 6.30. Photograph of Rednook-1 core. Depicts a coarsening upwards section, interpreted as<br />
a lacustrine deltaic sequence. ........................................................................................................... 69<br />
Figure 6.31. Example of <strong>the</strong> facies profile for a fluvially dominated lacustrine delta...................... 69<br />
Figure 6.32. Relative palaeo-water level curve. ............................................................................... 71<br />
Figure 6.33. Photograph of Glen Fosslyn-1 core. Shows intra-Showgrounds Sandstone shale....... 72<br />
Figure 6.34. Photograph of Yellowbank Creek North-1 core. Shows <strong>the</strong> rapid transgression of <strong>the</strong><br />
Showgrounds Sandstone by <strong>the</strong> Snake Creek Mudstone ................................................................... 72<br />
Figure 6.35. Multi-channel thickness vs. sedimentary environment cross-plot. ............................... 73<br />
Figure 6.36. Width-to-thickness ratio chart...................................................................................... 74<br />
Figure 6.37.Generic diagram of point-bar complex from <strong>the</strong> Mississippi River ............................. 76<br />
Figure 6.38. Block diagram of a fluvial braided channel.. ............................................................... 76<br />
Figure 6.39. Interpretation of palaeogeography/environment of deposition of <strong>the</strong> Showgrounds<br />
Sandstone lowstand systems tract. .................................................................................................... 78<br />
Figure 6.40. Interpretation of palaeogeography/environment of deposition of <strong>the</strong> Showgrounds<br />
Sandstone early transgressive systems tract. ....................................................................................79<br />
Figure 6.41. Interpretation of palaeogeography/environment of deposition of <strong>the</strong> Showgrounds<br />
Sandstone mid transgressive systems tract. ......................................................................................79<br />
Figure 6.42. Interpretation of palaeogeography/environment of deposition of <strong>the</strong> Snake Creek<br />
Mudstone highstand systems tract..................................................................................................... 80<br />
Figure 6.43.Pre-production flow system of <strong>the</strong> Showgrounds Sandstone......................................... 83<br />
Figure 6.44. Modified flow system for ~1990. .................................................................................. 84<br />
Figure 6.45. Head vs spud data for wells sub-divided into formation. ............................................. 86<br />
Figure 6.46. Head vs spud data for wells.......................................................................................... 86<br />
Figure 6.47. Generic model of lithologies, sedimentary environments and trapping mechanisms of<br />
<strong>the</strong> Showgrounds Sandstone present within <strong>the</strong> model area. ............................................................ 90<br />
Figure 6.48. Numerical simulation results showing gas saturation and reservoir pressure ............ 93<br />
vi
Preface<br />
Queensland is a major producer of electricity, derived overwhelmingly from coal but with coal seam<br />
methane an increasingly important energy source. As a result of this high level of dependency on<br />
fossil fuels, Queensland is also a large scale emitter of carbon dioxide. The State has no wish to<br />
limit its access to cost effective energy but at <strong>the</strong> same time seeks to contribute to <strong>the</strong> overall<br />
objective of decreasing Australia’s greenhouse gas signature. One of <strong>the</strong> options for doing this lies<br />
with <strong>the</strong> application of carbon dioxide capture and storage (CCS) or geosequestration to major<br />
stationary emissions.<br />
This <strong>report</strong> outlines a study of a part of Queensland’s Bowen Basin, where a detailed study of CO 2<br />
storage capacity has been undertaken by a large number of <strong>CO2CRC</strong> researchers from a range of<br />
institutions. The study provides an excellent example of <strong>the</strong> type of work that must be undertaken if<br />
we are to effectively characterize a geological storage site and demonstrate that it will meet <strong>the</strong><br />
requirements of storage security and capacity. The study convincingly demonstrates that <strong>the</strong><br />
Wunger Ridge is likely to be technically suitable as a CO 2 storage site. Obviously more work is<br />
necessary to turn that potential into a technical and economic reality but this Report represents a<br />
very important first step.<br />
I thank all <strong>the</strong> researchers for <strong>the</strong>ir work and also <strong>the</strong> peer reviewers for <strong>the</strong>ir contribution.<br />
Peter J. Cook CBE FTSE<br />
Chief Executive <strong>CO2CRC</strong><br />
Cooperative Research Centre for Greenhouse Gas Technologies<br />
July 2006<br />
vii
Executive Summary<br />
The GEODISC program within <strong>the</strong> Australian Petroleum Cooperative Research Centre<br />
(1999 –2003) project conducted research into geological storage of CO 2 to help provide<br />
information on options for geological storage of CO 2 . A follow-up programme conducted through<br />
<strong>the</strong> Cooperative Research Centre for Greenhouse Gas Technologies (<strong>CO2CRC</strong>; 2004 – present)<br />
aims to fur<strong>the</strong>r develop that research to better understand <strong>the</strong> risk and uncertainties associated with<br />
long term geological storage. This <strong>report</strong> represents research that characterises storage sites within<br />
<strong>CO2CRC</strong> Project 1.1.<br />
A regional review of Queensland’s sedimentary basins was carried out to identify technically viable<br />
areas for injection and storage, prior to focusing <strong>the</strong> remaining work programme on <strong>the</strong> storage sites<br />
with <strong>the</strong> highest potential of success at various scales (i.e. pilot, demonstration and semi regional).<br />
This regional review confirmed that <strong>the</strong> Galilee and Bowen sedimentary basins<br />
possessed geological characteristics suitable for <strong>the</strong> injection and storage of CO 2 generated in<br />
sou<strong>the</strong>ast Queensland. As <strong>the</strong> Galilee Basin is significantly fur<strong>the</strong>r away from potential CO 2<br />
emission sources, <strong>the</strong> Bowen Basin was considered more suitable from a “proving of technology”<br />
viewpoint and assessed more comprehensively.<br />
A review of <strong>the</strong> Bowen Basin identified that <strong>the</strong> eastern side had poor reservoir and seal<br />
characteristics in contrast to <strong>the</strong> western side which had formations with fair to good injectivity<br />
and storage potential which were overlain by significant regional seals. The review identified <strong>the</strong><br />
Showgrounds Sandstone (reservoir) – Snake Creek Mudstone (seal) pair, overlain by <strong>the</strong><br />
Moolayember Formation (secondary seal) in <strong>the</strong> Wunger Ridge area, as having <strong>the</strong> most favourable<br />
properties for CO 2 injection and storage. Multi-scale projects from pilot to sub-commercial sites can<br />
be demonstrated here although detailed estimates of storage volumes have not been carried out.<br />
A study of <strong>the</strong> Showgrounds Sandstone indicates that permeability and environment of deposition<br />
can be correlated and that <strong>the</strong> environment is predictable using sequence stratigraphic concepts.<br />
The interpreted geological model encompasses braided, <strong>the</strong>n meandering stream systems trending<br />
southwest–nor<strong>the</strong>ast terminating at <strong>the</strong> palaeoshoreline in deltaic environments. Permeability ranges<br />
up to eight Darcies with net sand thickness up to 17 m in <strong>the</strong> Showgrounds Sandstone on <strong>the</strong><br />
Wunger Ridge. Petrological analyses showed <strong>the</strong> sand facies as being sourced from both <strong>the</strong><br />
Timbury Hills Formation and Roma Granite, both representing economic basement and having<br />
alternate periods of dominance. The sandstones sourced from <strong>the</strong> granite generally have better<br />
reservoir characteristics.<br />
Regionally, <strong>the</strong> potential contamination of <strong>the</strong> Great Artesian Basin (GAB), which is an important<br />
water resource and overlies <strong>the</strong> targeted reservoir–seal pair, is a key risk to <strong>the</strong> eventual success of<br />
<strong>the</strong> project. This risk was addressed by identifying seals with proven historical integrity using <strong>the</strong><br />
distribution of hydrocarbon pools trapped in <strong>the</strong> subsurface, as well as assessing <strong>the</strong> seals’ integrity<br />
directly from samples.<br />
Mercury injection capillary pressure (MICP) measurements showed <strong>the</strong> Snake Creek Mudstone<br />
capable of holding a column of CO 2 up to 910 m. Seismic interpretation suggests that <strong>the</strong> combined<br />
primary and secondary seal thickness exceeds 250 m on <strong>the</strong> Wunger Ridge flank and that it is<br />
relatively un-faulted, suggesting that <strong>the</strong> seal has lateral integrity across <strong>the</strong> flank area. Anticipated<br />
trapping mechanisms on <strong>the</strong> flank area include small scale stratigraphic traps and residual trapping<br />
which exert little pressure on bounding seals. As such, <strong>the</strong> seal competence required is relatively<br />
low for strength but high for lateral continuity. High seal strength is desirable around any potential<br />
injection site where high pressures are expected as a result of <strong>the</strong> injection operation. The Wunger<br />
Ridge area is in one of <strong>the</strong> most quiescent areas for earthquake activity in Australia.<br />
The hydrodynamic results suggest that <strong>the</strong> Showgrounds Sandstone is not in hydraulic<br />
communication with <strong>the</strong> overlying GAB within <strong>the</strong> greater Wunger Ridge area. Hydrodynamic<br />
results showed a pre-production weak aquifer drive within <strong>the</strong> Showgrounds Sandstone of 0.2 m/yr<br />
towards a hydrodynamic low east of <strong>the</strong> Wunger Ridge in <strong>the</strong> Teelba Creek area, which suggests<br />
1
that a long-term mechanism exists to move water away from <strong>the</strong> potential storage area.<br />
Post–production, <strong>the</strong> hydrodynamic flow of 0.9 m/yr is focused towards a low caused by<br />
hydrocarbon production activities on <strong>the</strong> sou<strong>the</strong>rn Wunger Ridge. Hydrodynamic flows ranging<br />
from 0.2–0.9 m/yr are fairly modest when compared with <strong>the</strong> flow rate of <strong>the</strong> CO 2 front which was<br />
simulated to be migrating at an average of 174 m/y for <strong>the</strong> first 25 years (<strong>the</strong> injection phase).<br />
Multiple reservoir engineering scenarios tested injection rates for various permeability–height<br />
combinations, horizontal–vertical well combinations, as well as variations of o<strong>the</strong>r geological<br />
(i.e. heterogeneity) and engineering parameters (i.e. injection pressure and well spacing parameters).<br />
Reservoir volumetric estimates are currently uncertain and are not included in this <strong>report</strong>. Future<br />
volumetric estimates will be based on both static 3D geological and dynamic models.<br />
The preliminary dynamic modelling of a 30 x 10 km area suggests that storage space for a scenario<br />
involving <strong>the</strong> expected 25 year life-span of a small 200 Megawatt (MW) power station would be<br />
available. Such a scenario would involve injection rates at approximately 1.2 Mt per year for a<br />
total volume of approximately 30 Mt.<br />
Simulation runs using simple models, based on a coarse-scale grid, suggest that ei<strong>the</strong>r one<br />
horizontal or two vertical wells are required to inject at <strong>the</strong> proposed rate. Geological heterogeneity<br />
increases injection pressure around <strong>the</strong> wellbore and reduces injection rates compared to<br />
homogeneous models, resulting in <strong>the</strong> need for more injection wells.<br />
This study has ascertained CO 2 storage potential on <strong>the</strong> Wunger Ridge flank based on reservoir<br />
simulation of coarse-scale models. A second phase of work would be required to encompass fur<strong>the</strong>r<br />
complexities of <strong>the</strong> geology and ascertain <strong>the</strong> extent of <strong>the</strong> impact of petroleum exploration<br />
activities on <strong>the</strong> project. Large-scale storage potential may exist in low permeability rocks in areas<br />
away from well control. Small-scale storage potential will exist when fields of <strong>the</strong> Denison Trough,<br />
Roma Shelf and Wunger Ridge become depleted. The Moonie field could also become available for<br />
storage subject to operator consent.<br />
2
1. Introduction<br />
Significant debate in <strong>the</strong> international community regarding elevated levels of carbon dioxide (CO 2 )<br />
raised interest in geological storage of CO 2 as being an intermediary solution prior to possible noncarbon<br />
based energy solutions being implemented in <strong>the</strong> future. Coal-fired power stations represent<br />
Australia’s primary energy source across all states.<br />
The primary objectives of <strong>the</strong> project were to identify both potential pilot and large-scale storage<br />
sites, build a three dimensional (3D) geological model, simulate fluid flow and develop a greater<br />
understanding of <strong>the</strong> risk and uncertainties associated with long term geological storage at specific<br />
sites, as part of <strong>the</strong> process of geoscientific and engineering site characterisation.<br />
Geoscience Australia is responsible for coordinating Project 1.1 – Technologies for Assessing Sites<br />
for CO 2 Storage for <strong>the</strong> <strong>CO2CRC</strong> using additional specialised input from agencies including <strong>the</strong><br />
Commonwealth Scientific and Industrial Research Organisation (CSIRO), Australian School of<br />
Petroleum (ASP) and <strong>the</strong> University of New South Wales (UNSW). The work on <strong>the</strong> south east<br />
Queensland region to date represents 4.5 work years of effort undertaken by geoscientists at<br />
Geoscience Australia.<br />
The project included:<br />
1. regional basin evaluations for Queensland;<br />
2. professional opinions on specific sites;<br />
3. data entering and Geoscientific interpretation and analysis in Geographical Information<br />
Systems (GIS), Geoframe TM and Petrosys TM software;<br />
4. <strong>the</strong> acquisition and quality controlling of seismic and well data to largely cover <strong>the</strong> Bowen<br />
and Galilee basins. The data covering <strong>the</strong> Galilee Basin was used for in a separate project;<br />
5. short-term assessments within <strong>the</strong> Taroom and Denison troughs;<br />
6. a multidisciplinary assessment of <strong>the</strong> Wunger Ridge area, and<br />
7. research paper accepted for publication by American Association of Petroleum Geologists<br />
(AAPG).<br />
The assessment considered all basins in Queensland, of which <strong>the</strong> Bowen and Galilee basins were<br />
prioritised for fur<strong>the</strong>r evaluation. Of <strong>the</strong> two basins, <strong>the</strong> Bowen Basin is considered in this <strong>report</strong>.<br />
Within <strong>the</strong> Bowen Basin, individual study areas were targeted for study, <strong>the</strong>se include <strong>the</strong>:<br />
1. Denison Trough;<br />
2. east Bowen Basin Study Area (Burunga Anticline/Dulucca area);<br />
3. sou<strong>the</strong>ast Bowen Basin Study Area;<br />
4. nor<strong>the</strong>ast Bowen Basin Study Area;<br />
5. Roma Shelf, and<br />
6. Wunger Ridge flank.<br />
The above options were prioritised. Option 5 was only superficially assessed at this stage, for<br />
reasons discussed in <strong>the</strong> main body of <strong>the</strong> <strong>report</strong>. Option 1 is considered viable but storage sites<br />
would require testing in relatively low porosity and low permeability reservoirs (i.e. ~ < 70 mD and<br />
5 % porosity). The suitability of CO 2 storage in tight reservoirs is known to be viable overseas<br />
(e.g. In Salah, Algeria) but until recently was not considered seriously in Australia. Options 2, 3 and<br />
4 were assessed because of <strong>the</strong> area’s proximity to power-stations located on <strong>the</strong> eastern seaboard.<br />
Option 6 was considered as <strong>the</strong> most favourable option for a comprehensive study, involving 3D<br />
geological models and reservoir simulation.<br />
3
The Wunger Ridge area (60 km by 40 km; southwest Bowen Basin) was considered too large to run<br />
a <strong>full</strong> reservoir simulation at an appropriate resolution. A small 29.5 km by 10 km area on <strong>the</strong><br />
Wunger Ridge flank contained many of <strong>the</strong> geological and hydrological elements expected to be<br />
found along <strong>the</strong> western flank of <strong>the</strong> Bowen Basin, and as such, results were deemed potentially<br />
transferable to o<strong>the</strong>r areas of <strong>the</strong> basin. Simple 2D and 3D geological models were built and<br />
reservoir simulations were run using multiple scenarios to provide <strong>the</strong> greatest amount of<br />
understanding of <strong>the</strong> more significant factors affecting <strong>the</strong> behaviour of CO 2 in <strong>the</strong> subsurface.<br />
This <strong>report</strong> principally focuses on <strong>the</strong> geology, hydrodynamics, geophysics, and reservoir<br />
engineering aspects of <strong>the</strong> Wunger Ridge flank site. The <strong>report</strong> also summarises <strong>the</strong> geoscientific<br />
findings of <strong>the</strong> regional evaluations.<br />
4
2. Geographical and Industrial Setting<br />
2.1. Setting<br />
The Bowen Basin is a mature hydrocarbon basin located in eastern central Queensland. The Basin<br />
extends from just south of Townsville to beyond <strong>the</strong> Queensland–New South Wales border, and<br />
stretches from Moura to west of Springsure or Moonie to east of St George, covering approximately<br />
150,000–200,000 km 2 (Figure 2.1).<br />
Figure 2.1. Location map showing key study areas and features in sou<strong>the</strong>ast Queensland. a) Denison Trough, b)<br />
east Bowen Basin (Burunga Anticline/Dulacca area and NE Bowen Basin), c) Wunger Ridge and flank<br />
(Roma Shelf to <strong>the</strong> north, d) sou<strong>the</strong>ast Bowen Basin (for a closer view of assessed areas (a – d) see Figure 2.2).<br />
The Brisbane (including Tarong and Rockhampton–Gladstone) region emits a significant quantity<br />
of CO 2 . Combined, Queensland emitted 145.1 Mt (million tonnes) or 2.73 TCF (trillion cubic feet)<br />
of CO 2 for 2002 (Australian Greenhouse Office, 2005).<br />
5
The Rockhampton–Gladstone region (Figure 2.1) is a major emission node as it contains five major<br />
CO 2 emitters, representing 49 % of Queensland’s total possible sequesterable stationary CO 2<br />
emissions. The area has <strong>the</strong> potential for a large scale capture project, with storage in ei<strong>the</strong>r <strong>the</strong><br />
sou<strong>the</strong>rn Bowen Basin and/or Denison Trough (part of <strong>the</strong> Bowen Basin). Geological assessments<br />
of <strong>the</strong> major sedimentary basins in Queensland suggested that <strong>the</strong> Bowen and Galilee basins contain<br />
a number of small to large scale options for <strong>the</strong> geological storage of CO 2 . The Bowen Basin alone<br />
could provide sufficient storage volume to make significant cuts to Queensland’s CO 2 emissions<br />
profile.<br />
The Bowen Basin contains producing hydrocarbon pools which upon depletion may provide long<br />
term storage and injectivity options, relatively close to sou<strong>the</strong>ast Queensland’s major CO 2 emission<br />
hubs. On that basis, it was decided to concentrate on this basin for <strong>the</strong> first phase of <strong>the</strong> work.<br />
A summary of <strong>the</strong> geology and risk factors associated with <strong>the</strong> potential for CO 2 storage of <strong>the</strong><br />
sedimentary basins in Queensland is provided in Chapter 3.<br />
The Bowen Basin is located between 300 and 600 km west to northwest of Brisbane and 100 to 200<br />
km west of <strong>the</strong> Rockhampton - Gladstone region. The Basin supplies both gaseous hydrocarbons<br />
and coal to <strong>the</strong> electricity producers and major industries. These are also <strong>the</strong> major CO 2 emitters in<br />
sou<strong>the</strong>ast Queensland. This has resulted in a large infrastructure network of rail lines and pipelines<br />
joining <strong>the</strong> Bowen Basin to <strong>the</strong> east coast of Queensland. This infrastructure may provide potential<br />
access corridors for CO 2 pipelines in <strong>the</strong> future. These pipelines could subsequently be extended<br />
fur<strong>the</strong>r west to <strong>the</strong> Galilee Basin if a suitable storage site is identified.<br />
Due to <strong>the</strong> large volumes of CO 2 expected to be emitted from <strong>the</strong> sou<strong>the</strong>ast Queensland region, a<br />
number of possible CO 2 geological storage options were examined in <strong>the</strong> Bowen Basin. The basin<br />
was divided into a number of study areas, as discussed in <strong>the</strong> introduction.<br />
1. Denison Trough;<br />
2. east Bowen Basin Study Area (Burunga Anticline/Dulucca area);<br />
3. sou<strong>the</strong>ast Bowen Basin Study Area;<br />
4. nor<strong>the</strong>ast Bowen Basin Study Area;<br />
5. Roma Shelf, and<br />
6. Wunger Ridge flank.<br />
The Roma Shelf located near <strong>the</strong> township of Roma and nor<strong>the</strong>ast Bowen Basin are yet to be <strong>full</strong>y<br />
assessed for geological storage of CO 2 . This is due to an increase in a number of risk factors in <strong>the</strong><br />
nor<strong>the</strong>ast of <strong>the</strong> Bowen Basin, including faulting, and interpreted poor reservoir quality. The Roma<br />
Shelf assessment is contingent on <strong>the</strong> Wunger Ridge results.<br />
The Denison Trough (Figure 2.2a) is favourably located due to its proximity to a major emission<br />
hub in <strong>the</strong> Rockhampton–Gladstone region. The Denison Trough contains a significant volume of<br />
hydrocarbons that are currently in production. The development of infrastructure for <strong>the</strong><br />
compression and transport of hydrocarbon gas from <strong>the</strong> Denison Trough to <strong>the</strong> east coast may assist<br />
in provision of access to land for CO 2 transportation facilities (e.g. pipelines).<br />
6
Figure 2.2. Close-up images of study areas in <strong>the</strong> Bowen Basin.<br />
a) Denison Trough, b) east Bowen Basin (Burunga Anticline/Dulacca area and NE Bowen Basin), c) Wunger<br />
Ridge and Roma Shelf to <strong>the</strong> north, d) sou<strong>the</strong>ast Bowen Basin.<br />
7
Due to its location (proximal to <strong>the</strong> Rockhampton–Gladstone region) and existing pipeline<br />
corridors, <strong>the</strong> Denison Trough in <strong>the</strong> northwest Bowen Basin appears suitably located to act as a<br />
node/distribution centre for multiple CO 2 injection sites in <strong>the</strong> Galilee and Bowen basins.<br />
The east Bowen Basin area (Burunga Anticline, Dulacca area; Figure 2.2b) is located adjacent to <strong>the</strong><br />
township of Wandoan, 300 to 350 km from Brisbane, Rockhampton and Gladstone regions. With<br />
only small CBM (coal bed methane) fields located in this region, <strong>the</strong> smallest area examined, <strong>the</strong><br />
Burunga Anticline/Dulacca area, has limited infrastructure and minimal data on <strong>the</strong> deeper potential<br />
CO 2 storage reservoirs. The limited data indicates a high risk of less than optimal reservoir (using<br />
<strong>the</strong> current minimum cut-off of 50 mD for optimal CO 2 injection).<br />
The Wunger Ridge flank area (Figure 2.2c) contains significant producing hydrocarbon<br />
accumulations and associated infrastructure. Located in <strong>the</strong> southwest Bowen Basin, it is suitably<br />
placed to accept CO 2 emissions from a sou<strong>the</strong>ast Queensland hub servicing <strong>the</strong> greater Brisbane<br />
area. Direct pipeline access to Brisbane, via <strong>the</strong> Jackson–Moonie–Brisbane oil pipeline potentially<br />
provides an easement for CO 2 infrastructure.<br />
The sou<strong>the</strong>ast Bowen Basin area (Figure 2.2d) is <strong>the</strong> closest region to Brisbane, less than 300<br />
kilometres, and has direct pipeline access via <strong>the</strong> Roma–Brisbane gas pipeline in <strong>the</strong> north and <strong>the</strong><br />
Jackson–Moonie–Brisbane oil pipeline in <strong>the</strong> south. The sou<strong>the</strong>ast Bowen Basin area has very<br />
minor hydrocarbon production and as such has little internal infrastructure.<br />
Work is presently being conducted by a private consortium that is considering building an<br />
integrated gasification combined cycle (IGCC) plant in Queensland (IEAGHG, 2005). This<br />
consortium may have to consider injection in less than optimal reservoirs with a minimum average<br />
permeability of around 2–5 mD. If this innovative programme is successful in injecting CO 2 at rates<br />
which match <strong>the</strong> expected emissions, <strong>the</strong>n <strong>the</strong> east and sou<strong>the</strong>ast Bowen Basin areas could<br />
potentially become attractive.<br />
2.2. CO 2 Properties<br />
Industrial and power generation processes in <strong>the</strong> state of Queensland are currently emitting large<br />
volumes of CO 2 with power usage and corresponding CO 2 emissions expected to grow significantly<br />
in <strong>the</strong> coming years. If geological storage of CO 2 is to have a significant impact on <strong>the</strong>se emissions<br />
<strong>the</strong>n storage space must be used effectively.<br />
Injecting CO 2 in a supercritical phase has major benefits for injectivity and storage efficiency. In a<br />
supercritical phase, <strong>the</strong> CO 2 has a viscosity less than <strong>the</strong> liquid phase, a diffusivity similar to <strong>the</strong> gas<br />
phase, but has been compressed to <strong>the</strong> point were it has similar density to <strong>the</strong> liquid phase<br />
(Table 2.1). Having CO 2 in a supercritical phase greatly increases <strong>the</strong> volume of CO 2 able to be<br />
stored within a geological formation. At 800 m, <strong>the</strong> pressure exerted at depth is approximately 8<br />
Mpa, and <strong>the</strong> temperature is normally greater than 32 0 C, which are <strong>the</strong> conditions at which CO 2<br />
enters a supercritical phase (Figure 2.3, Bachu, 2001). Therefore, having a reservoir–seal pair at<br />
depths greater than 800 m is desirable for CO 2 storage.<br />
Table 2.1. Physical properties of Carbon Dioxide (After Cook et al., 2000).<br />
Phase Density (g/mL) Viscosity (poise) Diffusivity (cm 2 /s)<br />
Gas 0.001 0.00005–0.00035 0.1–1.0<br />
Supercritical fluid 0.2–0.9 0.002–0.001 0.00033<br />
Liquid 0.8–1.0 0.003–0.024 0.000005–0.00002<br />
8
10000<br />
1000<br />
AOI for carbon<br />
dioxide injection<br />
Carbon Dioxide Phase Diagram<br />
Zone of Interest for Geological Storage<br />
SOLID<br />
100<br />
10<br />
Pressure Mpa<br />
LIQUID<br />
SUPERCRITICAL<br />
Critical Point<br />
1<br />
Triple Point<br />
VAPOR<br />
GAS<br />
Temperature Celcius<br />
STP = 15 Centigrade and<br />
0.101325 Mpa<br />
0<br />
-100 -50 0 50 100 150 200<br />
Figure 2.3. Phase diagram for carbon dioxide. Shows temperature and pressure relationships for different<br />
phase states of CO 2 (after Bachu, 2001).<br />
2.3. Chapter References<br />
Australian Greenhouse Gas Office, 2005. State and Territory Greenhouse Gas Emission - An<br />
Overview. Department of <strong>the</strong> Environment and Heritage, Australian Government.<br />
Bachu, S., 2001. Geological sequestration of anthropogenic Carbon Dioxide: Applicability and<br />
current issues, in Gerhard, L.C., Harrison, W.E and Hanson, eds., Geological perspectives of global<br />
climate change. P. 285–303.<br />
Bradshaw, B., Bradshaw, J., Dance, T., Reilly, N.S., Sayers, J., Spencer, L. & Wilson, P., 2003.<br />
GEODISC ArcView GIS Version 2.01. APCRC Confidential GIS.<br />
Cook, P.J., Rigg, A. & Bradshaw, J., 2000. Putting it back were it came from: is geological disposal<br />
an option for Australia?. APPEA Journal 40(1), p. 654–666.<br />
IEAGHG, 2005. Greenhouse issues no. 70, September 2005. www.ieagreen.org.uk.<br />
9
3. Geological Setting, Regional Stratigraphy and Structure<br />
To make a <strong>full</strong> assessment of <strong>the</strong> potential for geological storage of CO 2 from sou<strong>the</strong>ast Queensland<br />
sources, it was important to examine all storage possibilities within Queensland. The first step in<br />
this process was a regional overview of Queensland sedimentary basins (Figure 3.1) to identify all<br />
possible areas where CO 2 might be stored in geological formations.<br />
Igneous and metamorphic rocks generally lack significant pore space and permeability to store<br />
substantial volumes of hydrocarbons and as such, are not considered suitable for <strong>the</strong> geological<br />
storage of CO 2 . As a result, <strong>the</strong> only possible locations for <strong>the</strong> geological storage of CO 2 are areas<br />
where <strong>the</strong>re are significant volumes of sedimentary rocks (i.e. sedimentary basins).<br />
Deposition in sedimentary basins began in Queensland in <strong>the</strong> Proterozoic in <strong>the</strong> northwest and north<br />
of <strong>the</strong> state (Mount Isa) with predominantly fine grained sediments resulting in rocks that today<br />
contain little to no effective porosity and <strong>the</strong>refore little storage capacity (Day et al., 1983).<br />
Deposition continued in Queensland throughout <strong>the</strong> early Palaeozoic, Mesozoic and Cenozoic<br />
across large parts of <strong>the</strong> state, resulting in a number of basins with <strong>the</strong> geological characteristics that<br />
could allow <strong>the</strong>m to store CO 2 in <strong>the</strong> subsurface (Day et al., 1983).<br />
Some key characteristics related to geological storage of CO 2 of <strong>the</strong> sedimentary basins active<br />
during early Palaeozoic, Mesozoic and Cenozoic were documented and compared to <strong>the</strong> five basic<br />
risk factors used to assess suitability for CO 2 storage (Table 3.1). As a result of <strong>the</strong> overview, this<br />
project focused on <strong>the</strong> Permo-Triassic Bowen Basin. A detailed analysis of <strong>the</strong> Carboniferous–<br />
Triassic Galilee Basin is <strong>the</strong> subject of a separate project.<br />
3.1. Eastern Queensland Basins<br />
The following summaries relied heavily on <strong>the</strong> work performed under <strong>the</strong> GEODISC program and<br />
where possible are using data directly from that <strong>report</strong>.<br />
3.1.1. North Queensland Coastal Cenozoic Basins (includes Oil Shale Basins – Duaringa,<br />
Yaamba, Casuarina, Hillsborough, Narrows and Nagoorin).<br />
These basins, as a group, tend to be small, shallow, lightly explored and shale prone with poor<br />
reservoir development. These characteristics indicate a large uncertainty for potential storage<br />
volume and reservoir quality risk. Carbon dioxide injection into oil shale could be a future option<br />
using organic adsorption similar to coal. However this is still only at <strong>the</strong> conceptual stage with a<br />
trial underway located in <strong>the</strong> state of Kentucky, U.S.A.<br />
The GEODISC project stated that, <strong>the</strong> onshore Hillsborough Basin displays poor reservoir character<br />
and <strong>the</strong>refore offers no potential for CO 2 sequestration. In addition to this, a ban on offshore<br />
exploration, due to its proximity to <strong>the</strong> Great Barrier Reef, means <strong>the</strong> rest of <strong>the</strong> Hillsborough Basin<br />
can not be assess (Bradshaw et al., 2003). GEODISC did not assess <strong>the</strong> o<strong>the</strong>r Cenozoic Basins.<br />
3.1.2. North Queensland Coastal Mesozoic Basin (Laura Basin).<br />
Three petroleum exploration wells and one stratigraphic well have been drilled in <strong>the</strong> Laura Basin<br />
(Denaro & Shield, 1993). The base of <strong>the</strong> sealing units are between 282–359 m deep and <strong>the</strong> basin<br />
is <strong>the</strong>refore too shallow to maintain CO 2 in <strong>the</strong> supercritical state. Due to an absence of suitable<br />
reservoirs at depths greater than 800 m and <strong>the</strong> economic importance of <strong>the</strong> groundwater resources<br />
in this region, <strong>the</strong> Laura Basin has been assessed as having little potential for <strong>the</strong> geological storage<br />
of CO 2 .<br />
“The Laura Basin is not a viable geological sequestration option due to <strong>the</strong> lack of suitable ESSCI’s<br />
at depths >800m and <strong>the</strong> economic importance of groundwater resources in <strong>the</strong> area”<br />
(Bradshaw et al., 2003).<br />
10
l<br />
l<br />
145° 150°<br />
l<br />
Moranbah<br />
Long reac h<br />
Galilee<br />
Basin<br />
SB<br />
CTB<br />
Roc kha m pton<br />
Blackwater Stanwell<br />
Gladstone<br />
Blac ka ll<br />
Sp ring sure<br />
Moura<br />
CYB<br />
CTB<br />
Callide<br />
<strong>MB</strong><br />
-25°<br />
l<br />
Cooper<br />
Basin<br />
Bowen<br />
Basin<br />
Wandoan<br />
Eromanga<br />
Basin<br />
Surat<br />
Basin<br />
Wunger<br />
Ridge<br />
St George<br />
C<strong>MB</strong><br />
0 50 100 200<br />
Figure 3.1. Location of selected Key Population sedimentary Centres basins Power in Stations sou<strong>the</strong>ast Pipelines Queensland. Rail Basins are shaded. C<strong>MB</strong> =<br />
Clarence–Moreton Km Basin; EAT = Esk and Abercorn Troughs; TB = Tarong Basin; NB = Nambour Basin;<br />
l<br />
<strong>MB</strong> = Maryborough Basin; CYB = Callide Basin; CTB = Coastal Cenozoic Basins; SB = Styx Basin. Underlying<br />
older basins have not been shown.<br />
Rom a<br />
Moonie<br />
l<br />
Kogan Creek<br />
Millmerran<br />
TB<br />
Tarong<br />
EAT<br />
Swanbank<br />
Brisbane<br />
NB<br />
3.1.3. Styx Basin<br />
The Styx Basin (Figure 3.1) contains a shallow, less than 400 m, Cretaceous age succession of<br />
coastal sandstone, shale, conglomerate and coal (Malone et al., 1969; Day et al.,1983). The basin is<br />
considered too small and shallow with little good quality reservoir development to store <strong>the</strong> volume<br />
of CO 2 required to match emissions.<br />
3.1.4. Clarence-Moreton Basin.<br />
Ipswich and Greater Brisbane Area.<br />
Based on <strong>the</strong> 19 exploration wells (~ < 250 m deep) and 5 stratigraphic wells drilled (P.R.A.D.S,<br />
1990), <strong>the</strong> Ipswich Coal Measures are interpreted to crop out within <strong>the</strong> Ipswich and Greater<br />
Brisbane area (Figure 3.1) or are close to <strong>the</strong> surface. All formations beneath <strong>the</strong> Ipswich Coal<br />
Measures have very high volcanic content, which is prone to diagenetic alteration that reduces<br />
injectivity and <strong>the</strong>refore offer no reservoir potential. The Ipswich Basin is dominated by a series of<br />
north–northwest trending faults (P.R.A.D.S, 1990) which are unfavourably orientated with respect<br />
to <strong>the</strong> regional stress regime. This indicates a potential seal risk associated with <strong>the</strong> faults (Enever,<br />
1990). The Ipswich Basin has no CO 2 sequestration potential due to <strong>the</strong> shallow depth and <strong>the</strong> lack<br />
of effective vertical and lateral seals.<br />
The geological sequestration potential of <strong>the</strong> Ipswich Basin is considered to be negligible, with <strong>the</strong><br />
only (though relatively poor) option being to inject CO 2 into coal seams from <strong>the</strong> Ipswich Coal<br />
Measures (Bradshaw et al., 2003).<br />
11
Western Part of Basin<br />
Glamorgan-1 is <strong>the</strong> deepest of only a few wells drilled into <strong>the</strong> western Clarence–Moreton Basin.<br />
The well intersected five metres of sandstone at a depth of 875 m (KB). Tuff fragments within <strong>the</strong><br />
sandstone indicate a high potential for reactivity with a CO 2 fluid (i.e. <strong>the</strong>y are prone to diagenetic<br />
alteration, which reduces injectivity). The area has high reservoir risk and negligible potential<br />
storage volume. Reservoir quality does improve to <strong>the</strong> west (Thompson, 1987) and into <strong>the</strong><br />
adjoining Surat Basin. However, <strong>the</strong>se potential reservoirs are relied upon heavily to supply<br />
substantial quantities of ground water for irrigation and <strong>the</strong>refore cannot be used for CO 2 storage.<br />
Sou<strong>the</strong>rn Highlands Queensland<br />
In this basin conventional gas was intersected at a depth of only 580 m, where <strong>the</strong> coal rank is low.<br />
Russell (1994) suggested <strong>the</strong> source of <strong>the</strong> gas was <strong>the</strong>rmogenic migrating from a mature deeper<br />
source. This implies vertical migration and minimal long term sealing potential in <strong>the</strong> deeper<br />
section. In addition, sample analysis shows <strong>the</strong> porosity of <strong>the</strong> main reservoir interval to be less than<br />
7% (Thompson, 1987). As mentioned above, low porosity and permeability reservoirs are still being<br />
evaluated for <strong>the</strong>ir potential as CO 2 storage sites.<br />
New South Wales<br />
Petroleum exploration to date (12 wells) has targeted various intervals and has failed to prove even<br />
very small hydrocarbon volume potential (< 30 BCF). Sandstones in this part of <strong>the</strong> Clarence–<br />
Moreton Basin are very lithic and <strong>the</strong> fluvial depositional environment indicates high potential for<br />
laterally discontinuous seals (i.e. likely upward migration). Reservoir analysis estimates porosities<br />
of less than five percent and permeabilities of less than 10 mD. The sandstone generally has a high<br />
lithic content, including feldspars, carbonates, chert and volcanics. Some of <strong>the</strong> best porosity<br />
measurements originate from <strong>the</strong> Walloon Coal Measures sandstones which have a clay dominated<br />
matrix and no overlying sealing unit.<br />
Clarence–Moreton Basin – Summary<br />
The present dataset is not extensive enough for a detailed CO 2 storage assessment of <strong>the</strong> basin,<br />
however <strong>the</strong> data that does exist suggests that overall <strong>the</strong> Clarence–Moreton Basin has a high<br />
reservoir risk with unproven to leaky seals. The Ma Ma Creek seal, considered <strong>the</strong> most reliable<br />
(O’Brien et al., 1994), has internal lithologies from which a reading of 11.2% porosity was<br />
measured (Thompson, 1987). This reading exceeds <strong>the</strong> porosity of most sandstone reservoirs in <strong>the</strong><br />
Clarence–Moreton Basin.<br />
The GEODISC project stated <strong>the</strong> Clarence-Moreton Basin has good potential to hydrodynamically<br />
sequester large volumes of CO 2 within <strong>the</strong> Ripley Road Sandstone (Sou<strong>the</strong>rn Highlands Queensland<br />
and New South Wales, Bradshaw et al., 2003). However reservoir quality of sandstones in this basin<br />
is generally poor, but erratic and leaky faults pose a significant containment risk – highlighted by<br />
<strong>the</strong> discovery of gas in fractured basalts at a depth of 580m.<br />
3.1.5. Nambour Basin.<br />
The Nambour Basin shown in figure 3.1 has little potential for CO 2 storage because of <strong>the</strong> shallow<br />
depth and absence of suitable seals. The basin is poorly explored, with a total sediment thickness<br />
of approximately 500 m (Day et al., 1983). Storage volume would be comparatively low with<br />
comparatively high risk as <strong>the</strong> CO 2 would be stored at sub-critical temperatures and pressures<br />
without a regional seal to prevent vertical migration. The Nambour, Moreton and Maryborough<br />
basins were interconnected during <strong>the</strong> Early Jurassic (Day et al., 1983) suggesting that a sequence<br />
stratigraphic model incorporating data from all three basins may possibly indicate areas useful for<br />
niche CO 2 storage opportunities. “The Nambour Basin has no potential to sequester CO 2 from ei<strong>the</strong>r<br />
major or minor sources” (Bradshaw et al., 2003).<br />
12
Table 3.1. Summary of <strong>the</strong> key risk factors associated with geological storage of CO 2 in Queensland sedimentary basins.<br />
Basin<br />
Group<br />
Basin Names Basin Initials Basin Age<br />
Key Risk Factors<br />
Depth Reservoir Seal Groundwater Size Faulting<br />
Data Volume<br />
Additional Comments<br />
Coastal Tertiary Basins<br />
(inc. Oil Shale Basins –<br />
Duaringa, Yaamba,<br />
Casuarina, Hillsborough,<br />
Narrows and Nagoorin<br />
CTB<br />
Tertiary<br />
Mostly<br />
shallow<br />
Shale prone<br />
Anticipated to<br />
be adequate<br />
No reservoirs<br />
Mostly small<br />
Can be<br />
significant<br />
Poor at depth<br />
Under explored at depth<br />
due to poor reservoir<br />
development and<br />
exploration results<br />
Laura Basin (north of<br />
Cairns)<br />
LB<br />
Jurassic to<br />
mid-<br />
Cretaceous<br />
Seal ~350m Good Too shallow<br />
Economically<br />
significant<br />
Significant Minor Poor<br />
Parts protected by<br />
Great Barrier Reef<br />
World Heritage marine<br />
park<br />
Styx Basin<br />
SB<br />
Early<br />
Cretaceous<br />
Too shallow<br />
Poorly<br />
developed<br />
High risk Minor usage Very small Variable Significant<br />
Heavily explored and<br />
mined for coal. ~500 ─<br />
600m<br />
Eastern Qld Basins<br />
Clarence–Moreton Basin<br />
Nambour Basin<br />
Maryborough Basin<br />
C<strong>MB</strong><br />
NB<br />
<strong>MB</strong><br />
Latest Triassic to mid-Cretaceous<br />
Potentially<br />
adequate<br />
Relatively<br />
shallow<br />
Adequate<br />
Poor – 11%<br />
Highly lithic<br />
Economically<br />
porosity<br />
and volcanic.<br />
significant in<br />
(Thompson,<br />
High risk<br />
parts<br />
1987)<br />
Quite large<br />
Present Not present Minor usage Small<br />
Poor potential<br />
(P.R.A.D.S, High risk Shallow use Significant<br />
1990)<br />
Can be<br />
significant<br />
Some faulting<br />
(P.R.A.D.S,<br />
1990)<br />
Heavily (Hill,<br />
1994)<br />
Inadequate<br />
Sufficient<br />
Poor<br />
Basin being monitored<br />
for future exploration<br />
Extends under Fraser<br />
Island and Great<br />
Barrier Reef World<br />
Heritage Marine Park<br />
Callide Basin/Yarrol<br />
Block<br />
CAL<br />
Middle<br />
Permian to<br />
Late Triassic<br />
Too shallow Poor quality High risk Shallow usage Small Some Sufficient<br />
Esk and Abercorn<br />
Troughs<br />
EAT<br />
Early to<br />
Middle<br />
Triassic<br />
Shallow Very poor High risk MA Very small Some Small<br />
Thickest known<br />
accumulation of<br />
volcanic extrusives in<br />
Qld (Day et al., 1983)<br />
Poorly<br />
Tarong Basin TB Late Triassic<br />
~300m (Day<br />
et al., 1983)<br />
developed<br />
(Day et al.,<br />
NA NA Very small NA Small<br />
1983)<br />
Calen Basin (Mackay) CB Permian<br />
Generally too<br />
shallow<br />
Heavily<br />
intruded<br />
NA NA Very small NA Small<br />
Very heavily intruded<br />
(Brakel, 1989)<br />
Unknown –<br />
Lakefield Basin (underlies<br />
Laura Basin)<br />
LFB Permian Adequate<br />
only top 100m<br />
penetrated<br />
(Wellman,<br />
Unknown Not used Significant Variable Inadequate<br />
10km of seismically<br />
define sediments<br />
(Wellman, 1995)<br />
1995)<br />
Great Artesian<br />
Basin (GAB)<br />
Surat, Eromanga,<br />
Carpentaria and<br />
Mulgildie Basins<br />
GAB<br />
Jurassic to<br />
Cretaceous<br />
Adequate<br />
Fantastic<br />
Adequate (but<br />
numerous water<br />
bore<br />
penetrations)<br />
Economically<br />
significant<br />
Covers most<br />
of state<br />
Some<br />
Significant<br />
10s to 100s of thousands<br />
of water bores present<br />
leakage risk<br />
Older/Deeper Basins<br />
Cooper Basin<br />
Warburton, Adavale,<br />
Drummond, Hodgkinson,<br />
Gilberton, Bundock,<br />
Clarke River and<br />
Burdekin Basins<br />
COB<br />
ODB<br />
Permian to<br />
Triassic<br />
Devonian to<br />
Carboniferou<br />
s<br />
Very deep<br />
Mostly very<br />
deep (overlain<br />
by up to two<br />
o<strong>the</strong>r basins)<br />
Generally<br />
poor<br />
Generally<br />
very poor<br />
(significant<br />
diagenesis)<br />
Excellent<br />
No water but<br />
significant<br />
hydrocarbons<br />
Quite Large Significant Significant<br />
Adequate NA Significant Significant Adequate<br />
1000km from nearest<br />
power station<br />
Remote from CO 2<br />
sources.<br />
Good<br />
Galilee Basin<br />
GB<br />
Carboniferou<br />
s to Triassic<br />
Deep<br />
Variable some<br />
very good<br />
Anticipated to be<br />
adequate<br />
Unused fresh<br />
water<br />
Large Some Sparse<br />
Poorly explored<br />
compared to o<strong>the</strong>r<br />
basins<br />
Potential<br />
Bowen Basin<br />
BB<br />
Permian to<br />
Triassic<br />
Deep<br />
Variable some<br />
very good<br />
Excellent<br />
Unused fresh<br />
water<br />
Large Variable Good<br />
Triassic sandstones have<br />
<strong>the</strong> best porosity<br />
13
3.1.6. Maryborough Basin.<br />
Exploration results indicate that <strong>the</strong> transgressive sequence at <strong>the</strong> base of <strong>the</strong> Maryborough<br />
Formation contains suitable reservoir–seal development (Day et al., 1983). However, potential<br />
reservoirs are of poor quality (P.R.A.D.S, 1990). There appears to be limited storage capacity in<br />
this basin based on <strong>the</strong> 11 exploration and 39 stratigraphic wells drilled into <strong>the</strong> basin, and <strong>the</strong> aerial<br />
extent of explored structures within <strong>the</strong> basin. Inversion in <strong>the</strong> middle Cretaceous resulted in major<br />
folding and faulting (Hill, 1994). The Maryborough Basin extends beneath <strong>the</strong> shelf sou<strong>the</strong>ast of<br />
Fraser Island, where it is folded and faulted (Hill, 1994) increasing <strong>the</strong> potential for CO 2 leakage<br />
near two world heritage national parks (Fraser Island and <strong>the</strong> Great Barrier Reef). Overall <strong>the</strong><br />
Maryborough Basin is considered too high risk for <strong>the</strong> small potential storage volume that may<br />
exist.<br />
The GEODISC project concluded that <strong>the</strong> Maryborough Basin onshore dry structures have 0.05%<br />
change of success<strong>full</strong>y sequestering CO 2 . Much larger offshore structures exist, but would need to<br />
be tested for hydrocarbons before CO 2 sequestration could occur (Bradshaw et al., 2003).<br />
The offshore features are also in environmentally sensitive areas (Great Barrier Reef Marine Park<br />
and Fraser Island), <strong>the</strong>refore making fur<strong>the</strong>r exploration and drilling difficult. The hydrodynamic<br />
trapping of CO 2 in <strong>the</strong> Maryborough Basin is unlikely due to a lack of sub-surface well data and<br />
excessive depths associated with high reservoir pressures and high costs.<br />
3.1.7. Callide Basin.<br />
The Callide Basin (Figure 3.1) is unsuited for geological storage of CO 2 as <strong>the</strong> sediments contain a<br />
significant proportion of volcano-clastic material. This material is prone to diagenetic alteration,<br />
reducing injectivity. The Callide Basin overlies a 1000 m succession of volcanic rocks,<br />
conglomerates, sandstones and carbonaceous mudstones with poor reservoir quality. The Triassic<br />
coal sequences are an economic resource, <strong>the</strong>refore, are unavailable for geological storage of CO 2 .<br />
The Callide Basin offers no potential for <strong>the</strong> geological sequestration of CO 2 (Bradshaw et al.,<br />
2003).<br />
3.1.8. Esk and Abercorn Troughs.<br />
These troughs (Figure 3.1) are very small and shallow with limited data. There is considerable<br />
reservoir risk as <strong>the</strong>y contain extrusive volcanics (Day et al., 1983).<br />
3.1.9.Tarong Basin.<br />
The Tarong Basin contains <strong>the</strong> Tarong Beds which comprise conglomerate, pebbly sandstone,<br />
sandstone, shale and coal to a total thickness of approximately 300 m (Day et al.,1983). The small<br />
size and shallow depth make <strong>the</strong> Tarong Basin an implausible site for geological storage of CO 2 .<br />
3.1.10.Calen Basin.<br />
The Permian sediments in <strong>the</strong> Calen Basin (Figure 3.1) are generally too shallow and <strong>the</strong> coal<br />
measures are intruded by numerous Permian to Cretaceous aged dolerites, rhyolites and granites that<br />
dramatically increase <strong>the</strong> seal risk (Brakel, 1989). Although this interpretation was undertaken<br />
without petroleum well data, <strong>the</strong> assessment concludes that <strong>the</strong>re is little potential for <strong>the</strong> geological<br />
storage of CO 2 .<br />
The Permian sediments of <strong>the</strong> Calen Basin are in general too shallow and offer no potential for <strong>the</strong><br />
sequestration of CO 2 (Bradshaw et al., 2003).<br />
14
3.1.11. Lakefield Basin.<br />
The Lakefield Basin underlies <strong>the</strong> Laura Basin in north Queensland, is considered to be of Permian<br />
age, and based on seismic interpretation, contains up to 10 km of sediments (Wellman, 1995). No<br />
wells have penetrated more <strong>the</strong>n 112 m into <strong>the</strong> Lakefield Basin section. There is insufficient data<br />
available to make a realistic assessment of this basin (Wellman, 1995).<br />
3.2. Great Artesian, Surat, Eromanga, Carpentaria and<br />
Mulgildie Basins<br />
The Surat, Eromanga, Carpentaria and Mulgildie basins are hydraulically connected toge<strong>the</strong>r to<br />
make up <strong>the</strong> Great Artesian Basin, a world class groundwater resource (Figure 3.2). This water<br />
resource supports a significant proportion of <strong>the</strong> Queensland rural economy. There are thousands<br />
of registered and an unknown number of unregistered water-bores drilled to exploit this resource,<br />
posing a substantial leakage risk to any regional scale CO 2 storage site. Localised, field scale<br />
opportunities for CO 2 storage may exist particularly in depleted hydrocarbon fields located within<br />
<strong>the</strong>se basins.<br />
Figure 3.2. Stratigraphy of <strong>the</strong> Great Artesian Basin (after Radke et al., 2000).<br />
15
Moonie Oil Field<br />
PL 1 permit, Surat Basin, onshore eastern Queensland, approximately 300 kilometres west of<br />
Brisbane. Santos Ltd has a 100% interest and is <strong>the</strong> operator (Santos, 2005).<br />
Oil was discovered on <strong>the</strong> Moonie Anticline within <strong>the</strong> Jurassic Precipice Formation in 1961.<br />
The 24.3 million-barrel (3859 mega litre) oil field was brought into production during 1964 with<br />
peak production of approximately 9000 bbls/day occurring during 1966. As at 1996 cumulative<br />
oil production was approximately 3686 mega litres (23.2 MMbbls).The Precipice Sandstone at <strong>the</strong><br />
Moonie location has an average permeability of 290 mD with an average porosity of 18% (Cadman<br />
et al. 1998).<br />
The field is in <strong>the</strong> latter stages of decline with 0.0694 mmboe of crude oil produced during 2004<br />
with a very high water cut. Most of <strong>the</strong> 50 wells at Moonie and <strong>the</strong> nearby satellite fields are shut in,<br />
and less than 10 wells are still producing. Eight wells on <strong>the</strong> fields are used for water injection.<br />
Recently a 3D seismic survey has been acquired over <strong>the</strong> field<br />
(http://www.santos.com.au/Content.aspx?p=2268).<br />
The Moonie field has <strong>the</strong> potential to be suitable for enhanced oil recovery or as a CO 2 storage site.<br />
As cooperation with Santos Ltd would be required for this to be realised, it was thought impractical<br />
to make it <strong>the</strong> subject of a separate geological or geophysical review with <strong>the</strong> limited available open<br />
file data. This is particularly true considering that post 3D data acquisition, all available seismic,<br />
well and field data would have been incorporated into determining <strong>the</strong> location of <strong>the</strong> two<br />
subsequent wells drilled on <strong>the</strong> Moonie structure.<br />
The GEODISC project concluded that, depleted gas fields in <strong>the</strong> Surat Basin (UEI’s 30, 31, 33, 34,<br />
and 35) represent a very low risk sequestration option with a high geologic chance of success<br />
(35-52%) for volumes of < 0.19 TCF of CO 2 (Bradshaw et al., 2003).<br />
3.3. Older/Deeper Basins<br />
3.3.1 Cooper Basin<br />
The Cooper Basins’ location in central Australia is approximately 1000 km from <strong>the</strong> nearest coal<br />
fired power station. Exploiting petroleum resources from <strong>the</strong> Cooper Basin is <strong>the</strong> primary activity<br />
at this time. This activity results in <strong>the</strong> venting to <strong>the</strong> atmosphere of potentially sequesterable CO 2 .<br />
The Cooper Basin has not been reviewed in this study.<br />
The GEODISC project concluded that, <strong>the</strong> Cooper Basin is an ideal site for carbon-dioxide<br />
sequestration with a 90% chance of successful CO 2 sequestration (Bradshaw et al., 2003).<br />
3.3.2 Devonian to Carboniferous Basins (Warburton, Adavale, Drummond, Hodgkinson,<br />
Gilberton, Bundock, Clarke River, and Burdekin Basins).<br />
The Carboniferous to Devonian Adavale Basin has <strong>the</strong> highest storage potential of <strong>the</strong> older basins,<br />
although comparatively this is still low and containment may be problematic due to fault leakage<br />
and <strong>the</strong> potential for injected CO 2 to dissolve <strong>the</strong> carbonate formations. The basin has been<br />
extensively investigated with 46 exploration wells and 11 appraisal wells, with <strong>the</strong> most likely<br />
storage option being within <strong>the</strong> Gilmore field once it is depleted. The Gilmore field is a 118 BCF,<br />
3352 m deep potentially fault controlled gas field and is <strong>the</strong> only commercial hydrocarbon<br />
accumulation discovered in <strong>the</strong> basin to date (deBoer, 1996). Sedimentary rocks<br />
within Devonian ─ Carboniferous aged basins, tend to be diagenetically altered, with sediments<br />
buried deeply. Additionally reservoir characteristics are poor and <strong>the</strong> basins are overlain by up to<br />
1000 -3000 m of superior reservoirs (Miyazaki & Ozmic, 1987). The reservoir quality, remoteness<br />
from CO 2 sources, and juxtaposition with more suitable storage options makes <strong>the</strong>se basins<br />
unsuitable for CO 2 storage.<br />
16
GEODISC concluded that <strong>the</strong> Drummond, Warburton and Adavale basins have little to very poor<br />
potential to sequester CO 2 , due primarily to poor reservoir quality, major faulting and <strong>the</strong> lack of<br />
predictable seal (Bradshaw et al., 2003).<br />
3.4. Galilee Basin<br />
The Galilee Basin is a significant geological feature of central Queensland, covering an area of<br />
approximately 247,000 km 2 (Hawkins et al., unpublished) and measuring approximately 700 km<br />
north–south and 520 km east–west (Hawkins et al., 1978; Figure 3.3). Three main depocentres - <strong>the</strong><br />
Koburra Trough (east), <strong>the</strong> Lovelle Depression (west) and <strong>the</strong> sou<strong>the</strong>rn Galilee Basin<br />
(south) - contain up to 3000 m, 730 m, and 1400 m of Late Carboniferous to Middle Triassic<br />
sedimentary rocks, respectively (Jackson et al.,1981; Hawkins, unpublished). Most of <strong>the</strong> structures<br />
in <strong>the</strong> basin are low amplitude and are <strong>the</strong> result of reactivation of older basement faults penetrating<br />
<strong>the</strong> underlying Drummond and Adavale basins. Tectonic events were dominantly compressional<br />
resulting in uplift and erosion of parts of <strong>the</strong> basin during <strong>the</strong> Permian and Triassic. The Eromanga<br />
Basin, is up to 1200 m thick and overlies <strong>the</strong> Galilee Basin. A regional southwesterly tilt was<br />
associated with <strong>the</strong> collision of <strong>the</strong> Australian and PNG plates (Home et al.,1990).<br />
Sedimentation in <strong>the</strong> Galilee Basin was dominated by fluvial to lacustrine (and in part glacial)<br />
depositional systems. This resulted in a sequence of sandstones, mudstones, siltstones, coals and<br />
minor tuff in what was a relatively shallow intracratonic basin. The entire Galilee sequence is<br />
saturated with potable water in both <strong>the</strong> Permian and Triassic strata with probable recharge from <strong>the</strong><br />
nor<strong>the</strong>ast into <strong>the</strong> outcropping Triassic reservoirs. Sediment provenance is variable and includes<br />
recycled older sedimentary, metamorphic, granitic, volcanic and tuffaceous rocks. The climate has<br />
varied from glacial to warm and back to temperate during deposition of Galilee Basin sediments.<br />
Forty years or more of exploration in <strong>the</strong> Galilee Basin has failed to discover any economic<br />
accumulations of hydrocarbons, despite <strong>the</strong> presence of apparently good to very good reservoirs and<br />
seals, in both <strong>the</strong> Permian and Triassic sequence. Vitrinite reflectance values indicate that <strong>the</strong> basin<br />
has previously reached <strong>the</strong>rmal maturity for hydrocarbon generation.<br />
The presence of oil and gas shows indicate some sort of petroleum charge mechanism existed in <strong>the</strong><br />
area. The absence of economic hydrocarbon accumulations could be attributed to (among o<strong>the</strong>r<br />
factors) an absence of a significant volume of suitable source rock and / or incompatible timing<br />
between hydrocarbon generation and <strong>the</strong> formation of structural traps. Although exploration<br />
interest in <strong>the</strong> basin has waned, some exploration for coal seam methane continues in some areas.<br />
A preliminary review of <strong>the</strong> Galilee Basin data indicates that it has potential to store CO 2 .<br />
Several formations and areas contain sandstones with good porosity and permeability<br />
characteristics. Several sealing lithologies exist within <strong>the</strong> Galilee Basin, however sealing capacity<br />
over geological time remains unproven due to a lack of hydrocarbon accumulations. Potential<br />
stratigraphic and hydrodynamically assisted stratigraphic traps have been identified in some areas.<br />
A thorough regional geological study is currently underway to assess <strong>the</strong> quality of <strong>the</strong> basin for<br />
CO 2 storage, estimate storage capacity, and investigate in detail issues such as <strong>the</strong> extent and<br />
presence of <strong>the</strong> large fresh water resource.<br />
The GEODISC project concluded that, <strong>the</strong> Galilee Basin has good potential to sequester CO 2 within<br />
hydrodynamic/stratigraphic traps. Potential dry structures are not considered a viable sequestration<br />
option due to small storage capacity (Bradshaw et al., 2003).<br />
3.5. Bowen Basin<br />
This study focuses on <strong>the</strong> Wunger Ridge area in <strong>the</strong> Bowen Basin. During an initial overview of <strong>the</strong><br />
Bowen Basin it became apparent that <strong>the</strong>re was a need to clearly define <strong>the</strong> sedimentary units within<br />
<strong>the</strong> Bowen Basin as many different lithological names have been applied to sedimentary units<br />
17
deposited over <strong>the</strong> same time period. Over 50 publications, 100’s of well completion <strong>report</strong>s and<br />
more than 50 stratigraphic charts were used to produce a basin wide stratigraphic correlation and<br />
interpreted environment chart based on facies (Appendix 10.1- autho-stratigraphic chart).<br />
Coal industry lithological terms were excluded as <strong>the</strong> use of <strong>the</strong>se is predominantly restricted to<br />
shallow parts of <strong>the</strong> basin.<br />
This chart (Appendix 10.1) was used in conjunction with detailed log and seismic interpretation to<br />
summarise <strong>the</strong> basin stratigraphy and interpret genetic stratigraphic relationships across <strong>the</strong> basin.<br />
These relationships assisted in <strong>the</strong> development of an exploration model to determine <strong>the</strong> extent,<br />
location and heterogeneity of key reservoirs, seals and potential CO 2 migration pathways.<br />
Figure 3. 3. Basic elements of <strong>the</strong> Galilee Basin.<br />
The Permo-Triassic Bowen Basin is a large (200,000 km 2 ) asymmetric elongate feature. The basin<br />
consists of a thick rift-sag-foreland basin succession formed within two main depocentres, <strong>the</strong><br />
Denison and Taroom troughs. These troughs were identified during <strong>the</strong> initial overview as suitable<br />
for <strong>the</strong> injection and storage of CO 2 during an Australia wide CO 2 storage review undertaken as part<br />
of <strong>the</strong> GEODISC program (Bradshaw et al., 2003).<br />
18
The Denison Trough is a western extension of <strong>the</strong> Bowen Basin. The Trough contains up to 6500 m<br />
of preserved terrestrial and marine clastic rocks that are Permian–Triassic in age (Brown et al.,<br />
1983). Reservoir–seal pairs are well developed within <strong>the</strong> Early Permian sag phase succession of<br />
<strong>the</strong> Denison Trough (Figure 3.4) and provide several potential intervals for geological storage of<br />
CO 2 . Reservoir quality is generally good depending on facies type but also varies considerably due<br />
to modification by diagenetic processes such as <strong>the</strong> infilling of pores by clays and silica cement.<br />
Late Permian coals extend across <strong>the</strong> Trough providing a reliable seismic mapping marker and <strong>the</strong>se<br />
coals are exploited by various companies at <strong>the</strong> margin of <strong>the</strong> Trough. The Trough is extensively<br />
structured and contains several north–south trending grabens which were deformed during <strong>the</strong> Late<br />
Triassic into fault-propagated anticlines (Figure 3.5). These features provide structural traps that in<br />
most cases are filled to spill with hydrocarbons (Brown et al., 1983). The Denison Trough is a<br />
relatively mature hydrocarbon province with several producing fields, some potentially nearing <strong>the</strong><br />
end of production. Depleted gas fields are thus a potential option for geological storage of CO 2 .<br />
O<strong>the</strong>r options such as dry structures, hydrodynamic trapping and regional sub-crop will be of higher<br />
risk given <strong>the</strong> extensive faulting and containment issues.<br />
The Taroom Trough is <strong>the</strong> largest depocentre in <strong>the</strong> Bowen Basin with up to 9000 m of Permian and<br />
Triassic sediments (Figures 3.4 and 3.6). The Permian aged strata in <strong>the</strong> Taroom Trough are<br />
generally deeper marine facies than in <strong>the</strong> Denison Trough. During <strong>the</strong> Permian, sediments were<br />
sourced primarily from a volcanic arc located to <strong>the</strong> east of <strong>the</strong> Taroom Trough. Reservoir quality is<br />
thus poor, particularly in <strong>the</strong> east. Late Permian coals from <strong>the</strong> Baralaba Coal Measures (Bandanna<br />
Formation) extend across <strong>the</strong> Taroom Trough (Figure 3.4). Triassic strata contain several terrestrial<br />
sequences with reservoir quality sandstones overlain by regional shales. The most economically<br />
important Triassic aged sequence from <strong>the</strong> Taroom Trough occurs on <strong>the</strong> west flank within <strong>the</strong><br />
fluvial Showgrounds Sandstone that is contemporaneous with <strong>the</strong> upper part of <strong>the</strong> Clematis<br />
Sandstone. The Showgrounds Sandstone is sealed by <strong>the</strong> lacustrine Snake Creek Mudstone.<br />
Reservoir modelling conducted in this project focussed on <strong>the</strong> Triassic aged Showgrounds<br />
Sandstone and its associated seal in <strong>the</strong> Wunger Ridge area. Within <strong>the</strong> Taroom Trough, <strong>the</strong> absence<br />
of Jurassic petroleum accumulations around <strong>the</strong> Wunger Ridge area implies that <strong>the</strong> seal is suitable<br />
for geological storage of CO 2 . It was for this reason, coupled with <strong>the</strong> reservoir quality of <strong>the</strong><br />
Showgrounds Sandstone that <strong>the</strong> Wunger Ridge was selected as <strong>the</strong> focus of this study.<br />
Petroleum fields are mainly restricted to <strong>the</strong> western flank, with only a few accumulations on <strong>the</strong><br />
eastern flank (Shaw et al. 1999; eastern fields not shown in Figure 3.7). The source rock is located<br />
in <strong>the</strong> central Taroom Trough with hydrocarbons being generated within Late Permian age strata<br />
(mainly Baralaba Coal Measures and Burunga Formation; Figure 3.4), and migrating subsequently<br />
up <strong>the</strong> eastern and western flanks into structural and stratigraphic traps (Korsch et al., 1998;<br />
Cadman et al., 1998). There is a scarcity of hydrocarbon pools on <strong>the</strong> eastern flanks of <strong>the</strong> Taroom<br />
Trough, despite <strong>the</strong> presence of several large fault propagated folds forming anticlinal closures<br />
(Shaw et al., 1999). The absence of hydrocarbons in large anticlinal structures on <strong>the</strong> eastern flank is<br />
probably due to a combination of absence of a valid migration pathway, and inadequate source rock<br />
in <strong>the</strong> eastern side of <strong>the</strong> trough.<br />
Even though thick intervals of sandstone have been deposited and preserved, overall <strong>the</strong> reservoir<br />
quality is poor along <strong>the</strong> eastern flank of <strong>the</strong> Taroom Trough. This is largely due to high clay<br />
content of <strong>the</strong> deposited sediment and diagenesis. The Taroom Trough may contain dissolution,<br />
residual or stratigraphic traps along its broad downwarped geometry.<br />
In <strong>the</strong> nor<strong>the</strong>ast Bowen Basin (Nebo Synclinorium and Collinsville Shelf) Permian aged strata are<br />
highly deformed and truncated, with eroded anticline crests exposed at <strong>the</strong> surface (Figure 3.8).<br />
It is <strong>the</strong>refore highly unlikely, in <strong>the</strong> nor<strong>the</strong>rn basin area, that any CO 2 injected into <strong>the</strong> sub-surface<br />
would be contained in <strong>the</strong> long term.<br />
GEODISC concluded, <strong>the</strong> Bowen Basin has a range of different geological options for <strong>the</strong><br />
sequestration of CO 2 . The most suitable sequestration options vary depending on <strong>the</strong> volume<br />
of CO 2 to be sequestered (Bradshaw et al., 2003).<br />
19
Figure 3.4. Sequence Stratigraphy of <strong>the</strong> Bowen and Surat basins (after Korsch et al., 1998).<br />
20
Figure 3.5. Structure of <strong>the</strong> Denison Trough. Note: north–south trending grabens which were<br />
deformed during <strong>the</strong> Late Triassic into fault-propagated anticlines (After Elliot 1985).<br />
21
Figure 3.6. Key structural elements of <strong>the</strong> Taroom Trough (after Rigby, 1987).<br />
22
Figure 3.7.Schematic geological cross-section through <strong>the</strong> Roma Shelf area. Located in <strong>the</strong> western<br />
Taroom Trough showing structural relationships. The Wunger Ridge fields (right hand side) have been<br />
projected approximately 60 km north onto cross-section. The distribution of oil and gas fields is shown<br />
relative to pinchouts and erosional edges and occurs above Permian source rocks (from Cadman et al.,<br />
1998). Arrows indicate hydrocarbon migration pathways and show how hydrocarbons leak up through<br />
<strong>the</strong> formations, creating stacked accumulations.<br />
23
Figure 3.8. Geological cross-sections through <strong>the</strong> nor<strong>the</strong>rn Bowen Basin. Figure shows<br />
exhumed, highly folded and truncated Permo-Triassic strata (after Clare, 1985).<br />
3.6. Wunger Ridge – Bowen Basin.<br />
The Wunger Ridge is located on <strong>the</strong> southwestern flank of <strong>the</strong> Taroom Trough (Figure 3.6) and was<br />
chosen as <strong>the</strong> preferred site on which to produce a detailed technical geological storage assessment.<br />
The area was selected on <strong>the</strong> following basis:<br />
• proving containment in <strong>the</strong> subsurface is seen as <strong>the</strong> critical risk for <strong>the</strong> project. The regional<br />
seal has trapped hydrocarbons within a single stratigraphic unit over a geological time period<br />
of ~ 100 Ma. This is in contrast to <strong>the</strong> Roma Shelf where stacked hydrocarbon pools indicate<br />
leakage up faults that penetrate <strong>the</strong> intraformational seals.<br />
• reservoir deliverability has been demonstrated over a number of years by a number of fields.<br />
Injection testing in <strong>the</strong> Showground Sandstone in <strong>the</strong> Wunger Ridge area as opposed to o<strong>the</strong>r<br />
locations within <strong>the</strong> Bowen Basin would also provide significantly more data on <strong>the</strong> effectiveness<br />
of a regional solution. This is because results obtained from geological modelling and reservoir<br />
simulations would be transferable to several o<strong>the</strong>r areas within <strong>the</strong> Bowen Basin that have similar<br />
geological characteristics. For example, only minor changes to reservoir properties and <strong>the</strong> inclusion<br />
of fault conduits would need to be added in order to apply <strong>the</strong> Wunger Ridge model to <strong>the</strong> Roma<br />
Shelf. Data and characteristics of <strong>the</strong> Wunger Ridge area consists of;:<br />
24
• A comprehensive set of wells and seismic lines is available, providing an understanding of<br />
subsurface trends and uncertainties.<br />
• Approximately 400 m of core from 31 wells including 11 that sampled <strong>the</strong> entire<br />
Showgrounds Sandstone–Snake Creek Mudstone interval were available as geological<br />
control.<br />
• Pressure data density is good over <strong>the</strong> Wunger Ridge due to <strong>the</strong> presence of producing fields.<br />
depth is sufficient to allow injected CO 2 to remain supercritical after injection.<br />
• Long migration pathways maximise <strong>the</strong> potential for residual gas and dissolution storage<br />
mechanisms to occur.<br />
• Water quality in <strong>the</strong> Showground Sandstone unit is lower (i.e. more saline) than overlying<br />
fresh water aquifers reducing <strong>the</strong> potential for water resource conflicts.<br />
3.7. Chapter References<br />
de Boer, R.A., 1996. The integrated development of Gilmore field and an<br />
independent power plant. APPEA, 36, 117–129.<br />
Bradshaw, B., Bradshaw, J., Dance, T., Reilly, N.S., Sayers, J., Spencer, L. & Wilson, P., 2003.<br />
Geodisc ArcView GIS Version 2.01. APCRC Confidential GIS.<br />
Brakel, A.T., 1989. Calen Basin. Bureau of Mineral Resources, Geology and Geophysics Bulletin,<br />
v.231, p107–110. In Harrington H.J. & o<strong>the</strong>rs. Permian Coals of Eastern Australia, Chapter 9.<br />
National Energy Research Development and Demonstration Council, Final Report on Project<br />
78/2617.<br />
Brown, R.S., Elliot, L.G. & Mollah, R.J., 1983. Recent exploration and petroleum discoveries in <strong>the</strong><br />
Denison Trough, Queensland. Australian Petroleum Exploration Journal, 23 (1), 120–135.<br />
Cadman, S. J., Pain, L. & Vuckovic, V., 1998. Bowen and Surat Basins, Clarence–Morton Basin,<br />
Sydney Basin, Gunnedah Basin and o<strong>the</strong>r minor onshore basins, Queensland, NSW and NT.<br />
Australian Petroleum Accumulations Report 11, Bureau of Resource Sciences, Canberra.<br />
Clare, R., 1985. Structure of <strong>the</strong> nor<strong>the</strong>rn Bowen Basin. The GSA Coal Geology Group, Bowen<br />
Basin Coal Symposium, November 1985.<br />
Day, R.W., Whitaker, W.G., Murray, C.G., Wilson, I.H. & Grimes, K.G., 1983.<br />
Queensland Geological Survey Publication 383 — Queensland Geology, A companion volume to<br />
<strong>the</strong> 1:2 500 000 scale geological map (1975). S.R. Hampson, Government Printer Queensland.<br />
Denaro, T.J. & Shield, C.J., 1993. Coal and petroleum exploration, Cape York<br />
Peninsula: Queensland. Department of Mines and Energy, Geological Record 1993/15, pp104.<br />
Enever, J.R., 1990. In Situ stress measurements in <strong>the</strong> Bowen Basin and <strong>the</strong>ir implications for coal<br />
mining and methane extraction. in The GSA Queensland Division, Bowen Basin Coal Symposium,<br />
September 1990.<br />
Elliot, L., 1985. The stratigraphy of <strong>the</strong> Denison Trough. The GSA Coal Geology Group, Bowen<br />
Basin Coal Symposium, November 1985.<br />
Green, P. M. & McKellar, J. L., 1996. Relationships between Latest Triassic–Early Cretaceous<br />
strata in <strong>the</strong> Clarence–Moreton, Surat and Eromanga Basins. Queensland Government Mining<br />
Journal, December. Pg. 67–71.<br />
Hawkins, P.J., 1978. Galilee Basin — Review of Petroleum Prospects. Queensland<br />
Government Mining Journal, February 1978, pp 96–112.<br />
25
Hawkins, P.J., Gray, A.R.G., Brain, T.J. & Scott, S.G. (unpublished). Geology and<br />
Resource Potential of <strong>the</strong> Nor<strong>the</strong>rn Galilee Basin. Obtained from Qld Dept of Mines.<br />
Hill, P.J., 1994. Geology and Geophysics of <strong>the</strong> offshore Maryborough Basin,<br />
Capricorn and nor<strong>the</strong>rn Tasman Basins: Results of AGSO Survey 91. AGSO Record, 1994/1, pp71.<br />
Home, P. C., Dalton D. G. & Brannan, J., 1990. Geological evolution of <strong>the</strong> Western Papuan Basin,<br />
in G. J. Carman and Z. Carman, ed., Petroleum Exploration in Papuan New Guinea: Proceedings of<br />
<strong>the</strong> First Papua New Guinea Petroleum Convention, Port Moresby, 12–14 th February 1990, Papua<br />
New Guinea Chamber of Mines and Petroleum, p. 107–119.<br />
Jackson, K.S., Horvath, Z. & Hawkins, P.J., 1981. An assessment of <strong>the</strong> petroleum prospects for <strong>the</strong><br />
Galilee Basin, Queensland. The APEA Journal, v. 21, 1, pp 172–186.<br />
Kalinowski A. & Newlands, I. 2005. The Galilee Basin, A big opportunity?, Cooperative Research<br />
Centre for Greenhouse Gas Technologies, Barossa Valley Symposium Nov–Dec 2005 (poster,<br />
unpublished, confidential to <strong>CO2CRC</strong>).<br />
Korsch, R.J., Boreham, C.J., Totterdell, J.M., Shaw, R.D. & Nicoll, M.G., 1998. Development and<br />
petroleum resources of <strong>the</strong> Bowen, Gunnedah and Surat Basins, Eastern Australia. APPEA Journal,<br />
pp199–237.<br />
Malone, E.J., Olgers, F., Kirkegaard, A.G., 1969. The geology of <strong>the</strong> Duaringa and Saint<br />
Lawrence 1:250 000 Sheet areas, Queensland Bureau of Mineral Resources, Australia, Report 121.<br />
Miyazaki, S. & Ozimic, S., 1987. Adavale Basin, Queensland, Australian<br />
Petroleum Accumulations <strong>report</strong>, Australian Bureau of Mineral Resources, Geology and<br />
Geophysics, pp 20.<br />
O’Brien, P.E., Powell, T.G. & Wells, A.T., 1994. Petroleum potential of <strong>the</strong><br />
Clarence–Moreton Basin. In: Wells, A.T., and O’Brien, P.E., (eds) Geology and Petroleum<br />
Potential of <strong>the</strong> Clarence–Moreton Basin, New South Wales and Queensland. Australian Geological<br />
Survey Bulletin 241.<br />
Petroleum Resources Assessment and Development Sub-program (P.R.A.D.S),<br />
1990, Petroleum Resources of Queensland (Review to June 30, 1989). Queensland Resource<br />
Industries Review Series. Department of Resource Industries, Queensland.<br />
Radke, B. M., Ferguson, J., Cresswell, R. G., Ransley, T. R. & Habermehl, M. A., 2000.<br />
Hydrochemistry and implied hydrodynamics of <strong>the</strong> Cadna-owie–Hooray Aquifer, Great Artesian<br />
Basin, Australia. Bureau of Rural Sciences, Canberra.<br />
Rigby, S.M., 1987. Murilla Creek — An Untested stratigraphic Play in <strong>the</strong> Surat Basin, The<br />
Australia Petroleum Exploration Association Journal (APEA), 27 (1), pp. 230–245.<br />
Russell, N.J., 1994. A palaeogeo<strong>the</strong>rmal study of <strong>the</strong> Clarence–Moreton Basin.<br />
In: Wells, A.T., and O’Brien, P.E., (eds) Geology and Petroleum Potential of <strong>the</strong> Clarence–Moreton<br />
Basin, New South Wales and Queensland. Australian Geological Survey Bulletin 241.<br />
Santos, 2005. http://www.santos.com.au/Content.aspx?p=2268.<br />
Shaw, R.D., Korsch, R.J., Boreham, C.J., Totterdell, J.M., Lelbach, C. & Nicoll, M.G., 1999.<br />
Evaluation of <strong>the</strong> undiscovered hydrocarbon resources of <strong>the</strong> Bowen and Surat Basins, sou<strong>the</strong>rn<br />
Queensland. AGSO Journal of Australian Geology and Geophysics, 17 (5/6), pp 43–65.<br />
Thompson, P.S., 1987. Petrological and Petrophysical data from Mesozoic<br />
26
sandstone of <strong>the</strong> Bundamba Group, Clarence–Moreton Basin. Bureau of Mineral Resources,<br />
Geology and Geophysics Record 1987/8.<br />
Wellman, P., 1995. The Lakefield Basin; A new Permian Basin in far north<br />
Queensland. Queensland Government Mining Journal, 96; pp 19–23.<br />
27
4. Geological and Geophysical Datasets<br />
4.1. Geological data<br />
Initial geological data compilation included petroleum, coal seam methane, water and Geological<br />
Survey of Queensland (GSQ) stratigraphic wells. This project almost exclusively used petroleum<br />
well data as it was <strong>the</strong> most suitable to assess <strong>the</strong> subsurface geology for <strong>the</strong> injection and storage of<br />
CO 2 . A comprehensive quality control was carried out on <strong>the</strong> well location in order to maintain<br />
confidence in <strong>the</strong> geological interpretation (Appendix 10.6.1).<br />
From <strong>the</strong> petroleum well database of approximately 4000 wells, a subset of approximately 600<br />
wells was utilised (Figure 4.1.; see Appendix 10.6.1 for well list). Wells were included in this subset<br />
if <strong>the</strong> well:<br />
• penetrated a depth greater than <strong>the</strong> 800 m required for supercritical storage of CO 2 ;<br />
• could be integrated into a digital dataset. The electrical log dataset was obtained from <strong>the</strong><br />
Queensland Department of Natural Resources, Mines and Energy (QDNRME);<br />
• was perceived as critical to <strong>the</strong> understanding of <strong>the</strong> area (i.e. wells in key areas, or well-tie<br />
to seismic lines), and<br />
• additional wells were added in areas lacking sufficient data to make a realistic assessment.<br />
Once <strong>the</strong> key wells had been selected, all <strong>the</strong> available data associated with <strong>the</strong>se wells was<br />
collected and examined, including:<br />
• well completion <strong>report</strong>s acquired from QDNRME QDEX (Queensland digital exploration)<br />
database;<br />
• approximately 400 wireline logs from QDNRME and approximately 20 wireline logs were<br />
hand digitised, and<br />
• approximately 60 drillcores from Geoscience Australia’s and QDNRME’s core stores.<br />
Cross examination of <strong>the</strong> location of many of <strong>the</strong> wells selected from QDNRME’s database with a<br />
database at Geoscience Australia indicated that many wells had a significant discrepancy in<br />
geographic location, with some wells plotting up to 100 km apart. It was decided to examine all of<br />
<strong>the</strong> 600 wells in <strong>the</strong> dataset and compare <strong>the</strong> location with that <strong>report</strong>ed in <strong>the</strong> well completion<br />
<strong>report</strong>. Many wells were found to have location errors, in particular <strong>the</strong> geographical datum in many<br />
of <strong>the</strong> wells had been entered incorrectly, causing many of <strong>the</strong> location errors seen, and to a lesser<br />
extent key stroke error was also responsible.<br />
To prevent repeating work that had previously been conducted, formation tops were acquired from a<br />
CD produced by <strong>the</strong> QDNRME / Geological Survey of Queensland (GSQ) Geoscience Data<br />
Queensland Petroleum Geoscience Data. This CD contained a database with <strong>the</strong> GSQ formation<br />
picks and ano<strong>the</strong>r database with <strong>the</strong> formation picks <strong>the</strong> operator submitted with <strong>the</strong> well<br />
completion <strong>report</strong>. These two databases were compared and a preferred formation picks set was<br />
obtained from both sets. The lithostratigraphic tops were subsequently normalised into a single<br />
“pseudo-sequence” stratigraphic name using <strong>the</strong> autho-stratigraphic chart of <strong>the</strong> Bowen Basin<br />
(Appendix 10.1). The Wunger Ridge area picks were <strong>the</strong>n checked against <strong>the</strong> composite log with<br />
specific attention to <strong>the</strong> Showgrounds Sandstone, Snake Creek Mudstone and Rewan Formation.<br />
28
Figure 4.1. Location of all wells used in <strong>the</strong> assessment of <strong>the</strong> Bowen Basin study<br />
areas See Appendix 10.6.1 for a <strong>full</strong> list of wells used.<br />
29
Figure 4.2. Location of core samples examined in <strong>the</strong> greater Wunger Ridge area. See also Figure 2.1c for<br />
location relative to <strong>the</strong> Bowen Basin.<br />
4.2. Geophysical data<br />
Datasets available for <strong>the</strong> seismic interpretation are listed below.<br />
• Reflection seismic data were available in printed format, mostly as final stacks with<br />
occasional migrated stacks. The seismic data used was normal polarity (Australian standard,<br />
reverse USA) producing a peak (right hand deflection) as <strong>the</strong> seismic wave moves from high<br />
to low velocity material (e.g. sandstone/shale to coal). The data was provided by <strong>the</strong><br />
QDNRME in Brisbane as TIFF images. No data in <strong>the</strong> area were available in SEGY format<br />
at <strong>the</strong> time of request. The data are generally poor-to-average in areas of high density<br />
faulting and <strong>the</strong> resolution is low as all data used was recorded between 1979 and 1992.<br />
Modern seismic surveys have a shorter shotpoint interval and hence show increased<br />
resolution.<br />
• A seismic line location file was provided by <strong>the</strong> QDNRME in ASCII format and was loaded<br />
into <strong>the</strong> Petrosys TM mapping software as Australian Geodetic Datum 1966 (AGD66), later<br />
converted to Geocentric Datum of Australia 1994 (GDA94).<br />
• Syn<strong>the</strong>tic seismograms were available for about 10 % of <strong>the</strong> wells used. The time needed to<br />
make o<strong>the</strong>r syn<strong>the</strong>tic seismograms was thought unwarranted in view of <strong>the</strong> objectives and<br />
<strong>the</strong> overall time constraints on <strong>the</strong> project.<br />
• Time-depth data from well completion <strong>report</strong>s were available for a large percentage of <strong>the</strong><br />
wells in various forms and at various levels of accuracy (e.g. time-depth plots and tables)<br />
• Potential field (TIFF) images were available but were considered to have insufficient<br />
resolution. Details for individual lines and surveys can be found in Appendix 10.6.6.<br />
30
5. Bowen Basin Summary Reviews<br />
5.1. Introduction<br />
During <strong>the</strong> early stages of <strong>the</strong> state wide review of potential storage sites within Queensland, it<br />
became apparent that <strong>the</strong> CO 2 storage site options with <strong>the</strong> greatest potential were located in <strong>the</strong><br />
western Bowen Basin (e.g. Denison Trough, Roma Shelf and Wunger Ridge). The review<br />
concluded that <strong>the</strong> site with <strong>the</strong> most significant storage potential coupled with comparatively<br />
low geological risk was in <strong>the</strong> Wunger Ridge area. At <strong>the</strong> Wunger Ridge, an assessment of <strong>the</strong><br />
Showgrounds Sandstone and Snake Creek Mudstone reservoir/seal pair indicated excellent seal<br />
characteristics with good lateral extent. Liquid and gaseous hydrocarbons have been exploited<br />
along <strong>the</strong> ridge for approximately 26 years with generally very good recovery implying good<br />
reservoir connectivity at <strong>the</strong> field scale in a number of areas.<br />
Initially, <strong>the</strong> risk factors were considered to be:<br />
• low reliability of structural maps due to unavailability of digital seismic data;<br />
• <strong>the</strong> unavailability of production pressure data for fields, which could be used to evaluate <strong>the</strong><br />
state of depletion of a field and hence <strong>the</strong> potential availability of that field for CO 2 storage;<br />
• <strong>the</strong> Showgrounds Sandstone formation water: this water is usable, at least for <strong>the</strong> watering<br />
of stock. Injection of CO 2 into this formation could pose a conflict of use as well as<br />
generational legacy issues, as <strong>the</strong> water resource could be sterilised;<br />
• this area is currently explored and exploited for hydrocarbons which also raises <strong>the</strong> potential<br />
for a resource conflict. The effect, positive or negative of re-pressuring a regional area was<br />
unknown, and<br />
• <strong>the</strong> thickness of <strong>the</strong> reservoir, as it is comparatively thin (i.e. < 17 m).<br />
Due to <strong>the</strong> proximity of <strong>the</strong> eastern parts of <strong>the</strong> Bowen Basin to coal-fired power stations as well<br />
as o<strong>the</strong>r factors, a number of o<strong>the</strong>r areas (i.e. east Bowen Basin, sou<strong>the</strong>ast Bowen Basin, Denison<br />
Trough, Roma Shelf) in <strong>the</strong> basin have, as previously stated, undergone a review at <strong>the</strong> reservoir<br />
scale.<br />
5.2. Denison Through Study Area<br />
The Denison Trough is located in <strong>the</strong> northwest Bowen Basin. The basin is comparatively close<br />
to <strong>the</strong> Rockhampton–Gladstone region, an area that could evolve as a major emissions hub<br />
(i.e. servicing 49 % of Queensland’s total stationary CO 2 emissions; Figure 2.1a). The Denison<br />
Trough was subject to a review to investigate <strong>the</strong> nature and number of CO 2 storage site options<br />
(Appendix 10.2). The results are summarised below.<br />
Reservoir analysis and production data indicate that <strong>the</strong> Ca<strong>the</strong>rine Sandstone and Aldebaran<br />
Sandstone are <strong>the</strong> most prospective units. Reservoir quality has restricted <strong>the</strong> Aldebaran<br />
Sandstone’s suitability for injection and storage of CO 2 to isolated narrow regions around existing<br />
hydrocarbon fields. Areas where hydrocarbons are unable to be produced have been assessed as<br />
having significantly increased injectivity and storage risk due to very low porosity and permeability<br />
(e.g. <strong>the</strong> Warrinilla Field). The Ca<strong>the</strong>rine Sandstone is similarly restricted, with erosion limiting seal<br />
coverage. As a result, only one area has been identified where <strong>the</strong> Ca<strong>the</strong>rine Sandstone and<br />
Aldebaran Sandstone can be targeted simultaneously (i.e. Springsure Anticline- Figure 3.5).<br />
The use of depleted fields for <strong>the</strong> storage of CO 2 in <strong>the</strong> Denison Trough has some associated volume<br />
risks due to <strong>the</strong> fault-bounded nature of <strong>the</strong> lowest known hydrocarbon accumulations in <strong>the</strong> fields.<br />
Hydrocarbon pools are mostly limited by north–south striking faults, although west-to-east faults<br />
exist in some areas. A detailed geomechanical study would be required if <strong>the</strong> Denison Trough<br />
depleted fields option was to be explored fur<strong>the</strong>r.<br />
31
A four year demonstration site for carbon capture and storage (CCS) technology, located<br />
approximately 200 km east of <strong>the</strong> Denison Trough, with an annual CO 2 output of 75 000 tonnes has<br />
previously been proposed (Spero, 2005). There are 11 fields within <strong>the</strong> Denison Trough which have<br />
an equal or greater storage potential than <strong>the</strong> projected CO 2 volume produced. Four of <strong>the</strong>se fields<br />
could have 12 years of storage potential, with two of those having more than forty years of storage<br />
potential for this scale of project. However, it should be noted that <strong>the</strong> fields are all currently in<br />
production, and as such, are most likely unavailable for use as CO 2 storage sites at <strong>the</strong> present time.<br />
A second proposal indicated a possible 25 year project (Sayers et al., 2006) with a CO 2 output of<br />
approximately 1.2 million tonnes per annum (Mt/y) for a total storage volume of 30 Mt. The entire<br />
Denison Trough CO 2 equivalent volume produced from fields is approximately 14.9 Mt,<br />
representing less than thirteen years storage.<br />
The Denison Trough <strong>the</strong>refore appears to offer many years of potential storage in depleted fields for<br />
a small scale demonstration CCS projects. However, higher risk storage and injection scenarios in<br />
low permeability rocks could be investigated to accommodate <strong>the</strong> storage capacity required for<br />
larger CCS projects (Sayers et al, 2006).<br />
5.3. East Bowen Basin Study Area – Burunga Anticline / Dulucca<br />
Area<br />
This project assessed <strong>the</strong> CO 2 storage potential of sites close to stationary CO 2 sources in <strong>the</strong> east<br />
Bowen Basin, Queensland (Figure 2.1b; Appendix 10.3). The Flat Top Formation within <strong>the</strong><br />
Burunga Anticline and <strong>the</strong> Showgrounds Sandstone within <strong>the</strong> Trelinga structure (Dulucca area),<br />
were <strong>the</strong> primary focus of <strong>the</strong> investigation.<br />
The project involved:<br />
• a sedimentary basin analysis, involving <strong>the</strong> analysis and interpretation of 12 composite well<br />
logs and 14 well completion <strong>report</strong>s;<br />
• a paleogeographic reconstruction and <strong>the</strong> assessment of <strong>the</strong> suitability of reservoir sand and<br />
overlying seal units;<br />
• a petrophysical evaluation, and<br />
• a seismic interpretation of 40 sections to assess structural form and trends.<br />
The <strong>report</strong> concluded that both <strong>the</strong> Showgrounds Sandstone and <strong>the</strong> Flat Top Formation possess<br />
negligible storage potential in this region of <strong>the</strong> Bowen Basin. The Flat Top Formation is a highly<br />
variable lithological unit with low net-to-gross sandstone and poor porosity–permeability<br />
correlation within individual facies. Hence, <strong>the</strong> predictability of reservoir quality in this unit is low.<br />
The Showgrounds Sandstone, also has poor reservoir quality, is truncated by <strong>the</strong> (basal) Surat Basin<br />
unconformity and overlain by <strong>the</strong> fresh water bearing sandstone units of <strong>the</strong> Great Artesian Basin.<br />
A sealing unit is absent so that CO 2 injected into <strong>the</strong> Showgrounds Sandstone could potentially<br />
migrate directly into <strong>the</strong> overlying fresh water aquifer. Both <strong>the</strong> Flat Top Formation and<br />
Showgrounds Sandstone are <strong>the</strong>refore considered to have significant reservoir and seal risk.<br />
The only alternative reservoir in <strong>the</strong> area is <strong>the</strong> Precipice Sandstone, a fresh water aquifer within <strong>the</strong><br />
eastern Surat Basin. Whilst <strong>the</strong> Precipice Sandstone possesses significant storage potential, injecting<br />
CO 2 into <strong>the</strong> Precipice Sandstone would, as already stated, sterilise <strong>the</strong> fresh water resource from<br />
future use so that using this aquifer for geological storage is not considered a viable option at<br />
present.<br />
32
5.4. Sou<strong>the</strong>ast Bowen Basin Study Area<br />
The sou<strong>the</strong>ast Bowen Basin is in close proximity to a number of power stations and population<br />
centres and <strong>the</strong>refore may be a practical option for CO 2 storage for sou<strong>the</strong>ast Queensland.<br />
Regional reconnaissance work was carried out in <strong>the</strong> sou<strong>the</strong>ast Bowen Basin to assess <strong>the</strong> CO 2<br />
storage potential of <strong>the</strong> area (Figure 2.1c; Appendix 10.4). This area was considered for a number of<br />
reasons including:<br />
• <strong>the</strong> presence of known hydrocarbon accumulations in <strong>the</strong> Cabawin oil field indicates that<br />
long term storage of fluids has occurred at a local scale;<br />
• <strong>the</strong> reservoirs are located deep enough to contain CO 2 in its supercritical phase;<br />
• targeting <strong>the</strong> oil migration pathway which may have preserved porosity would provide<br />
enough distance to allow for a significant proportion of <strong>the</strong> injected volume of CO 2 to be<br />
trapped residually in saline groundwater, and<br />
• <strong>the</strong> availability of well and seismic data.<br />
Sixteen wells, distributed along a north–south line, and six seismic sections, located towards <strong>the</strong><br />
sou<strong>the</strong>rn end of <strong>the</strong> study area (Figures 5.1–5.2), were investigated to assess <strong>the</strong> potential of Triassic<br />
and Permian sandstones to store CO 2 . Only formations older than <strong>the</strong> Jurassic Precipice Sandstone<br />
were examined. The Precipice Sandstone, although a good reservoir sandstone, is a significant fresh<br />
water aquifer, as previously discussed, and was <strong>the</strong>refore not considered for assessment.<br />
5.4.1. Well Data and Result<br />
The preliminary assessment was made from well logs, with <strong>the</strong> horizons being identified where<br />
possible in each well (Table 5.1). The base of <strong>the</strong> Precipice Sandstone represents <strong>the</strong> Triassic–lower<br />
Jurassic unconformity. The top of <strong>the</strong> Permian section, usually defined by <strong>the</strong> first appearance of a<br />
series of coals below <strong>the</strong> Base Jurassic unconformity, was only <strong>full</strong>y penetrated in a few wells,<br />
meaning geological assessment was not possible over much of <strong>the</strong> study area. Basement which is<br />
penetrated only by <strong>the</strong> few deepest wells, is typically volcanic in nature.<br />
Permian and Triassic sandstones were identified from wireline logs in <strong>the</strong> following wells: Undulla-<br />
1 (Kianga and Back Creek Formations), Alick Creek-1 (Blackwater and Back Creek Groups, Buffel<br />
Formation), and Cabawin-1 (Cabawin and Kianga formations; Table 5.1). These sandstones were<br />
investigated for reservoir potential using <strong>the</strong> well logs and well completion <strong>report</strong>s including (where<br />
available) descriptions of core, side-wall core, cuttings, porosity and permeability data, and<br />
company <strong>report</strong>s. Apart from <strong>the</strong> section penetrated in Cabawin-1, which is discussed below, no<br />
reservoirs suitable for CO 2 storage were found. Reasons for this include:<br />
• <strong>the</strong> absence of porosity and permeability due to <strong>the</strong> presence of a clay and tuffaceous matrix<br />
and / or cementation processes (calcareous, pyritic, or silicic) or silicification. The immature<br />
volcano-lithic sandstones containing a large tuffaceous component, as well as coaly and<br />
carbonaceous material, all of which might react with injected CO 2 ;<br />
• <strong>the</strong> limited lateral and vertical extent of sandstones resulting in small potential storage<br />
volumes, and<br />
• <strong>the</strong> absence of a vertical seal.<br />
33
Table 5.1. Preliminary assessment of wells of <strong>the</strong> sou<strong>the</strong>ast Bowen Basin area.<br />
Well<br />
(north-to-south)<br />
Base of<br />
Precipice<br />
Sandstone (m)<br />
Top of<br />
Permian<br />
Section (m)<br />
Triassic<br />
Reservoir<br />
Potential?<br />
Permian<br />
Reservoir<br />
Potential?<br />
Juandah-1 1457 1994 No No<br />
Gurulmundi-1 1250 Not enough data No No<br />
Dulacca-1 1629 Not enough data Not enough data Not enough data<br />
Auburn-1 1618.5 Not enough data Not enough data Not enough data<br />
Miles-1 1228 Not enough data Not enough data Not enough data<br />
Columboola-1 1167 1185 No Not enough data<br />
Tey-1 1626 1626 No Not enough data<br />
Bennett-1 1714.5 1716 No Not enough data<br />
Undulla-1 1725 1737 No Minor Potential<br />
Leichhardt-1 1771 1790 No Not enough data<br />
Alick Creek-1 Not present 1640 No Minor Potential<br />
Tara-1 Not present 1639 No Not enough data<br />
Cabawin East-1 2384 3194 No Not enough data<br />
Cabawin-1 2326 3007 Minor Potential Minor Potential<br />
Tartha-1 2185 Not enough data No Not enough data<br />
Southwood-1 2082 2249 No No<br />
Cabawin-1 is <strong>the</strong> only well to have intersected a significant hydrocarbon accumulation. There are<br />
several potential sandstone–conglomerate reservoir intervals in <strong>the</strong> Triassic section of <strong>the</strong> well,<br />
which are thicker here than in any o<strong>the</strong>r part of <strong>the</strong> study area (Figure 5.1). These intervals have<br />
better porosity and permeability characteristics than o<strong>the</strong>rs in <strong>the</strong> study area, and are generally<br />
composed of quartz and chert pebbles with minor ash. However, <strong>the</strong>re is doubt about <strong>the</strong> volume<br />
of CO 2 that could be injected since <strong>the</strong>se sandstones have not been intersected in off-set wells.<br />
There are no obvious regional sealing units in this area, however a thickness of poor quality<br />
(in terms of reservoir) Triassic sequence could act as a significant baffle to vertical migration.<br />
Figure 5.1. Generic geological cross-section of <strong>the</strong> sou<strong>the</strong>ast Bowen Basin area. The cross-section shows<br />
distribution and thickness of Permian and Triassic sediments from north-to-south in <strong>the</strong> sou<strong>the</strong>ast Bowen Basin.<br />
Wells from north-to-south: Juandah-1 (also representing Gurulmundi-1, Dulacca-1, Auburn-1), Columboola-1<br />
(also representing Miles-1), Undulla-1 (also representing Tey-1, Bennet-1, Leichhardt-1), Alick Creek-1 (also<br />
representing Tara-1), Cabawin East-1, Cabawin-1, Tartha-1, Southwood-1.<br />
34
5.4.2. Seismic Data<br />
Seven horizons (Orallo Formation, Walloon Coal Measures, Moolayember Formation, Snake Creek<br />
Mudstone, Showgrounds Sandstone, Top of Permian, and Basement) were interpreted (where<br />
possible) on seismic lines H79-3, H79-7, H79-9, H79-12, T82CW5, and T82CW16, all located<br />
within <strong>the</strong> sou<strong>the</strong>rn part of <strong>the</strong> study area (Figure 5.2). Horizons were initially interpreted from well<br />
logs. The top of <strong>the</strong> Permian and <strong>the</strong> Walloon Coal Measures are generally easy to pick and are <strong>the</strong><br />
most consistent reflectors as both are represented by <strong>the</strong> top-most of a series of strongly–reflecting<br />
coals. The Orallo Formation, Snake Creek Formation and Basement were more difficult to pick.<br />
The Orallo Formation appears to be a fairly subtle horizon; <strong>the</strong> Snake Creek Mudstone was not<br />
recognised on well logs and <strong>the</strong>refore could not be tied to <strong>the</strong> seismic sections; and few wells were<br />
deep enough to intersect basement. The basement is difficult to recognise without well control as it<br />
does not appear to be consistent in character on <strong>the</strong> seismic lines and is structurally more complex<br />
than <strong>the</strong> overlying formations. The Moolayember Formation and Showgrounds Sandstone are<br />
absent on <strong>the</strong> highs, possibly due to:<br />
• erosion as suggested by truncated seismic horizons and a thinner Permian sequence in some<br />
cases;<br />
• or non-deposition as suggested in o<strong>the</strong>r areas by onlap onto <strong>the</strong> structural high, or<br />
• <strong>the</strong> facies was not recognised due to changes in sediment provenance and local control on<br />
accommodation space.<br />
Conceptually, a potential storage site within <strong>the</strong> Triassic Showgrounds Sandstone/Clematis<br />
Sandstone or Moolayember Formation may exist in <strong>the</strong> axis of <strong>the</strong> Taroom Trough to <strong>the</strong> west of<br />
<strong>the</strong> sou<strong>the</strong>ast Bowen Basin area. However, <strong>the</strong> complete absence of well control would require a<br />
substantial financial investment to be made to prove or disprove storage potential.<br />
Figure 5.2. Seismic lines used in <strong>the</strong> sou<strong>the</strong>ast Bowen Basin study area.<br />
The circled area is a structural high; <strong>the</strong> area to <strong>the</strong> west and south is <strong>the</strong><br />
Taroom Trough containing a thicker preservation of <strong>the</strong> sedimentary sequence.<br />
35
5.5. Roma Shelf Study Area<br />
The Roma Shelf is located on <strong>the</strong> western edge of <strong>the</strong> Permo–Triassic Bowen Basin, between 200<br />
and 500 km from sou<strong>the</strong>ast Queensland power stations (Figure 2.2). The Roma Shelf is a mature<br />
hydrocarbon province with approximately 131 million–barrels of oil equivalent hydrocarbons and<br />
water produced to 2002 (~ 59 Mt CO 2 equivalent).<br />
Hydrocarbon accumulations on <strong>the</strong> Roma Shelf are spread out over 100 km and found within small<br />
fault limited traps, typically within stacked reservoirs of <strong>the</strong> Permian–Triassic Bowen and Jurassic<br />
Surat basins (part of <strong>the</strong> Great Artesian Basin). The stacked nature of reservoir pools suggests that<br />
migrating hydrocarbons filled <strong>the</strong> lowest available porous sandstone (at <strong>the</strong> lowest closing contour),<br />
<strong>the</strong>n migrated vertically to overlying formations via fault conduits. This process repeated creating<br />
stacked hydrocarbon accumulations until <strong>the</strong> peak of generation had passed and/or hydrocarbons<br />
reached <strong>the</strong> fresh water aquifer of <strong>the</strong> Great Artesian Basin. The Artesian Basin has a strong<br />
regional flow in <strong>the</strong> order of 2.5 m/y; this has resulted in a smear of hydrocarbons being carried<br />
westward (Figures 3.2 and 5.3). Stacked hydrocarbons on <strong>the</strong> Roma Shelf suggest that CO 2 storage<br />
potential is restricted to known pool limits of depleted fields, with significant risk of CO 2 leaking<br />
vertically up faults into <strong>the</strong> artesian system.<br />
Detailed analysis of additional trapping mechanisms for CO 2 storage on <strong>the</strong> Roma Shelf, namely<br />
long distance migration and dissolution trapping, has not been carried out to date. However, <strong>the</strong><br />
most suitable reservoir appears to be <strong>the</strong> Showgrounds Sandstone, <strong>the</strong> same unit being tested on <strong>the</strong><br />
Wunger Ridge. The Showgrounds Sandstone is expected to have similar properties (because of its<br />
matching depositional facies) on <strong>the</strong> Roma Shelf as seen at <strong>the</strong> Wunger Ridge.<br />
As a result <strong>the</strong> Wunger Ridge modelling may be a good representation of CO 2 storage behaviour on<br />
<strong>the</strong> Roma Shelf. Should a <strong>full</strong> analysis of <strong>the</strong> Roma Shelf CO 2 storage potential be required, it<br />
should only take minimal time to transfer <strong>the</strong> observed geological knowledge and techniques into a<br />
meaningful geological model of <strong>the</strong> Roma Shelf.<br />
Figure 5.3. Hydrocarbon fields on <strong>the</strong> Roma Shelf – Bowen Basin. a) Field outlines of <strong>the</strong> Permo-Triassic,<br />
Bowen Basin hydrocarbon pools. b) Field outlines of <strong>the</strong> Jurassic Surat Basin hydrocarbon pools on <strong>the</strong><br />
Roma Shelf. The coincident location of some accumulations imply vertical migration of hydrocarbons.<br />
36
5.6. Nor<strong>the</strong>ast Bowen Basin Study Area<br />
The geological CO 2 storage potential of <strong>the</strong> north-eastern Bowen Basin was investigated due to <strong>the</strong><br />
area’s proximity to major power stations and o<strong>the</strong>r major stationary sources of CO 2 located along<br />
<strong>the</strong> eastern seaboard (Figure 2.1b; Appendix 10.5).<br />
Several potential reservoir units exhibiting characteristics suitable for CO 2 storage have been<br />
identified, albeit with varying confidence. The sandstones in <strong>the</strong> region are of Permian–Triassic age<br />
with <strong>the</strong> majority having a volcano-lithic origin. Subsequent diagenetic and hydrological processes<br />
have altered <strong>the</strong> volcano-genic constituents of <strong>the</strong> sandstone matrix, resulting in high clay content.<br />
Consequently, <strong>the</strong> sandstones developed within <strong>the</strong> area display low porosity with unknown<br />
permeability due to a lack of permeability data in <strong>the</strong> study area.<br />
Investigating <strong>the</strong> mineralogy within <strong>the</strong> sandstone matrix and it’s reactivity within a CO 2 rich<br />
environment is outside <strong>the</strong> scope of this project. These aspects will require fur<strong>the</strong>r investigation<br />
should geological storage of CO 2 be fur<strong>the</strong>r considered in <strong>the</strong> study area.<br />
The nor<strong>the</strong>rn part of <strong>the</strong> study area has minor thin volcanogenic, lithic rich sandstones of Permian<br />
age. Such sandstones do not appear to have reservoir potential. Exploration in this area is focused<br />
on Coal Seam Methane (CSM) exploration/production.<br />
The nor<strong>the</strong>rn section of <strong>the</strong> study area is currently producing methane gas from coal seams, and<br />
several coal mines exist around <strong>the</strong> Moura region. It is unlikely that within <strong>the</strong> coal measures,<br />
regionally connected reservoir sandstone intervals exist in <strong>the</strong> areas which are producing methane<br />
gas from coal seams. CSM production requires significant dewatering of <strong>the</strong> coal seam to reduce <strong>the</strong><br />
pore pressure and release <strong>the</strong> methane gas. Producible coal seams connected to permeable sandstone<br />
aquifers require additional water extraction reducing <strong>the</strong> economic viability of <strong>the</strong> project. Therefore<br />
a risk reduction strategy adopted by CSM producers is to target areas where sandstone quality and<br />
development is poor such as <strong>the</strong> north eastern Bowen Basin.<br />
The sou<strong>the</strong>rn section of <strong>the</strong> study area appears to have <strong>the</strong> greatest potential for geological storage<br />
of CO 2 , based on <strong>the</strong> data currently available. Rocks located near Champagne Creek show <strong>the</strong><br />
greatest potential. Sunshine Gas Ltd is hoping to produce gas from <strong>the</strong> Triassic Moolayember<br />
Formation from several isolated hydrocarbon accumulations within <strong>the</strong> Champagne Creek structure.<br />
The sou<strong>the</strong>rn area is also host to <strong>the</strong> Peat and Scotia Coal-Seam-Methane field. Work into<br />
enhanced-coal-seam-methane production through CO 2 sequestration may highlight fur<strong>the</strong>r potential;<br />
however it is beyond <strong>the</strong> scope of this study.<br />
The best reservoir unit in <strong>the</strong> region is <strong>the</strong> Jurassic Precipice Sandstone from <strong>the</strong> Surat Basin.<br />
However, this unit is a key fresh water aquifer, has no overlying sealing lithology in this region and<br />
ranges in depth from outcrop to 450m. Subsequently <strong>the</strong> Precipice Sandstone which is <strong>the</strong> best<br />
reservoir unit in <strong>the</strong> region is not considered a suitable unit for CO 2 storage.<br />
Fur<strong>the</strong>r work to <strong>full</strong>y characterise potential reservoirs throughout <strong>the</strong> eastern area of <strong>the</strong> Taroom<br />
Trough up to <strong>the</strong> ESSCI level may be required in <strong>the</strong> near future. In <strong>the</strong> Denison Trough three<br />
injection test sites are being prepared to test <strong>the</strong> technical viability of CO 2 injection and storage in<br />
low porosity and permeability rocks. The outcome of <strong>the</strong>se tests would be directly applicable to<br />
sites located along <strong>the</strong> eastern Taroom Trough.<br />
5.7. Chapter References<br />
Bradshaw, B., Bradshaw, J., Dance, T., Reilly, N.S., Sayers, J., Spencer, L. and Wilson, P., 2003.<br />
Geodisc ArcView GIS Version 2.01. APCRC Confidential GIS.<br />
Sayers, J., Marsh, C., Scott, A., Cinar, Y., Bradshaw, J., Hennig, A., Barclay, S. and Daniel, R.,<br />
2006. Assessment of a potential storage site for carbon dioxide – A case study, sou<strong>the</strong>ast<br />
37
Queensland Australia. Environmental Geosciences Journal Special Issue, American Association of<br />
Petroleum Geologists.<br />
Spero, C., 2005. Oxy-Fuel Technology Update on <strong>the</strong> Callide A Retrofit feasibility study.<br />
Australian Journal of Mining conference, Geosequestration in Australia 3-4 th March, Melbourne,<br />
Australia, 2005.<br />
Sunshine Gas, 2005. Australian Stock Exchange Announcement April 7, 2005.<br />
http://www.sunshinegas.com.au/inv_asx.php?q=2&y=2005.<br />
38
6. Southwest Bowen Basin Study Area - Wunger<br />
Ridge Flank<br />
6.1. Seismic Interpretation<br />
6.1.1. Previous Work and Structural Framework<br />
A regional interpretation of <strong>the</strong> Bowen Basin was carried out in <strong>the</strong> 1990’s by <strong>the</strong> <strong>the</strong>n Bureau of<br />
Mineral Resources, now Geoscience Australia, in conjunction with what is now <strong>the</strong> Queensland<br />
Department of Natural Resources, Mines and Energy (QDNRME). The interpretation used regional<br />
seismic lines tied to a regional array of wells as well as deep crustal transects. Significantly more<br />
seismic data existed locally within <strong>the</strong> Wunger Ridge flank study area than were utilised in <strong>the</strong><br />
regional studies, so that fault trends and maps of individual horizons interpreted by <strong>the</strong> Bureau of<br />
Mineral Resources (data and interpretation available from Geoscience Australia) were considered<br />
too generalised for <strong>the</strong> purpose of this study. All available seismic data within <strong>the</strong> Wunger Ridge<br />
flank study area (Figure 2.2c) were thus used so as to produce a more detailed interpretation.<br />
This section presents interpretive results: detailed geophysical reviews are summarised in<br />
(Appendix 10.6.6.).<br />
Previous regional interpretations included those carried out at a sequence stratigraphy level (Brakel<br />
et al., in press); deep crustal transect level (Korsch et al., 1992) and at a regional structural and<br />
exploration level (Korsch et al., 1998; Shaw et al., 1999).<br />
Key tectono-history summaries contained in <strong>the</strong> above references, and pertinent to <strong>the</strong> study area,<br />
are summarised below.<br />
• A late Carboniferous to Early Permian extensional or rift phase is recognised in <strong>the</strong> Bowen<br />
Basin from <strong>the</strong> presence of large-scale half grabens and associated extrusion of volcanic<br />
rocks (Korsch et al., 1992). Large scale faults imaged on deep crustal transects were not<br />
observed on <strong>the</strong> shallow seismic data used in this study.<br />
• During <strong>the</strong> Permian, <strong>the</strong> rift phase and subsequent <strong>the</strong>rmal subsidence phase switched to a<br />
compressional regime associated with east-to-west thrust belts. These thrusts were imaged<br />
on deep crustal transects and observed in outcrop geology (Korsch et al., 1992). Foreland<br />
loading from <strong>the</strong> east during <strong>the</strong> late Permian to mid Triassic produced significant downwarping<br />
of <strong>the</strong> Taroom Trough (Figure 3.5): <strong>the</strong> Trough received significant sedimentation<br />
from <strong>the</strong> east resulting in <strong>the</strong> deposition of <strong>the</strong> Rewan Formation. It is interpreted that downwarping<br />
of <strong>the</strong> Taroom Trough in <strong>the</strong> east may have caused some degree of flexure in <strong>the</strong><br />
west, probably resulting in relatively low accommodation space in <strong>the</strong> west Bowen Basin.<br />
• The final Bowen Basin phase in <strong>the</strong> mid–late Triassic was one of uplift and erosion, forming<br />
<strong>the</strong> unconformable boundary between <strong>the</strong> Bowen and <strong>the</strong> overlying Surat Basin.<br />
6.1.2. Time Interpretation<br />
Seismic horizons<br />
Six seismic horizons were interpreted within <strong>the</strong> study area, and an additional two horizons were<br />
phantomed (copied from an already interpreted horizon and shifted in time (Table 6.1).<br />
For example, <strong>the</strong> Showgrounds Sandstone was phantomed down from <strong>the</strong> Snake Creek Mudstone<br />
due to <strong>the</strong> thin interval that prevented <strong>the</strong> resolution of both horizons within acceptable accuracy on<br />
printed sections. The Rewan Formation was also phantomed through an unconformity down from<br />
<strong>the</strong> Snake Creek Mudstone for similar reasons, so that intervals are of constant thickness with <strong>the</strong><br />
exception of near <strong>the</strong> zero edges where both <strong>the</strong> Showgrounds Sandstone and Rewan Formation<br />
were adjusted. Figure 6.1 shows typical horizons interpreted on different vintages of data, where<br />
different seismic processing flows used resulted in non-uniformity of seismic character; itself<br />
leading to difficulties in tying different vintages of data.<br />
39
Seismic horizons were tied to wells using time–depth picks obtained from well velocity surveys<br />
(Appendix 10.6.6: Table 10.5.8), and to well syn<strong>the</strong>tics where available (Appendix 10.6.6: Table<br />
10.5.1). To insure <strong>the</strong> reliability of interpreted horizons, <strong>the</strong> horizon tied to <strong>the</strong> top Bandanna<br />
Formation (i.e. represented by a coal) was checked by <strong>the</strong> associated characteristic peak, as it is<br />
well imaged. The above quality check was particularly important in wells where no syn<strong>the</strong>tics<br />
were available. All seismic sections used were normal polarity — Australian Standard (i.e. peak<br />
represents decrease in acoustic impedance, dominantly a function of velocity).<br />
Table 6.1. Interpreted and phantomed horizons. Abbreviations: Fm - Formation, Mdst - mudstone,<br />
Sst- sandstone, WCR - well completion <strong>report</strong>.<br />
Horizon Abbreviation Colour Reasoning for interpreting horizons<br />
Orallo Fm ORAL Blue<br />
The Orallo Fm approximately represents <strong>the</strong><br />
base of <strong>the</strong> Cretaceous marine incursions.<br />
The interval above <strong>the</strong> horizon has a<br />
different time–depth gradient to <strong>the</strong> interval<br />
below it,<br />
and thus, helps in creating more precise<br />
depth maps<br />
The Walloon Coal Measures gives an<br />
Walloon Coal<br />
approximate depth estimate to fresh water<br />
WALL Orange<br />
Measures<br />
aquifers of <strong>the</strong> Great Artesian Basin, and<br />
<strong>the</strong> isopach helps derive basin fill history<br />
Moolayember Fm<br />
Snake Creek<br />
Mdst<br />
Showgrounds<br />
Sst<br />
Rewan Fm<br />
Bandanna Fm<br />
MOOL<br />
SNAK<br />
SHOW<br />
REWA<br />
BAND<br />
Dark<br />
Green<br />
Light<br />
Green<br />
Not shown<br />
on figures<br />
Not shown<br />
on figures<br />
Not shown<br />
on figures<br />
Basement BASE Purple<br />
The Moolayember Fm is a secondary seal<br />
overlying <strong>the</strong> regional seal.<br />
The top Moolayember Fm is also equivalent<br />
to <strong>the</strong> top of <strong>the</strong> Bowen Basin and base of<br />
<strong>the</strong> Surat Basin, and as such, important for<br />
understanding basin fill history.<br />
The Snake Creek Mdst regionally seals <strong>the</strong><br />
Showgrounds Sst reservoir and is a prime<br />
horizon to interpret.<br />
The Showgrounds Sst is <strong>the</strong> reservoir being<br />
considered for storage: it was phantomed<br />
down from <strong>the</strong> Snake Creek Mdst<br />
The Rewan horizon was phantomed down<br />
from <strong>the</strong> Snake Creek Mdst to help define<br />
<strong>the</strong> base of <strong>the</strong> Showgrounds Sst<br />
The top Bandanna Fm represents <strong>the</strong> top<br />
Permian and is readily identifiable.<br />
Basement is identified in WCRs as ei<strong>the</strong>r<br />
Kuttung Volcanics, Combargo Volcanics,<br />
granite, Timbury Hills Fm, or Kianga Fm.<br />
The basement is readily identified on <strong>the</strong><br />
Wunger Ridge, and in most places off <strong>the</strong><br />
ridge (Figure 6.1a). The BASE horizon was<br />
interpreted to define a Permian isopach and<br />
map fault trends, critical for understanding<br />
basin infill and trap integrity.<br />
40
Basement (BASE)<br />
The BASE horizon is associated with an increase in velocity as seen on <strong>the</strong> sonic log, and in over<br />
90% of cases, is readily identified as a strong trough on normal polarity sections (Appendix 10.6.6:<br />
Table 10.6.8), and flat or peak signature elsewhere. The increase in velocity is due to <strong>the</strong> presence<br />
of older, metamorphic/volcanic/igneous rock types usually associated with faster velocities.<br />
The horizon is a peak in places and this may be caused by tuning effects from <strong>the</strong> overlying coaly–<br />
sandy Permian succession, resulting in wavelet polarity interference.<br />
Bandanna Formation (BAND)<br />
The BAND horizon is associated with a decrease in velocity as seen on <strong>the</strong> sonic log, and is readily<br />
identified as a moderate-to-strong peak on normal polarity sections (Appendix 10.6.6: Table 10.6.8).<br />
The decrease in velocity is due to <strong>the</strong> presence of low velocity coals. The horizon is occasionally<br />
interpreted on a trough or flat amplitude signature, for example where <strong>the</strong> coal has most likely been<br />
eroded.<br />
Rewan Formation (REWA)<br />
The REWA horizon was phantomed down from <strong>the</strong> SNAK horizon. The TWT values applied are<br />
summarised in Appendix 10.6.6 ( Table 10.6.8).<br />
Showgrounds Sandstone (SHOW)<br />
The SHOW horizon represents <strong>the</strong> top of <strong>the</strong> primary reservoir; in 70% of cases it is associated with<br />
an increase in velocity as seen on <strong>the</strong> sonic log (Appendix 10.6.6: Table 10.6.8), and has next to no<br />
velocity contrast elsewhere. The SHOW horizon is mostly identified as a weak-to-moderate trough<br />
on normal polarity sections. The SHOW horizon is represented by a generally weaker amplitude<br />
signature than <strong>the</strong> SNAK horizon, and so, was approximated by phantoming down from <strong>the</strong> SNAK<br />
horizon see Appendix 10.6.6: section 10.6.5<br />
Snake Creek Mudstone (SNAK)<br />
The SNAK horizon represents <strong>the</strong> top of <strong>the</strong> primary seal for <strong>the</strong> Showgrounds Sandstone<br />
reservoir:, in 70% of cases, it is associated with a decrease in velocity, as seen on <strong>the</strong> sonic log<br />
(Appendix 10.6.6: Table 10.6.8), and is identified as a weak-to-moderate peak on normal polarity<br />
sections. It is identified as a trough or flat amplitude signature elsewhere.<br />
Moolayember Formation (MOOL)<br />
The MOOL horizon represents <strong>the</strong> top of a secondary seal and overlies <strong>the</strong> Snake Creek Mudstone<br />
(seal) and Showgrounds Sandstone (reservoir). The MOOL horizon is associated with a decrease in<br />
velocity on <strong>the</strong> sonic log (Appendix 10.6.6: Table 10.6.8), and is identified as a peak in 70% of<br />
cases on normal polarity sections, and a flat or trough amplitude signature in o<strong>the</strong>r cases. The trough<br />
amplitude signature is seen where <strong>the</strong> top Moolayember Formation represents <strong>the</strong> erosional<br />
boundary between <strong>the</strong> Bowen and Surat basins (Figure 6.2).<br />
Walloon Coal Measures (WALL)<br />
The WALL horizon, for <strong>the</strong> purposes of this study, represent a marker horizon close to fresh water<br />
aquifers present within <strong>the</strong> Surat Basin. The WALL horizon is associated with a decrease in velocity<br />
on <strong>the</strong> sonic log (Appendix 10.6.6: Table 10.6.8), and is identified as a peak on normal polarity<br />
sections. The decrease in velocity is due to <strong>the</strong> presence of low velocity coals. The horizon is readily<br />
identifiable throughout most of <strong>the</strong> study area.<br />
41
Orallo Formation (ORAL)<br />
The ORAL horizon represents an approximate base of <strong>the</strong> Cretaceous marine sequence and as such<br />
is also characterised by a significant change in <strong>the</strong> compaction gradient. Mapping <strong>the</strong> horizon gives<br />
flexibility in using it to associate different velocity functions to <strong>the</strong> depth conversion. The ORAL<br />
horizon is associated with a decrease in velocity on <strong>the</strong> sonic log (Appendix 10.6.6: Table 10.6.8),<br />
and is identified as a weak-to-strong peak on normal polarity sections. The horizon is difficult to<br />
interpret in places. O<strong>the</strong>r aspects of <strong>the</strong> interpretation, for example, involving misties, bulk shifts,<br />
seismic reference datums and details of well-ties, can be found in Appendix 10.6.6.<br />
Faults<br />
Faults were identified within <strong>the</strong> BASE–to–MOOL horizon interval; no faults were interpreted<br />
above <strong>the</strong> MOOL horizon. Faulting density is greater on <strong>the</strong> Wunger Ridge itself, and less so in<br />
areas north and east of <strong>the</strong> ridge. The level of faulting density on <strong>the</strong> ridge makes individual faults<br />
difficult to interpret on printed seismic sections, and it is also beyond <strong>the</strong> scope of this semi-regional<br />
study. As a consequence of <strong>the</strong> time required to correctly identify complex fault patterns, and in<br />
view of <strong>the</strong> goals of <strong>the</strong> project, it was thought unwarranted to spend a significant amount of time to<br />
define fault trends in detail as <strong>the</strong>se are located away from <strong>the</strong> main area of interest – <strong>the</strong> east<br />
Wunger Ridge flank. The faults interpreted on <strong>the</strong> ridge, however, do help establish faulting<br />
episodes and were, <strong>the</strong>refore, interpreted although approximations were made so as to simplify fault<br />
maps (Figure 6.3). The Wunger Ridge flank can be seen to be relatively unfaulted in contrast to <strong>the</strong><br />
faulting density on <strong>the</strong> ridge itself.<br />
6.1.3. Depth Conversion<br />
Forty one wells are located within and adjacent to <strong>the</strong> study area, but of <strong>the</strong>se wells, only about 50%<br />
had measured time–depth data. Well-control was also poorly distributed. The absence of consistent,<br />
measured time–depth data prevented <strong>the</strong> use of average velocity methods in depth conversion at<br />
each well location to construct depth maps, as this would have resulted in poor depth<br />
approximations in <strong>the</strong> areas between <strong>the</strong> well control. Consequently, <strong>the</strong> time–depth data from <strong>the</strong><br />
41 wells were combined to establish a regional time–depth trend (Figure 6.4). Several spurious<br />
points not lying on-trend for two wells were removed prior to merging all 41 well time–depth pairs.<br />
These spurious points were due to typographical errors in <strong>the</strong> well completion <strong>report</strong>s. The resulting<br />
least-squares curve fit shows potential depth errors in <strong>the</strong> order of ±100 m for any one horizon.<br />
The following <strong>the</strong>oretical regional function Z(T) relating depth and TWT (Equation 1) was used to<br />
calculate depth (Robein, 2003: 72), where it is usually approximated as a second order polynomial<br />
(Equation 2).<br />
Z(T) = V 0 * T + a * T 2 + b * Z 3 + … Equation 1<br />
The velocity V 0 is <strong>the</strong> instantaneous velocity at <strong>the</strong> reference T 0 , in our case <strong>the</strong> seismic reference<br />
datum is 244 m ASL. The Z(T) equation (i.e. Equation 2) obtained by fitting a least-squares fit to<br />
<strong>the</strong> time–depth data (Figure 6.4) is:<br />
Z(T) = 1.103 * T + 0.0003 * T 2 Equation 2<br />
The above function was applied to <strong>the</strong> TWT grids using <strong>the</strong> arithmetic formulae function available<br />
in <strong>the</strong> Petrosys TM (seismic mapping software package) gridding module. A processing flow was<br />
developed (Figure 6.5) to produce eight depth maps, one for each of <strong>the</strong> interpreted horizons. All<br />
time–depth and isopach maps and time–depth plots for individual wells can be found in Appendix<br />
10.6.6.<br />
42
6.1.4. Mapping<br />
Time structure, depth, isochron and isopach maps (Appendix 10.6.6) were produced in Petrosys TM .<br />
Structure and isopach maps (Figures 10.5.4–10.5.11, 10.5.13–10.5.24) allowed a number of key<br />
observations to be made with regards to:<br />
• structural dip and subsequent predicted CO 2 migration routes;<br />
• understanding basin-fill and erosion of sediments;<br />
• estimation of probable future exploration activity within <strong>the</strong> study area (Figure 6.6) to better<br />
estimate <strong>the</strong> range of storage site options, and minimise conflict with petroleum exploration.<br />
For example, <strong>the</strong> Permian Tinowon Sandstone reservoir is presently being targeted for<br />
exploration (Brady, 2004; Merrill et al., 2004; Willink et al., 2004) so that stratigraphic plays<br />
might be worked up in any part of <strong>the</strong> study area. All areas are located on currently held<br />
exploration permits where activity is ongoing.<br />
• estimation of which part of <strong>the</strong> study area would be suitable for testing different geological<br />
and engineering scenarios by building 3D geological models and reservoir simulations.<br />
The structurally highgraded areas are shown in figure 6.6. Potential storage site options<br />
include:<br />
1) Meandarra updip-to-Weribone East;<br />
2) Kinkabilla updip-to-Taylor downdip, and<br />
3) Teelba Creek updip-to-Nardoo downdip (Figures 6.3 and 6.6).<br />
Potential Storage Site Options<br />
Meandarra updip-to-Weribone East<br />
Modelling this storage option would test residual, stratigraphic, intra-reservoir baffle and structural<br />
trapping scenarios along an extended migration path (Figure 6.6, option a). Some of <strong>the</strong> o<strong>the</strong>r<br />
positive features of this option would also be <strong>the</strong> relatively thick seal (i.e. 300–500 m) and unfaulted<br />
reservoir-to-seal section. Some faults do exist but fault tips terminate at around top Permian level<br />
(Figure 6.2). The figure does, however, show <strong>the</strong> very attractive nature of this potential storage<br />
option, in particular <strong>the</strong> apparent seal integrity and long migration route.<br />
Some of <strong>the</strong> negative features of this storage site option are:<br />
• no well control in <strong>the</strong> site area for <strong>the</strong> target reservoir;<br />
• <strong>the</strong> relatively deep reservoir, and <strong>the</strong>reby increased cost of operations;<br />
• <strong>the</strong> limited seismic control in places, masking key structural information, and<br />
• tighter reservoir as interpreted from regional trends.<br />
Drilling would, however, be required to prove up injectivity in this area. The closest well at<br />
Overston-1 and -2 (Figure 6.3) showed poor-to-average porosities and permeabilities, and flow<br />
rates from drill-stem tests of 0.25 MMcf/d and 1.5 MMcf/d with strong depletion indicating poor<br />
reservoir characteristics. Hydraulic fracturing has been shown to improve <strong>the</strong> flow rate in <strong>the</strong><br />
short-term but <strong>the</strong> rate of decline is substantial (Sunshine Gas Ltd, 2005).<br />
The approximate migration direction for CO 2 in <strong>the</strong> areas to <strong>the</strong> north of <strong>the</strong> Meandarra updip-to-<br />
Weribone East option was estimated as east–west, with <strong>the</strong> CO 2 in <strong>the</strong> long term (i.e. > 100 years)<br />
probably moving towards <strong>the</strong> Roma Shelf. This migration route would be less favourable for<br />
reasons discussed in section 5.5. Additionally, Overton-1 intersected hydrocarbons (Merill et al.,<br />
2004), so <strong>the</strong> structural trend south of <strong>the</strong> Overston structure may be targeted for exploration.<br />
This exploration could interfere with any CO 2 storage projects.<br />
43
Kinkabilla updip-to-Taylor downdip<br />
This storage option would potentially test residual, stratigraphic, intra-reservoir baffle and structural<br />
trapping scenarios along an extended migration path (Figure 6.6, option b). Some of <strong>the</strong> o<strong>the</strong>r<br />
positive features of this option would be <strong>the</strong> relatively thick seal (i.e. 200–300 m) and relatively<br />
unfaulted reservoir-to-seal section. There is well control at Kinkabilla-1, Kinkabilla Creek-1 and<br />
Inglestone-1 (Figure 6.3). Some faults do exist but <strong>the</strong>se disappear at around <strong>the</strong> top Permian level<br />
(Figures 6.7 and 6.8). Similar structural profiles 10 km to <strong>the</strong> north of line C81-6 show no faulting<br />
(Figure 6.9). Faulting density varies but is still relatively low compared to <strong>the</strong> density at <strong>the</strong> Wunger<br />
Ridge, and <strong>the</strong>re appears to be no faulting at <strong>the</strong> Showgrounds Sandstone level.<br />
Some of <strong>the</strong> negative features of this storage site option are:<br />
• <strong>the</strong> relatively deep reservoir, and <strong>the</strong>reby increased cost of operations;<br />
• <strong>the</strong> limited seismic control in places, possibly masking key structural information<br />
(Figure 6.6), and<br />
• tighter reservoirs as interpreted from regional trends and palaeogeography maps<br />
(Section 6.4). Drilling would be required to prove up reservoir characteristics.<br />
Teelba Creek updip-to-Nardoo downdip<br />
This storage option would ultimately test residual, stratigraphic, intra-reservoir baffle and structural<br />
trapping along an extended migration path (Figure 6.6, option c). Some of <strong>the</strong> o<strong>the</strong>r positive features<br />
of this option would be:<br />
• greater well-control, and higher permeabilities present in <strong>the</strong> area (Section 6.4);<br />
• shallower reservoir targets than in o<strong>the</strong>r storage site options; in <strong>the</strong> order of 400–500m less,<br />
so that drilling would be less expensive;<br />
• possibly reduced exploration activity in <strong>the</strong> area due to <strong>the</strong> lack of exploration success to<br />
date;<br />
• non-uniform structural gradient and azimuth, which add complexity to CO 2 migration routes.<br />
Some of <strong>the</strong> negative features of this storage option are:<br />
• <strong>the</strong> minimal seismic data interpreted in this area, and<br />
• <strong>the</strong> thin seal (i.e. Snake Creek Mudstone and Moolayember Formation), and higher faulting<br />
density, which increases <strong>the</strong> chance of a seal breach being present.<br />
The Kinkabilla updip-to-Taylor downdip option was favoured against <strong>the</strong> Meandarra updip-to-<br />
Weribone East option principally, because of <strong>the</strong> increased well-control, and better permeabilities<br />
present in <strong>the</strong> Wunger Ridge wells. Additionally, <strong>the</strong> favoured option would still test all trapping<br />
scenarios. The Teelba Creek updip-to-Nardoo downdip option probably suffers from a higher<br />
probability of seal breach, although this would need to be confirmed by interpreting more seismic<br />
lines. For <strong>the</strong> purpose of this <strong>report</strong> <strong>the</strong> Kinkabilla updip-to-Taylor downdip is referred to as <strong>the</strong><br />
Wunger Ridge flank.<br />
44
Figure 6.1. Seismic sections across <strong>the</strong> Wunger Ridge study area. (a) East–west seismic line HSI-1003 on<br />
Wunger Ridge flank. (b) East–west seismic line 78B-39, across Waggamba-1. Seismic horizons, from bottomto-top:<br />
magenta - basement, purple - top Permian, light green - Snake Creek Mdst (also approximates top<br />
of Showgrounds Sst), dark green - Moolayember Fm, orange - Walloon Coal Measures, blue - Orallo Fm.<br />
Figure 6.2. Seismic sections across <strong>the</strong> Wunger Ridge study area. East–west seismic line S78-3, updip Meandarra-1<br />
to downdip Weribone East-1. Seismic horizons, from bottom-to-top: magenta - basement, purple - top Permian,<br />
light green - Snake Creek Mdst (also approximates top of Showgrounds Sst), dark green - Moolayember Fm,<br />
orange - Walloon Coal Measures, blue - Orallo Fm.<br />
45
Figure 6.3. Depth map of basement across <strong>the</strong> Wunger Ridge study area. Referenced to a SRD of +244 m ASL.<br />
Red coloured well symbols - shows well-control on basement and were used in depth conversion; red outline -<br />
46
0<br />
TWT ~ Depth (SRD = 244m)<br />
TWT (ms)<br />
y = 0.0003x 2 + 1.103x<br />
R 2 = 0.9969<br />
0 500 1000 1500 2000 2500<br />
500<br />
1000<br />
1500<br />
Depth (m)<br />
2000<br />
2500<br />
3000<br />
3500<br />
4000<br />
Figure 6.4. TWT–depth pairs for 41 wells located in <strong>the</strong> Wunger Ridge study area. Note: ‘x’ in <strong>the</strong> equation<br />
refers to TWT, and ‘y’ refers to depth; both sets of data are referenced to a SRD of + 244 m.<br />
Figure 6.5. Depth conversion flowchart. The depth–TWT function used requires wells to be retied in <strong>the</strong><br />
depth domain because of <strong>the</strong> regional trend nature of <strong>the</strong> function. Words in italics are Petrosys TM<br />
software functions.<br />
47
a<br />
b<br />
c<br />
Figure 6.6. Potential storage site options in Wunger Ridge study area. Pink patch — storage site options. Option a:<br />
nor<strong>the</strong>rn patch — Meandarra updip–to–Weribone East; option b: middle patch — Kinakabilla updip–to–Taylor<br />
downdip; option c: sou<strong>the</strong>rn patch — Teelba Creek updip–to–Nardoo downdip. Green patch — estimated location<br />
of Permian Tinowon Sandstone zero edge play; brown patch — estimated areas of future exploration (based on<br />
structural highs and flatter structural gradient); light blue patch — open acreage at time of study.<br />
48
Figure 6.7. BANDANNA-to-SHOWGROUNDS isopach map. Red coloured well symbols — shows<br />
control points on basement, also used in depth conversion; red outline — limit of interpreted seismic.<br />
Figure 6.8. Seismic sections across <strong>the</strong> Wunger Ridge study area. East–west seismic-line C81-6, tie to Kinkabilla-1<br />
& Inglestone-1. Seismic horizons, from bottom-to-top: magenta — basement, purple — top Permian, light green<br />
Snake Creek Mdst (also top of Showgrounds Sst), dark green — Moolayember Fm, orange — Walloon Coal<br />
Measures, blue — Orallo Fm.<br />
49
Figure 6.9. Seismic sections across <strong>the</strong> Wunger Ridge study area. East–west seismic line C81-3, north of Kinkabilla-<br />
1. Seismic horizons, from bottom-to-top: magenta - basement, purple- top Permian, light green - Snake Creek Mdst<br />
(also approximates top of Showgrounds Sst), dark green — Moolayember Fm, orange — Walloon Coal Measures,<br />
blue - Orallo Fm.<br />
Figure 6.10. Seismic section across <strong>the</strong> Wunger Ridge study area. (a) East-west seismic line HIS-1008,<br />
Wunger Ridge flank. (b) East-west seismic line HIS-1001, downdip Wunger Ridge flank. Seismic horizons, from<br />
bottom-to-top: magenta-basement, purple-top Permian, light green-Snake Creek Mdst (also top of Showgrounds<br />
Sst), dark green-Moolayember Fm, orange- Walloon Coal Measures, blue- Orallo Fm.<br />
50
Maps and Basin Fill<br />
The Basement to Moolayember Formation structure maps (Appendix 10.6.6; Figures 10.5.4 -<br />
10.5.11, 10.5.13–10.5.20) indicate higher faulting density on <strong>the</strong> Wunger Ridge. Few faults extend<br />
into <strong>the</strong> Surat Basin sediments (i.e. above <strong>the</strong> Moolayember Formation), an observation consistent<br />
with recognised late Permian faulting and early Jurassic reactivation, as observed from <strong>the</strong> seismic<br />
data (Korsch et al., 1998) followed by a relatively quiescent period. The marked shift in location<br />
between <strong>the</strong> Surat and Bowen Basin depocentres is evident by comparing <strong>the</strong> pre-Snake Creek<br />
Mudstone horizon (Figure 10.5.17) and Walloon Coal Measures horizon (Figure 10.5.18) maps.<br />
The shift in depocentres can be seen to swing from <strong>the</strong> nor<strong>the</strong>ast Taroom Trough to <strong>the</strong> sou<strong>the</strong>ast.<br />
Note that localised depocentres, adjacent to <strong>the</strong> greater Waggamba-1 (Figure 6.3) area, stack up in<br />
both basins.<br />
The Basement-to-Bandanna and Snake Creek Mudstone-to-Moolayember isopachs show Permian<br />
and Triassic depocentres located on <strong>the</strong> eastern side of <strong>the</strong> study area with a well-defined north–<br />
south hinge-line present halfway between Meandarra-1 and Weribone East-1 (Figures 6.3 and 6.7).<br />
The Snake Creek Mudstone and Showgrounds Sandstone intervals are not shown as <strong>the</strong><br />
Showgrounds Sandstone and Rewan horizons were phantomed, and <strong>the</strong>refore isopach maps are<br />
meaningless. The Showgrounds Sandstone and Snake Creek Mudstone intervals are, however,<br />
expected to thicken in <strong>the</strong> Taroom Trough. Sedimentation rates kept up with subsidence rates<br />
resulting from foreland loading from <strong>the</strong> east and associated subsidence of <strong>the</strong> Taroom Trough.<br />
As a result, <strong>the</strong> Taroom Trough received significant sedimentation in <strong>the</strong> early Jurassic, which<br />
formed <strong>the</strong> Rewan Formation. Rates of subsidence slowed, and <strong>the</strong> Showgrounds Sandstone was<br />
probably deposited in a less pronounced trough than present in <strong>the</strong> early stages of deposition of <strong>the</strong><br />
Rewan Formation. The large part of <strong>the</strong> thickness variation seen in <strong>the</strong> Bandanna-to-Showgrounds<br />
Sandstone isopach is, <strong>the</strong>refore, due to <strong>the</strong> Rewan Formation infilling and truncation.<br />
6.2. Geological Overview<br />
6.2.1. Basement<br />
Basement rock types intersected by petroleum exploration wells across <strong>the</strong> Wunger Ridge area are<br />
interpreted to be Devonian to Permian in age. These rocks include plutonic granitic rocks (Roma<br />
Granite), meta-sedimentary rocks (Timbury Hills Formation), and felsic volcanic rocks including<br />
rhyolites and dacites (Combarngo Volcanics; Butcher, 1984; Appendix 10.1). Overlying basement<br />
rocks are Permian to Cretaceous aged basin fill sediments of <strong>the</strong> Bowen and Surat basins (Figure<br />
6.20).<br />
During <strong>the</strong> Permian, major subsidence in <strong>the</strong> east led to <strong>the</strong> formation of <strong>the</strong> Bowen Basin and<br />
subsequent deposition of sediments within <strong>the</strong> main Taroom Trough (Figure 3.3). These sediments<br />
originated from a volcanic arc to <strong>the</strong> east of <strong>the</strong> Bowen Basin with minor influence from a stable<br />
craton in <strong>the</strong> west (Butcher, 1984). Subsidence of <strong>the</strong> Taroom Trough was highest in <strong>the</strong> east, where<br />
<strong>the</strong> Permian, Back Creek Group (Butcher, 1984; see Appendix 10.1) was deposited, gradually<br />
lessening towards <strong>the</strong> west.<br />
6.2.2. Permian Sediments<br />
The Back Creek Group<br />
The Back Creek Group is one of <strong>the</strong> original terms used to define Permian aged marine rocks in <strong>the</strong><br />
Taroom Trough. The Back Creek Group comprises marine to marginal marine siltstones, lithic<br />
sandstones, coals and tuffaceous, calcareous and pyritic claystones, dominantly sourced from <strong>the</strong><br />
eastern volcanic arc as well as limited occurrences of limestone. Due to rapid, almost continuous<br />
sedimentation, and a lack of palynology, <strong>the</strong> unit is generally considered hard to differentiate and<br />
<strong>the</strong>refore often just grouped as one.<br />
51
Figure 6.11. Diagrammatic cross-section of <strong>the</strong> Wunger Ridge study area. The Moolayember Formation extends<br />
well beyond <strong>the</strong> Bowen Basin into <strong>the</strong> Galilee Basin to <strong>the</strong> northwest. Basement age is uncertain and varies<br />
between authors and rock types (Modified from Butcher, 1984).<br />
The character of <strong>the</strong> Back Creek Group changes to <strong>the</strong> west due largely to decreased<br />
accommodation space (ratio of sediment supply to subsidence or water level rise) and an increased<br />
component of quartz rich sediment sourced from <strong>the</strong> stable craton to <strong>the</strong> southwest.<br />
This produces pronounced changes in reservoir characteristics and an increased ability for different<br />
sedimentary cycles to be distinguished. The effort to define <strong>the</strong>se cycles has been controlled by <strong>the</strong>ir<br />
economic importance, with increased palynological control leading to numerous attempts to<br />
redefine <strong>the</strong> Back Creek Group (Appendix 10.1).<br />
Following <strong>the</strong> deposition of <strong>the</strong> Back Creek Group, <strong>the</strong> coal prone Bandanna or Kianga Formation<br />
(Appendix 10.1) was deposited (Butcher, 1984). Interpreted as a series of fluvial and flood plain<br />
sequences, <strong>the</strong> base of this formation can be hard to distinguish from <strong>the</strong> underlying Back Creek<br />
Group (Butcher, 1984). Despite similar characteristics, separation of <strong>the</strong> Bandanna Formation from<br />
<strong>the</strong> Back Creek Group is usually based on <strong>the</strong> greater proportion of thicker coal seams found in <strong>the</strong><br />
Bandanna Formation (Butcher, 1984).<br />
Porosities (< 10%) and permeabilities (generally < 1 mD) within <strong>the</strong> sandstone facies are poor, due<br />
to <strong>the</strong> lithic and argillaceous matrix; however cleaner quartzose sandstones exist (Butcher, 1984).<br />
An example of cleaner sandstones can be found in Waggamba-1, in <strong>the</strong> Tinowon Formation which<br />
is also currently <strong>the</strong> target of renewed exploration activity within <strong>the</strong> Taroom Trough.<br />
6.2.3. Triassic Sediments<br />
Rewan Formation<br />
Deposition of <strong>the</strong> Rewan Formation into <strong>the</strong> Taroom Trough began with <strong>the</strong> onset of foreland thrust<br />
loading associated with <strong>the</strong> Hunter–Bowen Event (Fielding et al., 2001) and continued during <strong>the</strong><br />
early Triassic (Butcher, 1984). The Rewan Formation consists of mudstones, siltstones, sandstones<br />
and conglomerates, including multi-coloured lithic arenites containing rhyolitic tuff (Butcher,<br />
1984). This formation has undergone extensive silicification and clay alteration resulting in low<br />
porosity and a permeability often less than 1 mD (Butcher, 1984).<br />
52
Showgrounds Sandstone/Snake Creek Mudstone<br />
Unconformably overlying <strong>the</strong> Rewan Formation is <strong>the</strong> Showgrounds Sandstone; equivalent to <strong>the</strong><br />
Clematis Sandstone elsewhere in <strong>the</strong> Bowen Basin. The Showgrounds Sandstone represents <strong>the</strong><br />
early onset of a Triassic transgressive system that includes <strong>the</strong> Snake Creek Mudstone and <strong>the</strong><br />
Moolayember Formation (seals). The overlying Snake Creek Mudstone is expected to hold back a<br />
significant height of CO 2 in this region without too much risk of leakage into <strong>the</strong> overlying fresh<br />
water formations of <strong>the</strong> Surat Basin (Figure 6.11) especially as <strong>the</strong> overlying Moolayember<br />
Formation is likely to be an effective seal in its own right.<br />
Wells drilled east of <strong>the</strong> Wunger Ridge all have a similar description of an interval defined as <strong>the</strong><br />
Showgrounds Sandstone. This description is of white to brown sandstones, with fine to very coarse,<br />
angular to subangular grains. The grains are largely quartz of various colours (including clear, white<br />
and orange) with varying amounts of rock fragments. The matrix is predominately a white clay and<br />
<strong>the</strong>re are varying amounts of calcareous cement. No conventional core samples were taken in <strong>the</strong><br />
wells, and as such, no core analysis was undertaken to estimate porosity and permeability. Side-wall<br />
core samples were taken in Kinkabilla-1 (Figure 6.3) and descriptions are consistent with that from<br />
well cuttings, that is a tight, poorly sorted sandstone with abundant lithic fragments. Drill Stem<br />
Tests (DST) were conducted in Kinkabilla Creek-1, however, <strong>the</strong> results can not be reinterpreted<br />
due to <strong>the</strong> poor quality of <strong>the</strong> data submitted to <strong>the</strong> Queensland Government. The original DST<br />
<strong>report</strong> indicated <strong>the</strong> sand to be tight despite apparent permeability being indicated on <strong>the</strong> resistivity<br />
logs. The above interpretations are based on interpreting raw data <strong>report</strong>s (UOD, 1966; SCO, 1987;<br />
Coho, 1982).<br />
Clematis Sandstone<br />
The Clematis Sandstone ranges from a quartzose sandstone north of <strong>the</strong> study area to a volcanolithic,<br />
sublabile sandstone in <strong>the</strong> sou<strong>the</strong>ast Bowen Basin (Dickens and Malone, 1973). The thickness<br />
of <strong>the</strong> Clematis Sandstone ranges from approximately 100 m in <strong>the</strong> west to 300 m in <strong>the</strong> east, where<br />
<strong>the</strong> volcanic component is at its greatest (Dickens and Malone, 1973). Planar cross-bedding, present<br />
throughout <strong>the</strong> Clematis Sandstone, suggests an approximately north–south trending braided<br />
channel facies model for deposition of sediments with siltstone interbeds, possibly representing<br />
short-lived flood plains (Dickens & Malone, 1973).<br />
The presence of a highly volcano-lithic succession of <strong>the</strong> Clematis Sandstone on <strong>the</strong> east side of <strong>the</strong><br />
Taroom Trough adjacent to <strong>the</strong> Wunger Ridge is confirmed by petroleum wells drilled in <strong>the</strong> area.<br />
Cabawin-1 and Tartha-1 (Figure 5.2) wells, drilled in <strong>the</strong> 1960s both intersected a thick Clematis<br />
Sandstone composed of predominantly greenish–grey quartzose pebbly sandstone with chert and<br />
silicified ash in a white to green tuffaceous matrix, which would not be suitable for CO 2 injection.<br />
O<strong>the</strong>r wells may have intersected <strong>the</strong> Clematis Sandstone (e.g. Kinkabilla-1, Kinkabilla Creek-1 and<br />
Inglestone-1 (Figure 6.3): located approximately 36 km from <strong>the</strong> Wunger Ridge). Unfortunately at<br />
<strong>the</strong>se locations, <strong>the</strong> Clematis Sandstone cannot be differentiated from <strong>the</strong> Showgrounds Sandstone,<br />
although <strong>the</strong>y will still provide information on <strong>the</strong> quality of potential reservoir sandstones east of<br />
<strong>the</strong> Wunger Ridge, as is discussed below. No wells have penetrated <strong>the</strong> Clematis Sandstone in <strong>the</strong><br />
central part of <strong>the</strong> sou<strong>the</strong>rn Taroom Trough.<br />
It is recommended that <strong>the</strong> Clematis Sandstone be investigated fur<strong>the</strong>r to <strong>the</strong> north, on <strong>the</strong> flank of<br />
<strong>the</strong> Roma Shelf, in conjunction with a planned study of that area. Even though this area has<br />
extremely limited data (i.e. one well in <strong>the</strong> west and two wells in <strong>the</strong> far-east, with nothing in <strong>the</strong><br />
middle of <strong>the</strong> trough), it is fur<strong>the</strong>r away from <strong>the</strong> palaeovolcanolithic source located on <strong>the</strong><br />
sou<strong>the</strong>astern edge of <strong>the</strong> Taroom Trough and <strong>the</strong>refore may have better reservoir quality. Modelling<br />
at <strong>the</strong> Wunger Ridge indicates lower porosity/permeability injection sites are potentially feasible but<br />
require an order of magnitude increase in <strong>the</strong> number of wells. At this stage it is not recommended<br />
that a possible Clematis Sandstone injection site be assessed.<br />
53
The storage potential of <strong>the</strong> Clematis Sandstone was investigated as a possible eastward extension<br />
to <strong>the</strong> Showgrounds Sandstone. Based on palaeogeography maps (section 6.4) and <strong>the</strong> authostratigraphic<br />
chart (Appendix 10.1), this would mean moving <strong>the</strong> injection site fur<strong>the</strong>r down dip<br />
into <strong>the</strong> thicker Clematis Sandstone which is a partial time equivalent of <strong>the</strong> Showgrounds<br />
Sandstone. There are no wells drilled in <strong>the</strong> middle of <strong>the</strong> Taroom Trough intersecting <strong>the</strong> Clematis<br />
Sandstone and thus no data. Therefore any geological assessment of <strong>the</strong> ability of <strong>the</strong> Clematis<br />
Sandstone to store CO 2 would be based on data from wells tens of kilometres away which indicate<br />
<strong>the</strong> Clematis Sandstone exhibits poor reservoir characteristics.<br />
Moolayember Formation<br />
The Moolayember Formation, <strong>the</strong> final stage and most widely spread depositional unit (Figure<br />
6.11), of <strong>the</strong> Triassic transgressive system, is a predominantly deltaic unit (identified from core in<br />
Rednook-1 (Figures 4.2 and 6.3), which conformably builds into <strong>the</strong> Snake Creek Mudstone<br />
lacustrine system. The Moolayember Formation is expected to have significant sealing capacity, or<br />
at <strong>the</strong> very least create an extremely tortuous migration pathway for any vertically migrating fluids<br />
as it has a shaly base with a very broad coarsening upward nature. It also extends well past <strong>the</strong><br />
Showgrounds Sandstone pinch out edge (Figure 6.11).<br />
6.3. Showgrounds Sandstone-Snake Creek Mudstone<br />
reservoir/seal pairs<br />
For a reservoir/seal pair to be suitable for CO 2 storage, <strong>the</strong> reservoir facies need to contain sufficient<br />
permeability (pore scale connectivity), porosity (pore volume) and lateral connectivity of geological<br />
bodies (at <strong>the</strong> scale of individual point bars and braided channels and bars) to cope with <strong>the</strong><br />
intended injection rate, and ultimate volume of injection. In addition to this <strong>the</strong> reservoir must be<br />
sealed vertically and horizontally to trap <strong>the</strong> intended injection volume. Within <strong>the</strong> Bowen Basin,<br />
one reservoir–seal pair, <strong>the</strong> Showgrounds Sandstone (reservoir)–Snake Creek Mudstone (seal),<br />
stood out as appearing to be of significant lower risk than o<strong>the</strong>rs.<br />
The Wunger Ridge and flank area, in particular, stood out over o<strong>the</strong>r site options as previously<br />
discussed in Section 6.1.4. Of particular note, hydrocarbons have been success<strong>full</strong>y trapped within<br />
<strong>the</strong> Showgrounds Sandstone beneath <strong>the</strong> Snake Creek Mudstone since hydrocarbon expulsion and<br />
migration, thus <strong>the</strong> seal has been proven over a large area and over time (Butcher, 1984; Home et<br />
al., 1990). The Snake Creek Mudstone in <strong>the</strong> Wunger Ridge area appears not to have been<br />
compromised through any significant structural events with no evidence of upward migration of<br />
hydrocarbons into <strong>the</strong> upper Moolayember Formation or overlying Jurassic to Cretaceous, Surat<br />
Basin. The absence of stacked hydrocarbon pools across <strong>the</strong> Wunger Ridge suggests <strong>the</strong> Snake<br />
Creek Mudstone is a reliable long term sealing lithology which is relatively un-faulted at this<br />
location.<br />
By contrast, at <strong>the</strong> Roma Shelf, 70 km north of <strong>the</strong> Wunger Ridge, <strong>the</strong> presence of hydrocarbons in<br />
<strong>the</strong> younger and shallower Jurassic aged strata indicates <strong>the</strong> Snake Creek Mudstone seal is<br />
compromised, most likely by faulting. Maturity modelling of sediments within <strong>the</strong> Taroom Trough<br />
indicates maximum expulsion occurred during <strong>the</strong> Mid Cretaceous approximately 90 Ma before<br />
present (Korsch et al., 1998).<br />
6.3.1. Previous Work<br />
There is little published information on <strong>the</strong> Showgrounds Sandstone in <strong>the</strong> Wunger Ridge area, as<br />
such Butcher’s 1984 paper is <strong>the</strong> main source for this brief review. Butcher divided <strong>the</strong><br />
Showgrounds Sandstone into three main facies units of fluvial origin with <strong>the</strong> upper unit showing<br />
evidence of “marine influence” in a deltaic environment (interpreted to be lacustrine in this review).<br />
It should be noted that Butcher’s units divide <strong>the</strong> Showgrounds Sandstone horizontally into<br />
lithological units with an overlying third unit.<br />
54
Using this method <strong>the</strong>re is a potential to misinterpret <strong>the</strong> relationship between different lithologies<br />
in space, as opposed to time, by using a sequence stratigraphic approach which ensures that <strong>the</strong><br />
facies are predictable.<br />
Butcher (1984) described <strong>the</strong> units as follows:<br />
• Facies unit 1 — fluvial proximal with an abrupt upper and lower contact “a braided<br />
system”. He indicates this unit has <strong>the</strong> better reservoir quality overall and that <strong>the</strong>re is<br />
significant reservoir variability within <strong>the</strong> unit.<br />
• Facies unit 2 — a fluvial unit with an abrupt lower boundary that fines upwards<br />
“a meandering system”.<br />
• Facies unit 3 — is generally a coarsening upwards sequence with an abrupt upper shale<br />
contact “a deltaic system”.<br />
6.3.2. Cathodoluminescence Petrography<br />
A number of samples were collected from core ranging in age from 44 to 18 years old and stored at<br />
Geoscience Australia. The sample set comprised contemporaneous (Triassic) samples, two<br />
tuffaceous and six Showgrounds Sandstone from <strong>the</strong> Wunger Ridge and one tuffaceous and three<br />
Showgrounds Sandstone samples from <strong>the</strong> Roma Shelf. In addition to this, one sample from each of<br />
<strong>the</strong> Freitag (Permian) and Aldebaran (Permian) Formations in <strong>the</strong> Denison Trough were analysed<br />
(Table 6.2). The samples from <strong>the</strong> Roma Shelf and Denison Trough were taken as comparison<br />
samples and as part of a scoping study into <strong>the</strong> CO 2 storage potential of those regions, for this<br />
reason only Wunger Ridge samples will be discussed here.<br />
Cathodoluminescence Petrography (CL) was carried out on samples from <strong>the</strong> Wunger Ridge and<br />
indicates that <strong>the</strong> quartz was derived from a dominantly plutonic source, with some minor<br />
contributions from both volcanic and metamorphic sources (Appendix 10.6.2). In addition to this,<br />
CL showed that <strong>the</strong> quartz in <strong>the</strong> tuffaceous samples had <strong>the</strong> same source rocks as <strong>the</strong> Showgrounds<br />
Sandstone samples, suggesting <strong>the</strong>y are in fact tuffaceous sandstones ra<strong>the</strong>r than volcanic tuffs.<br />
Fur<strong>the</strong>r evidence confirming <strong>the</strong> tuffaceous nature and volcanic input into <strong>the</strong> system is <strong>the</strong> presence<br />
of non-luminescent glassy fragments in sample HT1804a (Table 6.2), suggesting an extremely short<br />
detrital grain transport from volcanic source sediment.<br />
Table 6.2. Listing of petrography samples numbers. Taken from Barclay (2005; Appendix 10.6.2; see Figure 4.2 for<br />
location of Wunger Ridge wells).<br />
Sample<br />
No.<br />
Well Name<br />
Year<br />
Well<br />
Drilled<br />
Depth Taken<br />
Well Location Meters Feet Formation Sample<br />
From<br />
C5091 Combarngo-1 1961 Roma Shelf 5091’4’’ Showgrounds Sst whole core<br />
C5089 Combarngo-1 1961 Roma Shelf 5089’4’’ Showgrounds Sst whole core<br />
H1978 Harbour-1 1987 Wunger Ridge 1978.67 Tuff (Snake Ck) half core<br />
H1987 Harbour-1 1987 Wunger Ridge 1987.3 Showgrounds sst half core<br />
HT1804a Hollow Tree-1 1963 Wunger Ridge 1804.2 Tuff whole core<br />
L6604 Lorelle-1 1963 Roma Shelf 6604’4’’ Tuff/Showgrounds whole core<br />
L6608 Lorelle-1 1974 Roma Shelf 6608’4’’ ?Showgrounds Sst whole core<br />
J6152 Silver Springs-1 1974 Wunger Ridge 6152 Showgrounds Sst whole core<br />
J6150 Silver Springs-1 1963 Wunger Ridge 6150 Showgrounds Sst whole core<br />
W3419 Warrinilla-1 1963 DenisonTrough 3419 Freitag Fm whole core<br />
W3457 Warrinilla-1 1963 Denison Trough 3457 Aldebaran Sst whole core<br />
WB7074 Combarngo-1 1963 Wunger Ridge 7074’3’’ ?Showgrounds Sst whole core<br />
Y1869 Yellowbank Ck Nth-1 1987 Wunger Ridge 1869.5 Showgrounds Sst half core<br />
Y1870 Yellowbank Ck Nth-1 1987 Wunger Ridge 1870.25 Showgrounds Sst half core<br />
55
6.3.3. Thin Section Petrography<br />
Thin section petrography of <strong>the</strong> Wunger Ridge samples identified mostly quartz–rich rocks, being<br />
classified as ei<strong>the</strong>r sub-litharenites or sub-arkoses (Figure 6.12). Besides quartz, o<strong>the</strong>r detrital<br />
(deposited by sedimentary processes) minerals present in <strong>the</strong> samples include: feldspar, clay grains<br />
displaying evidence of compaction, minor amounts of mica (muscovite and biotite), and<br />
metamorphic rock fragments. Diagenesis has resulted in <strong>the</strong> precipitation of secondary minerals in<br />
all samples analysed, including quartz (as overgrowths), clays (illite, kaolinite and minor chlorite),<br />
and carbonates (calcite and dolomite). These secondary minerals have had some impact on <strong>the</strong><br />
porosity and permeability of <strong>the</strong> samples, with <strong>the</strong> illite and calcite minerals having <strong>the</strong> biggest<br />
impact on reducing porosity where present.<br />
Based on <strong>the</strong> thin section analysis <strong>the</strong> tuffaceous samples can be classified as coarse grained poorlywelded<br />
tuffs or tuffaceous sandstones. Sample HT1804a (Table 6.2) contains layered volcanic glass<br />
fragments that do not display significant deformation, supporting <strong>the</strong> tuff classification with limited<br />
fluvial reworking. Despite this <strong>the</strong> tuffaceous samples are not especially different from <strong>the</strong><br />
sandstone samples in terms of <strong>the</strong>ir mineralogy.<br />
Quartz<br />
•<br />
•<br />
•<br />
•<br />
• •<br />
• •<br />
•<br />
•<br />
•<br />
Sample<br />
Number<br />
• C5089<br />
• C5091<br />
• H1978<br />
• H1987<br />
• HT1804a<br />
• J6150<br />
• J6152<br />
• L6604<br />
• L6608<br />
• W3419<br />
• W3457<br />
• WB7074<br />
• Y1869<br />
• Y1870<br />
Feldspar<br />
Rock fragments<br />
Figure 6.12. Petrographical classification of samples. Figure shows that <strong>the</strong> Showgrounds Sandstone is a<br />
relatively stable quartz dominated unit, with few components likely to react with CO 2 injected into <strong>the</strong> unit<br />
(after Folk, 1974).<br />
56
6.3.4. X-ray Diffractometry<br />
X-ray Diffractometry (XRD) analysis of samples from <strong>the</strong> Wunger Ridge show quartz is <strong>the</strong><br />
dominant mineral present in all samples. O<strong>the</strong>r minerals identified in <strong>the</strong> samples by XRD were<br />
kaolin in most samples and a poorly crystallised mica mineral identified as illite which was present<br />
in some samples. All of <strong>the</strong> sandstone samples contained clay minerals, ei<strong>the</strong>r kaolinite, illite or<br />
chlorite with <strong>the</strong> majority containing a mixture. Total clay content for <strong>the</strong> sandstone samples varied<br />
from 2 % (J6152 in Table 6.2; Figure 6.12) up to a maximum of 43 % (Y1869). It is worth noting<br />
that <strong>the</strong> samples with relatively high clay content show an apparent higher degree of feldspar<br />
dissolution.<br />
Tuffaceous samples analysed with XRD show no notable differences to <strong>the</strong> sandstone samples, with<br />
sample HT1804a being an exception. This sample contains a significant amount of calcite<br />
suggesting that <strong>the</strong> tuffaceous sandstone sediments contained a mineralogical source of calcium<br />
(e.g. anorthite). This sample was taken from a location a few centimetres above metamorphosed<br />
basement which is <strong>the</strong> most obvious source of <strong>the</strong> calcite.<br />
6.3.5. Analysis of Results<br />
Combined, <strong>the</strong> CL, XRD and thin section petrography indicate that <strong>the</strong> quartz found in <strong>the</strong><br />
tuffaceous sediments and <strong>the</strong> Showgrounds Sandstone is related, coming from a predominantly<br />
plutonic source with additional input from volcanic and metamorphic sources. This similarity<br />
suggests that <strong>the</strong> tuffaceous sediments are actually sandstones, containing a high proportion of<br />
volcanic clay (i.e. tuffaceous sandstones). The interpretation of a volcanic origin for <strong>the</strong> clay present<br />
in <strong>the</strong> tuffaceous sandstones is streng<strong>the</strong>ned by <strong>the</strong> presence of volcanic glass fragments.<br />
Overall <strong>the</strong> samples analysed from <strong>the</strong> Wunger Ridge are dominated by quartz grains with only<br />
minor amounts of o<strong>the</strong>r constituent minerals. This suggests that <strong>the</strong> Showgrounds Sandstone is<br />
chemically stable and as such injecting or storing CO 2 in <strong>the</strong> formation is not anticipated to cause<br />
adverse chemical reactions leading to a significant reduction in porosity and permeability. Some of<br />
<strong>the</strong> samples contain clay minerals which appear to have <strong>the</strong> greatest influence on reducing porosity<br />
and thus prospective CO 2 storage volume. A <strong>full</strong> <strong>report</strong> on <strong>the</strong> CL, XRD and thin section analyses,<br />
including photomicrographs, can be found in Appendix 10.6.2.<br />
6.3.6. Showgrounds Sandstone Sedimentology<br />
The Showgrounds Sandstone comprises conglomerates, sandstones (containing clear to white subangular<br />
to sub-rounded quartz), siltstones and shales, deposited in a dominantly fluvial environment<br />
(Butcher, 1984).<br />
Southwest of <strong>the</strong> Wunger Ridge, intersections of economic basement in wells are typically<br />
described as granite and often referred to in company Well Completion Reports as <strong>the</strong> Roma<br />
Granite. North of <strong>the</strong> granite <strong>the</strong> economic basement intersected in wells is described as <strong>the</strong><br />
Timbury Hills Formation which is a regional metamorphic rock. Petrographic analysis indicates<br />
<strong>the</strong>se two rock types appear to be <strong>the</strong> source of sediment for <strong>the</strong> Showgrounds Sandstone, with<br />
minor volcanic input from an eastern volcanic arc.<br />
Cathode luminescence (CL) indicates changing sedimentary provenance for <strong>the</strong> quartz component.<br />
In <strong>the</strong> Wunger Ridge area, a plutonic provenance (i.e. Roma Granite) is dominating <strong>the</strong> drainage<br />
cell although <strong>the</strong>re is <strong>the</strong> influence of a metamorphic terrain (i.e. Timbury Hills Formation) and an<br />
ash fall. The rock is described using Folk’s (1974) classification as sub arkose–sub litharenite to<br />
quartz argentite (Appendix 10.6.2).<br />
Petrographic analysis has been conducted on what was previously lithologically described as a tuff<br />
in <strong>the</strong> Wunger Ridge area and appeared to be contemporaneous with <strong>the</strong> Showgrounds Sandstone.<br />
The tuff was tested as a potential late provenance of <strong>the</strong> Showgrounds Sandstone on <strong>the</strong> basis of<br />
similar quartz grains within <strong>the</strong> tuff. The analysis indicates that <strong>the</strong> tuff was misnamed and <strong>the</strong> rock<br />
is actually sandstone with high volcanic ash content.<br />
57
Significantly this information can be used to trace <strong>the</strong> back stepping Showgrounds Sandstone<br />
fur<strong>the</strong>r to <strong>the</strong> west than has previously been interpreted. The ash fall is likely to have dramatically<br />
increased <strong>the</strong> sediment supply during a comparatively short period of time, resulting in a locally<br />
well defined unit. The tuffaceous sandstone’s change in grain size may provide some of <strong>the</strong> best<br />
evidence for localised palaeo-flow direction as <strong>the</strong> grain size progressively increases toward <strong>the</strong><br />
source. Unfortunately time constraints of this project prevented this aspect from being assessed.<br />
Classification of rock samples using Folk’s (1974) classification indicates samples taken from<br />
sou<strong>the</strong>ast of <strong>the</strong> Wunger Ridge are litharenites (Appendix 10.6.2). The high proportion of rock<br />
fragments indicates that an older sedimentary/metamorphic terrain makes up a significant part of<br />
<strong>the</strong> drainage cell in that area. This is interpreted to indicate that <strong>the</strong> drainage cell, has less exposed<br />
Roma Granite to erode and provide sediment and <strong>the</strong>refore, is disconnected from <strong>the</strong> Wunger Ridge.<br />
Alternatively <strong>the</strong> sample could be from a minor tributary which entered <strong>the</strong> main fluvial system.<br />
Due to <strong>the</strong> characteristics of <strong>the</strong> catchment such as extent, elevation and orientation relative to<br />
prevailing rainfall, this minor tributary was unable to substantially alter <strong>the</strong> sedimentology of <strong>the</strong><br />
system. Given <strong>the</strong> distance and <strong>the</strong> inferred west-to-east palaeo-dip, <strong>the</strong> first scenario is considered<br />
more plausible.<br />
In <strong>the</strong> Wunger Ridge area, <strong>the</strong> collection and analysis of additional samples could test whe<strong>the</strong>r <strong>the</strong><br />
relative abundances of quartz provenances determined from petrography could be used to determine<br />
individual palaeo-drainage cells. If this was successful <strong>the</strong>re was <strong>the</strong> potential to improve <strong>the</strong><br />
robustness of <strong>the</strong> palaeoenvironmental interpretation (palaeogeographic maps, see section 6.4).<br />
However, for this study, it is considered that <strong>the</strong> work would not significantly alter <strong>the</strong> reservoir risk<br />
or uncertainty for CO 2 storage.<br />
Figure 6.13. Cross plots of permeability and porosity vs depth for Wunger Ridge samples. Uses a 60 API cut-off<br />
to show potential sandstone reservoir. The plots indicate that <strong>the</strong>re is no correlation between permeability or<br />
porosity and depth.<br />
To reduce <strong>the</strong> risk of drilling an injection well in an area that has poor injection and storage<br />
characteristics, an understanding of <strong>the</strong> distribution of porosity and permeability needs to be<br />
developed. To scope out possible porosity, permeability, depth and facies relationships, a subset<br />
of <strong>the</strong> well data has been analysed. Theoretically, <strong>the</strong>re is a direct relationship between porosity<br />
and permeability in that as porosity increases, permeability increases. Generally, as sedimentary<br />
rocks are buried to greater depths, diagenetic processes reduce <strong>the</strong> porosity by chemical and<br />
mechanical alteration.<br />
In contrast to <strong>the</strong>oretical trends <strong>the</strong>re is no relationship seen between porosity and depth across <strong>the</strong><br />
narrow depth range (i.e.1900–2400 m) of <strong>the</strong> Showgrounds Sandstone on <strong>the</strong> Wunger Ridge<br />
(Figure 6.13). Whilst <strong>the</strong>re is no relationship between sandstone porosity and depth, both porosity<br />
58
and permeability are sedimentary facies dependant (Figure 6.14). Both fluvial braided and<br />
meandering systems display good porosity/permeability correlation. As expected, floodplain facies<br />
show <strong>the</strong> lowest porosity/permeability values. Deltaic facies are highly variable and <strong>the</strong>refore less<br />
predictable. For example, <strong>the</strong>re is a positive correlation between good permeability (> 10 mD)/good<br />
porosity (> 10 %) and <strong>the</strong> sandstones in <strong>the</strong> braided and meandering fluvial system (Figure 6.14).<br />
Porosity vs. Permeability by Facies<br />
100000<br />
10000<br />
1000<br />
Permeability (mD)<br />
100<br />
10<br />
1<br />
0.1<br />
0.01<br />
0 5 10 15 20 25<br />
Porosity (%)<br />
Fluvial Braided Fluvial Lag Distributary-Deltaic Flood plain Fluvial meandering channel<br />
Figure 6.14. Cross plot of porosity vs permeability for Wunger Ridge facies type samples. Uses no GR cut-off.<br />
The cross-plot shows an apparent correlation between porosity (>10 %) and permeability (>10 mD) for <strong>the</strong> fluvial<br />
braided and meandering environments.<br />
Preliminary data analysis indicated that predicting <strong>the</strong> environment of deposition and <strong>the</strong> associated<br />
facies types would provide <strong>the</strong> most efficient means of predicting reservoir quality, and <strong>the</strong>refore<br />
reducing overall risk for potential injection sites.<br />
6.3.7. Core Interpretation<br />
Drill core from exploration wells provides one of <strong>the</strong> primary datasets that is used to verify <strong>the</strong><br />
palaeoenvironments and <strong>the</strong> porosity/permeability values interpreted from electrical log data.<br />
However core is not taken over <strong>the</strong> <strong>full</strong> bore length due to <strong>the</strong> cost involved. Therefore, it is<br />
necessary to integrate data which is taken over <strong>the</strong> <strong>full</strong> length of <strong>the</strong> bore, such as electrical log data<br />
(which measures <strong>the</strong> average electrical response of <strong>the</strong> lithology over a given interval) to core data,<br />
to give a high resolution insight over a particular zone of interest.<br />
The porosity and permeability data in well completion <strong>report</strong>s can be quality controlled through<br />
direct comparison to measurements made on <strong>the</strong> core. For example, it was observed at Tintara-1<br />
(Figures 4.2 and 6.3) that <strong>the</strong> permeability of <strong>the</strong> majority of <strong>the</strong> Showgrounds Sandstone ranges<br />
around 20–30 mD. A measured permeability of 151 mD was obtained from a core sample at a depth<br />
59
of 2303.15 m which correlated to a clean streak approximately 1–2 mm thick, interpreted to be a<br />
bedding plane.<br />
The core demonstrated that individual permeability readings may be related to millimetercentimetre<br />
scale isolated features in <strong>the</strong> rock ra<strong>the</strong>r than characteristic of <strong>the</strong> whole rock volume at<br />
<strong>the</strong> scale of an individual geological body such as a point bar. While an attempt to integrate<br />
permeability conduits and barriers at <strong>the</strong> core scale should be attempted, it is <strong>the</strong> accurate portrayal<br />
of <strong>the</strong> rock volume that <strong>the</strong> reservoir model attempts to represent.<br />
It is observed that, within <strong>the</strong> fluvial sandstones, <strong>the</strong> medium to coarse grain sandstones which are<br />
interpreted as proximal braided fluvial facies are <strong>the</strong> ones with <strong>the</strong> best porosity (7–22 %) and<br />
permeability (>1000 mD; Figure 6.14). Transgressive mouth bars tend to exhibit a regular but clay<br />
prone environment and represent <strong>the</strong> least suitable environment to target for injection and storage.<br />
Overall <strong>the</strong> examined core indicated that <strong>the</strong> highly permeable rock (>100 mD) is restricted to <strong>the</strong><br />
higher energy braided and meandering fluvial facies (Figure 6.14).<br />
Figure 6.15.East–west/south–north cross-section of <strong>the</strong> Wunger Ridge flank. Turns north–south at <strong>the</strong> Nardoo-1<br />
hinge point. The section is flattened on <strong>the</strong> top Snake Creek Mudstone. The wireline curve depicted is <strong>the</strong> Gamma<br />
Ray. Note <strong>the</strong> blocky nature and connectivity of <strong>the</strong> braided channels in Sirrah-5 and how <strong>the</strong> sandstone packages<br />
become vertically disconnected downdip towards <strong>the</strong> east and north (meandering – deltaic).<br />
60
Cores from wells located on <strong>the</strong> Wunger Ridge flank (Figure 4.2) tend to have a higher clay content<br />
and lower permeability. This may be due to a:<br />
• relative decrease in <strong>the</strong> amount of fluvial reworking and recutting by channels migrating across<br />
<strong>the</strong> channel belt as <strong>the</strong> amount of accommodation space increases;<br />
• sediment from an additional (less mature) source rock provenance entering <strong>the</strong> fluvial system<br />
down stream; or<br />
• reduced geochemical alteration, caused by reduced hydrodynamic processes.<br />
The first of <strong>the</strong>se options is <strong>the</strong> most likely because, as <strong>the</strong> accommodation space increases off-flank<br />
<strong>the</strong> preservation potential and <strong>the</strong> vertical separation of sandstone units increases, as more of <strong>the</strong><br />
finer grained facies are preserved, a feature evident in <strong>the</strong> core and well-logs (Figure 6.15).<br />
The Waggamba-1 well shows an example of a thicker section deposited in an area of increased<br />
accommodation space (i.e. 38 m of Showgrounds Sandstone). The Waggamba-1 core contains<br />
evidence that <strong>the</strong>re are two provenances which are preserved in <strong>the</strong> lower part, with rapid changes<br />
in shale content, colour and grain size (Figure 6.16), representing an alternating dominance between<br />
local granitic and metamorphic terrains .<br />
The Waggamba-1 core was one of <strong>the</strong> few cores which were interpreted to have a preserved<br />
lowstand systems tract of <strong>the</strong> Showgrounds Sandstone. In this core, <strong>the</strong> sandstone facies has better<br />
permeability (~ 150 mD), whilst <strong>the</strong> poorly sorted and texturally immature conglomerate has<br />
virtually no permeability.<br />
Based on structure maps, <strong>the</strong> lowstand systems tract of <strong>the</strong> Showgrounds Sandstone (Section 6.3.10<br />
-6.3.12) could be interpreted to occupy a roughly west–east orientated valley with <strong>the</strong> thickest<br />
section around Waggamba-1. Core observations from Tintara-1 and Teelba Creek-1 suggest <strong>the</strong>y<br />
are on <strong>the</strong> sou<strong>the</strong>rn edge of <strong>the</strong> lowstand system, (Figures 4.2, 6.3 and 6.15). There is an increase in<br />
thickness of <strong>the</strong> conglomerate from Tintara-1 toward Waggamba-1. This increase may indicate that<br />
Waggamba-1 is located towards <strong>the</strong> main axis of <strong>the</strong> palaeo-valley.<br />
Based on well intersections and orientation of regional structural trends such as faults and ridges, it<br />
was hypo<strong>the</strong>sised that <strong>the</strong> valley may turn slightly between Silver Springs field and Sirrah-5<br />
(Figures 4.2 and 6.3) to run approximately north–northwest to south–sou<strong>the</strong>ast before resuming <strong>the</strong><br />
east–west trend to <strong>the</strong> Waggamba-1 well.<br />
Teelba Creek-1 does not have any conglomerate in <strong>the</strong> core investigated. The sandstone facies<br />
displays poor permeability due to an increase in clay content compared to Harbour-1 (Figure 4.2<br />
and 6.3), which is in a more proximal position to <strong>the</strong> southwest. Teelba Creek-1 is interpreted to<br />
have intersected <strong>the</strong> sou<strong>the</strong>rn side of <strong>the</strong> palaeo-valley or an interfluve beyond <strong>the</strong> edge of <strong>the</strong><br />
conglomeratic fluvial system identified in <strong>the</strong> Tintara-1 and Waggamba-1 wells. As o<strong>the</strong>r wells<br />
along <strong>the</strong> flank of <strong>the</strong> Wunger Ridge to <strong>the</strong> south of <strong>the</strong> Waggamba-1 area are not interpreted to<br />
have intersected <strong>the</strong> facies observed at Waggamba-1 or Tintara-1, this absence suggests a roughly<br />
west-to-east trending conglomerate body which is laterally constrained in <strong>the</strong> north–south direction.<br />
In <strong>the</strong> wells along <strong>the</strong> Wunger Ridge, a nor<strong>the</strong>asterly trend of increasing vertical separation of<br />
interpreted sandstone facies is apparent, along with a reduction in grainsize, representing a<br />
corresponding reduction in energy in <strong>the</strong> system to <strong>the</strong> north (Figure 6.16). An example of this is <strong>the</strong><br />
difference in grainsize and bed thickness found in <strong>the</strong> fluvial–distributary channel facies of<br />
Namarah-2, which ranges from fine to coarse grained sandstone with bed thicknesses of 1–1.5 m<br />
(Figures 6.17 & 6.18), compared to <strong>the</strong> more proximal fluvial facies in Habour-1 and Sirrah-5;<br />
ranging from medium grained sandstone to conglomerate with bed thicknesses of approximately 3<br />
m (Figures 6.19–6.21).<br />
The fluvial–distributary channel facies interpretation for Namarah-2 is based on <strong>the</strong> presence of<br />
climbing ripples which is due to decelerating flow with an abundance of sediment indicative of a<br />
distributary systems entering standing bodies of water (sea/lake/pond, Boggs, 1995), and<br />
bioturbation, which is indicative of a deltaic, lacustrine environment (Miall, 1990).<br />
61
Figure 6.16. Photograph of Waggamba-1 core. Shows<br />
lowstand – late lowstand systems tract conglomerate<br />
and sandstone bedding. Cross bedding indicates<br />
traction current processes are operating indicating a<br />
fluvial environment. Not readily apparent in this<br />
photograph is <strong>the</strong> marked change between <strong>the</strong><br />
conglomerate and <strong>the</strong> sandstone indicating <strong>the</strong> system<br />
may have dual provenances (taken from BON, 1981).<br />
Figure 6.17. Photograph of Namarah-2 core. Shows<br />
Showgrounds Sandstone, an interpreted fluvial section.<br />
Diagenetic alteration has reduced <strong>the</strong> permeability<br />
whilst largely preserving <strong>the</strong> porosity at this location.<br />
Figure 6.18. Photograph of Namarah-2 core. Shows<br />
Showgrounds Sandstone, shoreface to delta distributary<br />
sandstone. Diagenetic alteration has reduced <strong>the</strong><br />
permeability whilst largely preserving <strong>the</strong> porosity at<br />
this location.<br />
Figure 6.19. Photograph of Harbour-1 core. Shows<br />
approximately one metre of high permeability (K)<br />
(with good porosity (Ø)) Showgrounds Sandstone cross<br />
bedded sandstone reservoir. The high quality reservoir<br />
generally thins from <strong>the</strong> Wunger Ridge. A comparison<br />
can be made from this location at Harbour-1 to that in<br />
Namarah-2 (Figures 6.19 & 6.20) to <strong>the</strong> north where<br />
<strong>the</strong> same porosity has orders of magnitude less<br />
permeability.<br />
62
Many of <strong>the</strong> wells in <strong>the</strong> central part of <strong>the</strong> Wunger Ridge have climbing ripples, however <strong>the</strong>y<br />
lack bioturbation in <strong>the</strong> core. Glenfosslyn-1 is an example of a well with climbing ripples in <strong>the</strong><br />
core (Figure 6.22) with no bioturbation. The absence of bioturbation indicates a lack of duration<br />
for <strong>the</strong> water body, or a significantly higher rate of sedimentation, which would not be a favourable<br />
environment for burrowing fauna. Based on this interpretation, <strong>the</strong> climbing ripples found in<br />
Glenfosslyn-1, most likely represent a crevasse splay infilling a laterally limited flood-plain lake,<br />
ra<strong>the</strong>r than a deltaic mouth bar infilling a large extensive permanent water body.<br />
The presence of lacustrine trace fossils in <strong>the</strong> Namarah-2 core (Figure 6.23) and increased shale<br />
content indicates an environment with lower fluvial sediment input than that taken from a similar<br />
stratigraphic position at Glenn Fosslyn-1. The implication is that Namarah-2 location is more distal<br />
to <strong>the</strong> palaeo-sediment source than <strong>the</strong> Glen Fosslyn-1 location to <strong>the</strong> sou<strong>the</strong>ast, and probably<br />
represents <strong>the</strong> approximate location of <strong>the</strong> shoreline of <strong>the</strong> Showgrounds Sandstone fluviodeltaic<br />
system (Figure 4.2).<br />
Sirrah 5 core has <strong>the</strong> best permeability in coarse sandstone and looks similar to <strong>the</strong> sandstone<br />
observed in <strong>the</strong> Silver Springs-1 and Yellowbank Creek North-1 core. The sandstone has coarse<br />
cross bedding which indicates traction currents are operating. Using <strong>the</strong> coarse grain size as a guide<br />
<strong>the</strong> system was flowing at a minimum of 0.5 metres-per-second (Boggs, 1995).<br />
The depositional system at Sirrah-5 is interpreted to be a braided fluvial sandstone with an<br />
approximate vertical height of nine metres. It appears from an investigation of <strong>the</strong> core that facies<br />
has a strong control on <strong>the</strong> porosity and permeability at this location (Figure 6.14). Well sorted<br />
braided fluvial sandstone has <strong>the</strong> better permeability (mostly multiple Darcy) whilst <strong>the</strong> poorly<br />
sorted braided fluvial conglomeratic facies has <strong>the</strong> lowest permeability (mostly less than 50 mD)<br />
(Figures 6.20, 6.21, 6.24 and 6.25). At Silver Springs <strong>the</strong> sandstone reservoir thickness ranges from<br />
about one metre to about eight metres across <strong>the</strong> field and is interpreted to be a fluvial braided<br />
facies, which is onlapping onto a palaeo high. In this facies <strong>the</strong> preserved thickness is largely<br />
controlled by <strong>the</strong> proximity of <strong>the</strong> palaeo highs as <strong>the</strong> braided fluvial system passed through palaeo<br />
valleys and o<strong>the</strong>r topographic lows and was terminated rapidly by a transgression (Figure 6.15 –<br />
Sirrah-5 well log).<br />
Observations from <strong>the</strong> core have confirmed that <strong>the</strong>re is a correlation between <strong>the</strong> environment of<br />
deposition and permeability. This suggests that using a sequence stratigraphic approach to produce<br />
a geological model should reduce <strong>the</strong> reservoir risk and help constrain or highlight <strong>the</strong> uncertainties<br />
for various potential injection sites. At <strong>the</strong> well-bore scale <strong>the</strong> environment of deposition should<br />
always be considered when interpreting <strong>the</strong> electrical logs particularly as an increase in gamma<br />
ray response does not necessarily represent a reduction of energy in <strong>the</strong> depositional environment.<br />
Generally <strong>the</strong> permeability declines northward along <strong>the</strong> Wunger Ridge area due to an increase in<br />
clay content (reduction in energy), <strong>the</strong> presence of carbonate cement and <strong>the</strong> hydro<strong>the</strong>rmal alteration<br />
of feldspar grains. The increase in clay content can be predicted with a facies map developed from<br />
<strong>the</strong> interpretation of core and electrical log data, however at this point in time no model has been<br />
developed to predict areas of elevated carbonate cementation and hydro<strong>the</strong>rmal alteration o<strong>the</strong>r than<br />
to observe that <strong>the</strong> risk appears to be greater in <strong>the</strong> north.<br />
63
Figure 6.20. Photograph of Sirrah-5 core. Depicts a<br />
low permeability baffle which is related to a<br />
conglomeratic facies in Sirrah-5. The conglomerate<br />
appears poorly sorted with cross bedding which<br />
indicates traction processes. This has been interpreted<br />
to indicate a fluvial environment. The core indicates<br />
permeability is facies controlled at this location (Taken<br />
from BON, 1989).<br />
Figure 6.21. Photograph of Sirrah-5 core. Depicts <strong>the</strong><br />
Showgrounds Sandstone. Cross bedding indicates<br />
traction current processes typical of a fluvial system.<br />
In this case interpreted to be a braided system<br />
(Taken from BON, 1989).<br />
Figure 6.22. Photograph of Glen Fosslyn-1 core.<br />
At <strong>the</strong> top of <strong>the</strong> figure is a wave modified ripple in<br />
<strong>the</strong> Showgrounds Sandstone indicating shallow semi<br />
open–open water (wr). In <strong>the</strong> middle of <strong>the</strong> figure is a<br />
set of climbing ripples (cr) indicating decelerating flow<br />
characteristic of processes where by a moving body of<br />
water is entering a standing body of water such as<br />
mouth bars and crevasse splays. In this case <strong>the</strong> lack<br />
of bioturbation would suggest a crevasse lake or a very<br />
active mouth bar.<br />
Figure 6.23. Photograph of Namarah-2 core.<br />
Shows <strong>the</strong> vertical (v )and horizontal (h) bioturbation<br />
concentrated in <strong>the</strong> shale prone section within <strong>the</strong><br />
Showgrounds Sandstone at Namarah-2. The presence<br />
of bioturbation is an indicator of relatively long term<br />
or well connected water bodies.<br />
64
Figure 6.24. Core description of <strong>the</strong> Sirrah-5 core. Shows an overall fining upwards fluvial system.<br />
The low permeability conglomerate beds have not been documented on this log. Photographs from<br />
1947.90–1948.20 m which appear in Figure 6.24 highlight what is missing from <strong>the</strong> above log.<br />
This shows <strong>the</strong> value of re-examining core to solve specific problems (taken from BON, 1989).<br />
65
Figure 6.25. Core plug analysis for Sirrah-5. Shows <strong>the</strong> basic measurements that are measured from core plugs<br />
obtained from <strong>the</strong> core. The measurements have been taken from a braided fluvial system. In this case <strong>the</strong> low<br />
permeability “baffle” (1947.9–1949.1 m) was related to a poorly sorted conglomerate bed (taken from BON, 1989).<br />
6.3.8. Electrical Well-Log to Core Comparison<br />
Petroleum exploration companies normally run electrical logs in all wells drilled. This gives<br />
companies a better understanding of <strong>the</strong> subsurface and an idea of rock properties such as, density,<br />
interval transit time or sound propagation (sonic), and radioactivity (gamma ray (GR)). Well logs<br />
are cheaper than drill-cores and <strong>the</strong>refore <strong>the</strong>re are more electrically logged bore holes than cored<br />
66
oreholes. Depositional processes interpreted from core can be compared to <strong>the</strong> GR and sonic log<br />
responses to interpret palaeo electro-facies (Figure 6.26).<br />
The GR log is a measurement of <strong>the</strong> natural radioactivity of <strong>the</strong> formations. In sedimentary<br />
formations <strong>the</strong> log normally reflects <strong>the</strong> shale content of <strong>the</strong> formations. This is because <strong>the</strong><br />
radioactive elements tend to concentrate in clays and shales. Clean formations (e.g. sandstone)<br />
usually have a very low level of radioactivity (Schlumberger, 1989). Therefore, <strong>the</strong> GR curve is<br />
related to core via shale content where <strong>the</strong> cleaner or less shale prone <strong>the</strong> lithology <strong>the</strong> lower <strong>the</strong><br />
GR reading.<br />
Glen Fosslyn well dispay<br />
0 GR 200 2000 0.2 25 0 140 40 1.95 2.65<br />
DT<br />
Nphi ( φ)<br />
us/ft<br />
Reversed<br />
Nphi<br />
Normal<br />
Rhob<br />
(density)<br />
Showgrounds Sandstone<br />
Neutron/Density<br />
crossover<br />
Total<br />
φ<br />
Rewan<br />
Formation<br />
Permeability<br />
from core<br />
Porosity<br />
from core<br />
Core interval<br />
Grain density<br />
from core<br />
60 API<br />
cut off<br />
05-267-1<br />
Figure 6.26. Well log display from Glen Fosslyn-1 covering <strong>the</strong> Showgrounds Sandstone. The display compares<br />
data measured from core such as grain density, porosity and permeability to electrically derived<br />
log data such as Gamma Ray (GR), Neutron porosity (Nphi), Density (Rhob), Velocity (DT), and Self Potential<br />
(SP). Plotting all <strong>the</strong> data toge<strong>the</strong>r allows a rapid method for quality controlling <strong>the</strong> data and for forming an<br />
understanding of <strong>the</strong> relationships between permeability, porosity and neutron–density cross-over.<br />
This <strong>report</strong> will not elaborate on <strong>the</strong> shape of <strong>the</strong> GR curve beyond three basic profiles or log<br />
motifs. Along with core data to determine <strong>the</strong> scale of an individual or a single stacked channel<br />
sequence, <strong>the</strong> shape of <strong>the</strong> GR vertical profile can be used to interpret <strong>the</strong> palaeoenvironment that<br />
<strong>the</strong> wellbore penetrated. In a non-marine sequence a “blocky” GR profile in this area is indicative<br />
of a braided fluvial system (Figure 6.27). An upward increase of GR units (upward fining profile)<br />
is indicative of a meandering fluvial system (Figure 6.28 and 6.29). An upward decrease of GR<br />
units (upward coarsening profile) is indicative that a distributary process is occurring which could<br />
be anything from a crevasse splay with an area of a few hundred square metres, to a delta plain up to<br />
tens of square kilometres in area (Figure 6.30 and 6.31).<br />
67
Figure 6.27. Idealised braided fluvial facies<br />
and grainsize profile (right) and corresponding<br />
gamma ray profile (left). (After Kassan and Lang, 1999).<br />
Figure 6.28. Photograph of Harbour-1 core. Depicts<br />
<strong>the</strong> fining upward section, which indicates an<br />
upward reduction of energy at <strong>the</strong> bed scale. This has<br />
been interpreted as a meandering fluvial sequence.<br />
Note that if only <strong>the</strong> interval 1987–1988m is<br />
considered <strong>the</strong>n it might be interpreted as a braided<br />
system.<br />
Figure 6.29. Idealised meandering fluvial facies<br />
and grainsize profile (right) and corresponding<br />
gamma ray profile (left). (After Kassan & Lang, 1999).<br />
68
Figure 6.30. Photograph of Rednook-1 core.<br />
Depicts a coarsening upwards section, interpreted<br />
as a lacustrine deltaic sequence.<br />
Figure 6.31. Example of <strong>the</strong> facies profile for a fluvially<br />
dominated lacustrine delta. Profile has a similar<br />
thickness scale to that found in <strong>the</strong> nor<strong>the</strong>rn area of <strong>the</strong><br />
Wunger Ridge. Note <strong>the</strong> vertically disconnected sand<br />
bodies. (After Bohac, 2002).<br />
Very high energy systems with heterogeneous lithologies and high shale content may also have a<br />
fairly high GR count and <strong>the</strong>refore apparently upward decreasing GR readings may be<br />
misinterpreted. For instance rip up clasts in <strong>the</strong> lower part of <strong>the</strong> channel where <strong>the</strong> energy of <strong>the</strong><br />
fluvial channel is at a maximum will increase <strong>the</strong> GR reading in <strong>the</strong> thalweg leading to an erroneous<br />
interpretation of environment (e.g. false coarsening upward section 2370–2385 m in Waggamba-1;<br />
Figure 6.15). For this reason care needs to be taken in areas where <strong>the</strong>re is a transition in<br />
environment of deposition or where <strong>the</strong>re is an absence of core. In such areas it is important to<br />
spend significant time examining well cuttings descriptions and associated data to determine<br />
palaeoenvironment.<br />
Note that <strong>the</strong> GR log alone cannot be used to determine lithology particularly within<br />
intercontinental basins where coals are developed, because like sandstones <strong>the</strong>y are represented by<br />
a low GR response. In such cases <strong>the</strong> sonic log is used to differentiate coal (coals show slower sonic<br />
values) from sandstone lithologies. Shale and sandstone are determined from locally derived gamma<br />
ray cut-offs based on <strong>the</strong> analysis of core, porosity and permeability data. For instance <strong>the</strong> sandstone<br />
must have interconnected pores to be considered as a potential reservoir for <strong>the</strong> injection and<br />
storage of CO 2 .<br />
This study sets <strong>the</strong> sandstone reservoir GR maximum at around 50–60API units based on direct<br />
measurements of rock properties from core plugs (porosity and permeability data), and or<br />
neutron- density values, which provides an estimate of porosity (Figure 6.26). Even though <strong>the</strong> GR<br />
count will vary depending on <strong>the</strong> purpose of <strong>the</strong> analysis, for this study, <strong>the</strong> term sandstone is used<br />
for a unit with <strong>the</strong> above GR response.<br />
6.3.9. Petrophysics<br />
Data from approximately 20 wells was collated and forwarded to a consulting petrophysicist to<br />
conduct basic petrophysical analysis to aid in <strong>the</strong> development of building representative geological<br />
models. The quality and quantity of <strong>the</strong> data used for this analysis varied, but included:<br />
GR, resistivity, calliper, density, sonic, neutron, and formation micro-scanner logs, as well as fluid<br />
and rock properties. Results from this work included calculations of effective porosity, net reservoir<br />
thickness, shale volume, total porosity, water saturation, permeability, and volume of clay bound<br />
water. Petrophysical analyses for <strong>the</strong> wells are included in Appendix 10.6.4.<br />
69
Table 6.3. Porosity and net reservoir thickness of <strong>the</strong> Showgrounds Sandstone.<br />
Well<br />
Depth of top<br />
reservoir<br />
mKb<br />
Net Showgrounds<br />
Sandstone Reservoir (m)<br />
0.5 Vcl > res > 0.08por<br />
Bellbird-1 2263 13.9 0.1<br />
Bungarie-1 2314 17.9 0.091<br />
Glen Fosslyn-1 2078.7 5 0.181<br />
Inglestone-1 2748.1 4.8 0.088<br />
Kinkabilla Creek-1 2697 43.1 0.139<br />
Namarah-3 2157.4 4.6 0.113<br />
Namarah-5 2153.5 4.05 0.148<br />
Namarah-6 2176.5 4.8 0.104<br />
Nardoo-1 1946.5 6.6 0.118<br />
Renlim-1 1888.6 8.1 0.14<br />
Sirrah-5 1940 10.9 0.151<br />
Taylor-3 2008.2 1.6 0.118<br />
Taylor-5 2000 10.8 0.151<br />
Taylor-7 1985.5 5.4 0.134<br />
Taylor-9 2013.5 2.6 0.15<br />
Taylor-11 2023.7 1.65 0.098<br />
Tinker-2 2100.4 0 0<br />
Tinker-3 2080.7 0 0<br />
Weribone-East-1 2145.4 4.2 0.097<br />
Effective porosity<br />
(dec)<br />
6.3.10. Showgrounds- Snake Creek Mudstone Stratigraphy<br />
The Showgrounds Sandstone generally unconformably overlies metamorphic and igneous rocks or<br />
<strong>the</strong> Triassic Rewan Formation. The Showgrounds Sandstone is differentiated from <strong>the</strong> underlying<br />
Rewan Formation on <strong>the</strong> basis of:<br />
• a change in sedimentary provenance, which is reflected as a colour change from <strong>the</strong><br />
dominantly green Rewan Formation to <strong>the</strong> grey Showgrounds Sandstone;<br />
• clasts of green Rewan Formation sourced rock above <strong>the</strong> unconformable surface inferring<br />
that <strong>the</strong>re is a time gap between <strong>the</strong> deposition of <strong>the</strong> Rewan Formation and <strong>the</strong><br />
unconformity;<br />
• an increase in <strong>the</strong> amount of energy which is reflected as an increased grain size in <strong>the</strong><br />
lower Showgrounds Sandstone, and<br />
• <strong>the</strong> presence of an unconformity at <strong>the</strong> base of <strong>the</strong> Showgrounds Sandstone which is<br />
generally seen in core as an erosional surface.<br />
Using a sequence stratigraphic approach, <strong>the</strong> Showgrounds Sandstone and Snake Creek Mudstone<br />
are interpreted to belong to one depositional cycle (Figure 6.32). Using this method to interpret <strong>the</strong><br />
main Showgrounds Sandstone fluvial unit, a braided and meandering fluvial and deltaic system can<br />
develop coevally or as lateral equivalents across an area.<br />
The sequence begins with a relative reduction in accommodation space (regression) which forms or<br />
enhances an eroded surface in <strong>the</strong> west. This event is recorded by an unconformity on top of which<br />
a lag deposit of coarse grained material is deposited. East of <strong>the</strong> Wunger Ridge, <strong>the</strong> late lowstand<br />
systems tract event is recorded by a texturally immature deposit of conglomerate, probably<br />
deposited in a palaeo-valley. On <strong>the</strong> Wunger Ridge, <strong>the</strong> absence of accommodation space has<br />
precluded <strong>the</strong> deposition and/or preservation of <strong>the</strong> lowstand deposits.<br />
70
Figure 6.32. Relative palaeo-water level curve. Depicts which systems tracts were developed for <strong>the</strong><br />
Showgrounds Sandstone, Snake Creek Mudstone and <strong>the</strong> Moolayember Formation.<br />
This lowstand facies is interpreted to have limited potential for <strong>the</strong> purpose of CO 2 injection and<br />
storage due to:<br />
• absence of permeability in <strong>the</strong> conglomerate, due generally to poor sorting and high clay<br />
content, and<br />
• high degree of vertical heterogeneity of <strong>the</strong> lithology, interpreted to indicate a dual sediment<br />
source provenance and depositional factors (e.g. variations in energy and space).<br />
Following <strong>the</strong> lowstand systems tract, an increase in relative accommodation (transgression)<br />
occurred. As <strong>the</strong> transgression progressed, initially, mostly fluvial facies were deposited, probably<br />
during <strong>the</strong> late lowstand to earliest transgressive systems tract (Figure 6.32). During this period, <strong>the</strong><br />
fluvial system is interpreted to have reached its maximum lateral extent. Towards <strong>the</strong> east of <strong>the</strong><br />
Wunger Ridge a minor transgressive event appears to have occurred during this late lowstand to<br />
earliest transgressive system, which is recorded in some wells as very finely laminated lacustrine<br />
shale which looks similar to <strong>the</strong> Snake Creek Mudstone (Figure 6.33).<br />
The lowstand systems tract is overlain by a late lowstand to very early transgressive fluvial to<br />
deltaic system. It is this system which this study interprets to contain Butchers (1984) units 1 and<br />
2 and has <strong>the</strong> highest reservoir quality, thickness and extent.<br />
Subsequent to <strong>the</strong> fluvial system, <strong>the</strong> late–mid transgressive deltaic facies were deposited and are<br />
interpreted to be <strong>the</strong> upper Showgrounds Sandstone. Finally this is overlain by <strong>the</strong> mid-transgressive<br />
lacustrine shale generally known as <strong>the</strong> Snake Creek Mudstone which represents <strong>the</strong> maximum<br />
71
flooding surface and completes <strong>the</strong> cycle (Figure 6.32). The mid transgressive systems tract is<br />
where <strong>the</strong> maximum rate of accommodation space has occurred, with <strong>the</strong> rate of relative water level<br />
rise reaching a maximum, as <strong>the</strong> Snake Creek Mudstone lacustrine system inundated <strong>the</strong> landscape,<br />
completely covering <strong>the</strong> previously deposited Showgrounds Sandstone. The Snake Creek Mudstone<br />
is a very homogeneous, finely laminated (sometimes appears massive) dark grey to black shale and<br />
is considered to be <strong>the</strong> primary sealing lithology (Figure 6.34).<br />
Figure 6.33. Photograph of Glen Fosslyn-1 core.<br />
Shows intra-Showgrounds Sandstone shale that<br />
sits within <strong>the</strong> fluvial Showgrounds Sandstone that<br />
has been interpreted as a minor transgressive<br />
event. The shale can be seen on <strong>the</strong> gamma ray log<br />
at this well and at a number of o<strong>the</strong>r locations as<br />
well<br />
Figure 6.34. Photograph of Yellowbank Creek<br />
North-1 core. Shows <strong>the</strong> rapid transgression of <strong>the</strong><br />
Showgrounds Sandstone by <strong>the</strong> Snake Creek<br />
Mudstone in <strong>the</strong> Wunger Ridge area (Taken from<br />
Reeve, et al., 1988).<br />
Core taken from <strong>the</strong> Wunger Ridge area shows no evidence of a retrograding shoreline (shoreface<br />
and barrier complexes) associated with <strong>the</strong> transgressive surface. It has been interpreted that this<br />
apparently rapid transgression indicates a very flat transgressive surface ra<strong>the</strong>r than a significant<br />
reduction of fluvial input.<br />
Subsequent to <strong>the</strong> deposition of <strong>the</strong> mid transgressive Snake Creek Mudstone, <strong>the</strong> Moolayember<br />
Formation represents <strong>the</strong> late transgressive to early highstand systems tract. In <strong>the</strong> study area, <strong>the</strong><br />
Moolayember Formation is an upward coarsening and shallowing sequence of stacked deltas<br />
building out into <strong>the</strong> Snake Creek Lake. For this study <strong>the</strong> lower part of <strong>the</strong> Moolayember<br />
Formation is considered to be a secondary sealing lithology.<br />
6.3.11. Reservoir Prediction and distribution: Vertical and lateral Facies Extent and<br />
Connectivity.<br />
Sedimentary facies are influenced by <strong>the</strong> relief gradient, type of sediment, distance from <strong>the</strong><br />
sediments source area, <strong>the</strong> rate of accommodation space formation and <strong>the</strong> proximity to a standing<br />
body of water. Along <strong>the</strong> Wunger Ridge it is apparent from core and electrical log analysis that <strong>the</strong><br />
preservation of vertically connected (multi-story) sandstone bodies is controlled by <strong>the</strong> ratio<br />
between sediment supply versus amount of accommodation space at <strong>the</strong> location.<br />
Analysis of multi-channel fill thickness by environment of deposition data indicates that <strong>the</strong> greatest<br />
sandstone accumulations are associated with <strong>the</strong> fluvial braided and meandering systems (Figure<br />
6.35). The lower end of <strong>the</strong> meandering system is associated with vertically unconnected low<br />
energy flood-plain channel systems. Generally <strong>the</strong> preserved thickness of <strong>the</strong> braided system is<br />
72
associated with <strong>the</strong> increase in total net accommodation associated with <strong>the</strong> transgression event and<br />
palaeo-valley thickness (Figure 6.35).<br />
A reduced vertical thickness of sandstone bodies associated with deltaic mouth bars and deltaic<br />
distributary channels (Figure 6.35) are interpreted to be due to a number of factors including:<br />
• <strong>the</strong> increasing amount of relative accommodation space, leading to an increase in <strong>the</strong><br />
preservation of shale and <strong>the</strong>refore, an increase in vertical heterogeneity;<br />
• a significant reduction in energy of <strong>the</strong> system, as it becomes less confined and approaches<br />
a standing water body, leading to a relative increase in shale content, and<br />
• <strong>the</strong> distributary processes <strong>the</strong>mselves through local changes in gradient redistribute<br />
sediment into new areas once a gradient threshold is exceeded which produces increasingly<br />
vertically disconnected sand bodies at increasing distances away from <strong>the</strong> head of <strong>the</strong> delta.<br />
The delta systems (lateral equivalents to <strong>the</strong> braided Showgrounds Sandstone) are interpreted here,<br />
as being deposited in a lake as opposed to open marine conditions <strong>report</strong>ed by Butcher 1984.<br />
100.00<br />
Wunger Area Environment vs. multi channnel thickness<br />
10.00<br />
thickness (m)<br />
1.00<br />
0.10<br />
0.01<br />
0 1 2 3 4 5 6 7 8<br />
sa m ple<br />
deltaic distributary Deltaic mouthbar Fluvial Braided<br />
Fuvial Braided very coarse-conglmrt Fluvial braided sandy Fluvial meandering<br />
Fluvial splay<br />
Figure 6.35. Multi-channel thickness vs. sedimentary environment cross-plot. Depicts <strong>the</strong> range in accumulated<br />
deposits for different facies in <strong>the</strong> Wunger Ridge area.<br />
73
Figure 6.36. Width-to-thickness ratio chart used to predict <strong>the</strong> likely lateral extent of fluvial sand bodies. Uses<br />
vertical well intersections extracted from various data, and based on <strong>the</strong> observation of fluvial channel belt<br />
morphologies (Strong, et al., 2002).<br />
In <strong>the</strong> Wunger Ridge area, <strong>the</strong> fluvial braided systems vertical thickness is controlled by<br />
accommodation where <strong>the</strong> lower values are associated with areas close to palaeo-highs along <strong>the</strong><br />
Wunger Ridge and fluvial lags in <strong>the</strong> feeder valleys. The braided system is a high energy system<br />
which is continually eroding into itself such that even though accommodation space is being<br />
developed any shale which is deposited as <strong>the</strong> channel is abandoned, is removed when <strong>the</strong> channel<br />
system reinhabits <strong>the</strong> local area. This produces a deposit of vertically and horizontally well<br />
connected sandstones.<br />
Channel width-to-thickness ratio prediction charts (Figure 6.36) derived from analogue data can be<br />
used to estimate <strong>the</strong> potential range in <strong>the</strong> width of channel systems from observations of channel<br />
thickness observed from core and interpretation of electro facies (Strong, et al., 2002). Based on a<br />
fluvial multi-channel stack thickness of 8–9 m <strong>the</strong> active channel belt width is likely to be in <strong>the</strong><br />
range of 1-4 km (Figures 6.35 & 6.36). The predicted spread of <strong>the</strong> channel belt width from wells<br />
which have a vertical thickness of connected sandstone of between 4–8 m gives a range of 1–3 km<br />
indicating that <strong>the</strong>re are multiple, but essentially parallel active channels in <strong>the</strong> area (Figures 6.35 &<br />
6.36).<br />
74
The interpretation of multiple channel belts suggests that lateral connectivity of sand facies would<br />
be high within <strong>the</strong> 1–4 km range across <strong>the</strong> channel belt, but beyond that distance, a semi regional<br />
inter-channel flood plain may act as a large semi regional scale baffle (Figure 6.36). Using this data<br />
reservoir quality and connectivity of <strong>the</strong> Showgrounds Sandstone has been predicted across <strong>the</strong><br />
Wunger Ridge flank by interpreting palaeoenvironments from wells and creating palaeogeography<br />
maps of <strong>the</strong> flank.<br />
6.3.12. Showgrounds Sandstone Reservoir Prediction and Distribution<br />
Palaeogeographic maps represent an instantaneous snap shot in time of a <strong>the</strong>oretical landscape<br />
which attempts to represent a vertical aggregate of environments over some period of geological<br />
time (Figures 6.37–6.38). In this case <strong>the</strong> four maps represent four critical phases in <strong>the</strong> depositional<br />
history of <strong>the</strong> Showgrounds Sandstone (LST, Early TST, Mid TST,HST). Such maps should be<br />
viewed more as probability maps where <strong>the</strong> authors interpret that particular palaeoenvironments on<br />
<strong>the</strong> map have a higher probability of existing in that place over o<strong>the</strong>r palaeoenvironments.<br />
Data and interpretations obtained from cores were extrapolated to wells which did not have core via<br />
<strong>the</strong> interpretation of electrical logs obtained from <strong>the</strong> wells. In this way, a more complete dataset<br />
was used to interpret <strong>the</strong> palaeoenvironment. In turn, this dataset was combined with width-tothickness<br />
ratios, dipmeter data, pressure data and seismic data to produce <strong>the</strong> palaeogeographic<br />
maps (Figures 6.39–6.42). The interpreted southwest to nor<strong>the</strong>ast reduction in energy of <strong>the</strong> fluvial<br />
system has been incorporated into <strong>the</strong> palaeogeographic map, and represented by a change in <strong>the</strong><br />
fluvial style.<br />
In <strong>the</strong> southwest part of <strong>the</strong> study area <strong>the</strong>re is a dominantly braided fluvial system that would be<br />
laterally well connected. Here <strong>the</strong> grain size of <strong>the</strong> fluvial system is at a maximum, <strong>the</strong> log motif is<br />
blocky, <strong>the</strong> shale content within <strong>the</strong> sandstone is at its lowest and <strong>the</strong> section has <strong>the</strong> lowest<br />
preserved shale. The absence of shale content hinders <strong>the</strong> formation of stable banks and leads to a<br />
braided fluvial system dominating <strong>the</strong> area (Boggs, 1995; Figure 6.38).<br />
In <strong>the</strong> nor<strong>the</strong>ast part of <strong>the</strong> study area, <strong>the</strong> fluvial environment experiences a reduction in (energy)<br />
slope as <strong>the</strong> fluvial system begins to react to <strong>the</strong> presence of a standing body of water to <strong>the</strong> east<br />
(Miall, 1990). The evidence comes from a reduction in grain size, a change from a blocky GR motif<br />
to an upward fining motif and an increase in <strong>the</strong> preservation of shale over <strong>the</strong> interval. A product of<br />
<strong>the</strong> process is a change in fluvial style to a meandering system. The transition from braided system<br />
which typically has multiple active unrestricted channels to a meandering fluvial system that has far<br />
fewer active channels, leads to a deepening of <strong>the</strong> remaining dominant channels (Boggs, 1995;<br />
Figure 6.37). An increase in shale content enables <strong>the</strong> formation of stabilised banks and helps to<br />
deepen <strong>the</strong> fluvial system which produces a deeper water column with a vertical and lateral<br />
segregation of flow (energy), which forms eddies on encountering obstacles, and helical flow as <strong>the</strong><br />
flow changes direction (Boggs, 1995). It is helical flow which form point bars typical of <strong>the</strong><br />
meandering system (Boggs, 1995).<br />
75
Point-bar complex within a meandering fluvial channel system<br />
Figure 6.37.Generic diagram of point-bar complex from <strong>the</strong> Mississippi River. Shows <strong>the</strong> relationships<br />
between <strong>the</strong> deposits of actively migrating channels and <strong>the</strong> dominantly muddy infills of closed<br />
abandoned channels. Vertical exaggeration unknown but significant (After Jordan & Pryor, 1992).<br />
Longitudinal bar<br />
Transverse<br />
bar<br />
06-028-5<br />
Figure 6.38. Block diagram of a fluvial braided channel. Depicts sandstone with high vertical and lateral<br />
connectivity (From Boggs, 1995, modified from Galloway & Hobday, 1983).<br />
76
Beyond <strong>the</strong> meandering system, a deltaic system is interpreted with four main elements: a fairly<br />
straight distributary channel system, mouth bars, intra distributary flood plain and bays. Generally<br />
speaking, <strong>the</strong>re is an increase in grain size as <strong>the</strong> rate of fluvial discharge increases as an individual<br />
delta lobe develops and progrades into <strong>the</strong> water body (<strong>Read</strong>ing, 1996). Over all, <strong>the</strong> deltas backstep<br />
as <strong>the</strong>y get younger (higher) which is evidenced as a decrease in grain size and vertical height<br />
(<strong>Read</strong>ing, 1996).<br />
The original environment of deposition appears to have a strong influence on <strong>the</strong> porosity and more<br />
importantly permeability of <strong>the</strong> Showgrounds Sandstone in <strong>the</strong> Wunger Ridge area. Based on <strong>the</strong><br />
interpretation of <strong>the</strong> environment, and o<strong>the</strong>r data, <strong>the</strong> palaeogeographic maps indicate that areas<br />
between Mireeka-1 and Waggamba-1 have relatively lower reservoir and seal risk (Figures 4.2 and<br />
6.39–6.42).<br />
In <strong>the</strong> meandering system <strong>the</strong> sandstone facies has a range in permeability of up to 1000 mD. For<br />
instance, in <strong>the</strong> well Glen Fosslyn-1 core data indicates that <strong>the</strong> point bar sandstone facies has a<br />
permeability between 100–1000 mD. The gross heterogeneity of <strong>the</strong> fluvial meandering system<br />
caused by <strong>the</strong> preservation of clay within <strong>the</strong> abandonment channels, would suggest that a greater<br />
number of baffles would preferentially help trap CO 2 in <strong>the</strong> fluvial meandering system than <strong>the</strong><br />
braided system (Figure 6.38). The risk of drilling an injection well into a shale plug or an<br />
unconnected point bar that would reduce <strong>the</strong> ultimate injection rate can be reduced by drilling a<br />
horizontal well along strike.<br />
6.4. Containment Potential: Implications for CO 2 Storage<br />
6.4.1. Seal Distribution and Continuity<br />
The presence of a well defined Snake Creek Mudstone intersected in wells located along <strong>the</strong><br />
western flank of <strong>the</strong> Taroom Trough, indicates that a wide-spread fairly uniform shale deposit<br />
exists. The Snake Creek Mudstone unit pinches out along <strong>the</strong> western flank and passes laterally into<br />
a siltier unit along <strong>the</strong> eastern edge of <strong>the</strong> Taroom Trough. At <strong>the</strong> scale of this project <strong>the</strong> unit<br />
effectively covers <strong>the</strong> entire area of interest. Thickness of this seal in <strong>the</strong> outer wells Overston-1,<br />
Kinkabilla Creek-1, Kinkabilla-1 and Ingleston-1 suggests that it does not vary significantly from<br />
that on <strong>the</strong> Wunger Ridge itself. The thinness of <strong>the</strong> Snake Creek Mudstone (< 40 m) does not<br />
permit an adequate representation of <strong>the</strong> member based on seismic data.<br />
77
Figure 6.39. Interpretation of palaeogeography/environment of deposition of <strong>the</strong> Showgrounds Sandstone<br />
lowstand systems tract.<br />
78
c)<br />
148°00'<br />
148*20'<br />
148°40'<br />
27°20'<br />
?<br />
?<br />
Model area<br />
27°40'<br />
Approx. direction<br />
of sediment flow<br />
Metamorphic basement<br />
Over-bank and channel flood plain<br />
05-267-5<br />
0 20 km<br />
Approximate granitic basement<br />
Deltaic<br />
Braided and major channel belt<br />
Marginal lacustrine to lacustrine<br />
Braided channel bar, meandering river and crevasse splay<br />
Small scale transgression<br />
Figure 6.40. Interpretation of palaeogeography/environment of deposition of <strong>the</strong><br />
Showgrounds Sandstone early transgressive systems tract.<br />
d)<br />
148°00'<br />
148*20'<br />
148°40'<br />
27°20'<br />
Model area<br />
27°40'<br />
Approx. direction<br />
of sediment flow<br />
Metamorphic basement Over-bank and channel flood plain<br />
0 20 km<br />
05-267-6<br />
Approximate Granitic basement<br />
Deltaic<br />
Braided and major channel belt<br />
Lacustrine<br />
Braided channel bar, meandering river and crevasse splay<br />
Figure 6.41. Interpretation of palaeogeography/environment of deposition of <strong>the</strong><br />
Showgrounds Sandstone mid transgressive systems tract.<br />
79
Figure 6.42. Interpretation of palaeogeography/environment of deposition of <strong>the</strong> Snake Creek Mudstone highstand<br />
systems tract. Fading to towards <strong>the</strong> east represents increased uncertainty of seal quality due to increased influence<br />
of sediment shedding off <strong>the</strong> volcanic arc.<br />
The seismic-based isopach map of <strong>the</strong> secondary seal ‘Moolayember Formation’ suggests that <strong>the</strong><br />
thickness of <strong>the</strong> Moolayember Formation ranges from 50–250 m over <strong>the</strong> Wunger Ridge to 600-<br />
900 m towards <strong>the</strong> Taroom Trough. This variation is due to:<br />
• <strong>the</strong> erosional truncation of <strong>the</strong> upper Moolayember Formation from west-to-east. This would<br />
suggest that <strong>the</strong> Moolayember Formation was significantly thicker across <strong>the</strong> Wunger Ridge<br />
and flank prior to Basin inversion in <strong>the</strong> early Jurassic (i.e. equivalent base Surat Basin time),<br />
and<br />
• continued subsidence within <strong>the</strong> Taroom Trough depocentre towards <strong>the</strong> eastern margin.<br />
6.4.2. Seal Capacity<br />
MICP (Mercury Injection Capillary Porosimeter) analyses of samples of <strong>the</strong> Snake Creek Mudstone<br />
Wunger Ridge, Bowen Basin from Harbour-1 and Hollow Tree-1 were performed by <strong>the</strong> Australian<br />
School of Petroleum.<br />
Table 6.4. Sample numbers and location of where seal samples were taken from.<br />
Year Depth Taken<br />
Sample Well Name Well Meters Feet Formation Sample<br />
No.<br />
Drilled<br />
From<br />
H1977 Harbour-1 1987 1976.7 6485 Snake Ck mst half core<br />
HT1804b Hollow Tree-1 1987 1804.2 5919 Tuff half core<br />
HT1803 Hollow Tree-1 1987 1803 5915 Tuff half core<br />
H1987 Hollow Tree-1 1987 1802.5 5914 Snake Ck mst half core<br />
MICP data are used to determine threshold or break through pressure used in <strong>the</strong> interpretation of<br />
<strong>the</strong> carbon dioxide retention height of sealing rocks. The supercritical carbon dioxide retention<br />
heights for <strong>the</strong> Snake Creek Mudstone ranges from 490 to 910 m with <strong>the</strong> retention height of <strong>the</strong><br />
interbedded tuffaceous rocks ranging from 4 to 1300 m.<br />
80
The ductility and compressibility of <strong>the</strong> mudstone constitutes a good sealing lithology, whereas <strong>the</strong><br />
tuffaceous rocks are more susceptible to fracturing as a result of bed thinness and brittleness. The<br />
samples were taken from old dry core that could reduce <strong>the</strong> interpreted results in MICP analysis. As<br />
such seal retention heights may exceed those measured.<br />
These results suggest that <strong>the</strong> Snake Creek Mudstone, <strong>the</strong> overlying sealing unit to <strong>the</strong><br />
Showgrounds Sandstone, is capable of withholding a substantial column of CO 2 at least equal to <strong>the</strong><br />
interpreted structural height of <strong>the</strong> Wunger Ridge flank (~800 m). The Moolayember Formation has<br />
to date not been tested for seal capacity.<br />
The tuffaceous sandstone unit is not critical to sealing CO 2 within <strong>the</strong> Showgrounds Sandstone. It is<br />
a lateral, more tuffaceous extension of <strong>the</strong> Showgrounds Sandstone (see Petrography, Appendix<br />
10.6.2). The variable sealing nature of <strong>the</strong> tuffaceous lithology unit within <strong>the</strong> Showgrounds<br />
Sandstone should not contribute to <strong>the</strong> leakage risk for migrating CO 2 . Instead <strong>the</strong> tuffaceous part of<br />
<strong>the</strong> Showgrounds Sandstone should provide a significant baffle, restricting <strong>the</strong> flow of CO 2 towards<br />
<strong>the</strong> pinchout edge, thus dispersing potential sudden pressure changes on <strong>the</strong> Snake Creek Mudstone.<br />
For <strong>the</strong> <strong>full</strong> details of <strong>the</strong> MICP analysis including methodology and <strong>full</strong> results see Appendix<br />
10.6.5.<br />
6.5. Geomechanical Modelling<br />
No geomechanical modelling was performed as resources were not available.<br />
6.6. Hydrodynamic Modelling<br />
6.6.1. Introduction<br />
The interpretation of hydrodynamic data for this study is based on publicly available data. Current<br />
well pressure and production volume data remains confidential to <strong>the</strong> field operator and has not<br />
been used in this work, precluding detailed history matching to quality control <strong>the</strong> data analysis and<br />
subsequent interpretation.<br />
Data from 69 wells was entered into a database to characterise <strong>the</strong> hydrodynamic conditions,<br />
production effects, and vertical and lateral communication across <strong>the</strong> entire Wunger Ridge area.<br />
The formation pressure data for this study came from two sources. The first being formation<br />
pressures from drill stem tests (DST’s) and wireline formation tests (WFT) measured in <strong>the</strong> well<br />
bore at <strong>the</strong> time of drilling. All formation pressures were passed through a comprehensive quality<br />
control system before use.<br />
The Triassic Showgrounds Formation is at <strong>the</strong> base of <strong>the</strong> aquifers of <strong>the</strong> Great Artesian Basin<br />
(GAB), (Habermehl, 2002), however, due to its depth and <strong>the</strong> presence of more easily accessible<br />
freshwater above, it is not an active water resource. It is separated from <strong>the</strong> nearest active aquifer,<br />
<strong>the</strong> Jurassic Precipice Sandstone, which is both an important and active water resource, by <strong>the</strong><br />
Triassic Moolayember Group, one of <strong>the</strong> major confining units of <strong>the</strong> GAB sequence (Habermehl,<br />
2002). The hydrodynamic flow system of <strong>the</strong> Jurassic aquifers of <strong>the</strong> GAB are reasonably well<br />
understood, however <strong>the</strong>re have has been little examination of <strong>the</strong> hydrodynamics of <strong>the</strong> Triassic<br />
reservoirs to date.<br />
The Snake Creek Mudstone sealing unit lies at <strong>the</strong> base of <strong>the</strong> Moolayember Group. The lithology,<br />
thickness and <strong>the</strong> lack of hydrocarbon shows in <strong>the</strong> Moolayember Group within <strong>the</strong> study area<br />
makes it a secondary seal for storage within <strong>the</strong> Showgrounds Sandstone and a barrier to vertical<br />
migration within <strong>the</strong> study area. The interpretation of hydrodynamic data suggests that within <strong>the</strong><br />
greater Wunger Ridge area, <strong>the</strong> Showgrounds Sandstone is not in hydraulic communication with<br />
overlying fresh water aquifers, in particular <strong>the</strong> Precipice Sandstone.<br />
A detailed <strong>report</strong> describing <strong>the</strong> hydrodynamics is attached in Appendix 10.6.3.<br />
81
6.6.2. Pre-production Flow System<br />
Recharge flow from <strong>the</strong> Great Dividing Range in <strong>the</strong> north east is directed south towards <strong>the</strong><br />
Wunger Ridge (Figure 6.43). Along <strong>the</strong> ridge itself, flow remains broadly southwards and <strong>the</strong><br />
hydraulic gradient is quite flat, suggesting a low flow rate. What is not visible on <strong>the</strong> contours,<br />
due to <strong>the</strong> data sparsity is <strong>the</strong> influence of <strong>the</strong> basement highs that project through <strong>the</strong> Showgrounds<br />
Formation, as at between <strong>the</strong> Renlim and Silver Springs fields (Tucker, 1989). Along <strong>the</strong> western<br />
flank of <strong>the</strong> ridge, flow is parallel to <strong>the</strong> zero edge of <strong>the</strong> Showgrounds Formation.<br />
Flow from across <strong>the</strong> south-western Bowen Basin area is directed into a hydraulic low trending<br />
southwest across <strong>the</strong> study area (Figure 6.43). The lowest value is defined by Teelba Creek-1<br />
(140 m), but <strong>the</strong> discharge point of this feature is uncertain. The possibility exists that it extends to<br />
<strong>the</strong> east across <strong>the</strong> thickest and most permeable part of <strong>the</strong> basin to <strong>the</strong> Moonie Fault where it may<br />
move vertically up into <strong>the</strong> Precipice Sandstone. Wells in <strong>the</strong> area were examined to test this<br />
hypo<strong>the</strong>sis, however no suitable data was available.<br />
There were several regional pieces of evidence which suggested <strong>the</strong> more likely direction of<br />
discharge was to <strong>the</strong> south as shown. The hydrodynamic setting of <strong>the</strong> Bowen and Surat basins<br />
shows regional discharge is directed toward <strong>the</strong> south-west and secondly, <strong>the</strong> low lies within an area<br />
of high permeability described by Tucker (1989).Thirdly, <strong>the</strong> presence of a second large basement<br />
high, <strong>the</strong> Yarrandine high (Rigby, 1987) located to <strong>the</strong> east of <strong>the</strong> hydraulic low provides <strong>the</strong><br />
possibility of a high transmissivity feature and finally, <strong>the</strong> presence of a regionally relatively low<br />
hydraulic head value at Grail North-1 (315 m). The western side of <strong>the</strong> hydraulic low is similarly<br />
confined by high hydraulic head values along <strong>the</strong> continuing zero edge of <strong>the</strong> Showgrounds<br />
Formation.<br />
The flow in <strong>the</strong> pre-production flow system (dark green flow arrow Figure 6.43) is directed almost<br />
at right angles to <strong>the</strong> predicted migration pathway direction of injected CO 2 (red arrow Figure 6.43).<br />
The flow rate within this system is also low at 0.2 m/yr measured across <strong>the</strong> predicted migration<br />
pathway. This is based on an assumption of 150 mD across <strong>the</strong> area. Increasing <strong>the</strong> permeability to<br />
1000 mD would increase <strong>the</strong> flow rate locally to approximately 1.3 m/yr. Given <strong>the</strong> relatively low<br />
structural gradient it is likely that <strong>the</strong> direction of movement of CO 2 will continue to be controlled<br />
by buoyancy and facies distribution. Theoretically <strong>the</strong> original flow system would act to deflect <strong>the</strong><br />
migration toward <strong>the</strong> south as <strong>the</strong> pressure system is restored as injection of CO 2 continued. To<br />
qualify this requires driving force vector analysis (DFVR) to be undertaken which will form <strong>the</strong><br />
basis for <strong>the</strong> next stage of this study.<br />
6.6.3. Post-production Flow System<br />
Although <strong>the</strong>re is little data available post 1993 to predict <strong>the</strong> current flow system and determine <strong>the</strong><br />
radial extent of <strong>the</strong> production induced drawdown <strong>the</strong>re is some data available for <strong>the</strong> period<br />
between 1986 and 1991 at both <strong>the</strong> centre of production along <strong>the</strong> axis of <strong>the</strong> ridge and fur<strong>the</strong>r out<br />
into <strong>the</strong> basin (Figure 6.44).<br />
The ridge data is confined to <strong>the</strong> sou<strong>the</strong>rn end of <strong>the</strong> Wunger Ridge, <strong>the</strong>re being no data available<br />
for recent wells drilled at <strong>the</strong> nor<strong>the</strong>rn end. This is also <strong>the</strong> site of maximum production and where<br />
<strong>the</strong> pressure decline is interpreted to be <strong>the</strong> greatest (~550 psi up to 1991) (Figure 6.44). Recent data<br />
is also confined to wells drilled on <strong>the</strong> western side of <strong>the</strong> hydraulic low described previously, as <strong>the</strong><br />
only wells available are located on <strong>the</strong> eastern side around <strong>the</strong> Waggamba field pre-date production.<br />
The data indicates that production induced pressure decline has extended for a considerable distance<br />
away from <strong>the</strong> producing fields and out into <strong>the</strong> deeper parts of <strong>the</strong> basin. This is interpreted to have<br />
significantly modified <strong>the</strong> hydraulic gradient across <strong>the</strong> area (Figure 6.44).<br />
82
148:30<br />
149:00<br />
149:30<br />
N<br />
Depth toTop Permian<br />
400<br />
NAMARAH 1<br />
426, G, III (rewa)<br />
1981<br />
NTH BOUNDARY 1<br />
337, GW, IV<br />
1994<br />
LARK 1<br />
336, GC, IV (rewa)<br />
1993<br />
TINKER 3<br />
369, CM, I,(rewa)_<br />
1989<br />
GLEN FOSSLYN 1<br />
-27:30 400<br />
351, GC, IV<br />
359,G, III<br />
-27:30<br />
DONGA 1<br />
323, ?, (C)<br />
268, ?, (B)<br />
1965<br />
(MOOL)<br />
ELGIN 1<br />
334, ?, (B)<br />
1965<br />
(MOOL)<br />
360<br />
340<br />
SILVER SPRINGS 8<br />
271, MW, IV<br />
1981<br />
SILVER SPRINGS 1<br />
BOXLEIGH 3 346, G, II<br />
RENLIM 2<br />
315, G, II 1979<br />
216, GC, IV<br />
1979<br />
1983<br />
BEECHWOOD 2<br />
1988<br />
77, OM, III, (rewa)<br />
1980<br />
380 380<br />
320<br />
360<br />
340<br />
340<br />
380<br />
360<br />
320<br />
400<br />
Zero Edge of Snake Creek Mudstone<br />
5 10 20 kms<br />
-28:00 -28:00<br />
148:30<br />
149:00<br />
149:30<br />
320<br />
400<br />
340<br />
360<br />
380<br />
380<br />
360<br />
340<br />
320<br />
300<br />
300<br />
Figure 6.43.Pre-production flow system of <strong>the</strong> Showgrounds Sandstone.<br />
83
148:30<br />
149:00<br />
149:30<br />
N<br />
Depth toTop Permian<br />
?<br />
NAMARAH 1<br />
426, G, III (rewa)<br />
1981<br />
NTH BOUNDARY 1<br />
337, GW, IV<br />
1994<br />
LARK 1<br />
336, GC, IV (rewa)<br />
1993<br />
TINKER 3<br />
369, CM, I,(rewa)_<br />
1989<br />
?<br />
GLEN FOSSLYN 1<br />
-27:30 351, GC, IV<br />
359,G, III<br />
-27:30<br />
DONGA 1<br />
323, ?, (C)<br />
268, ?, (B)<br />
1965<br />
(MOOL)<br />
ELGIN 1<br />
334, ?, (B)<br />
1965<br />
(MOOL)<br />
SILVER SPRINGS<br />
8, 1989<br />
(Tucker)<br />
SILVER SPRINGS 8<br />
271, MW, IV<br />
1981<br />
SILVER SPRINGS 1<br />
BOXLEIGH 3 346, G, II<br />
1979<br />
RENLIM 2<br />
315, G, II<br />
216, GC, IV<br />
1979<br />
1983<br />
-50<br />
0<br />
BOXLEIGH<br />
-72, 1989<br />
50<br />
(Tucker)<br />
BEECHWOOD 2<br />
1988<br />
77, OM, III, (rewa)<br />
1980<br />
100<br />
150<br />
250<br />
200<br />
Zero Edge of Snake Creek Mudstone<br />
5 10 20 kms<br />
-28:00 -28:00<br />
148:30<br />
149:00<br />
149:30<br />
Figure 6.44. Modified flow system for ~1990.<br />
84
The only recent well with reasonable data is located at <strong>the</strong> sou<strong>the</strong>rn end of <strong>the</strong> ridge at North<br />
Sirrah-1. This well was spudded in 1991 and has a hydraulic head value of -69 m. Taylor-14 had a<br />
relatively high hydraulic head value of 276 m in 1989. The Taylor-14 well was drilled off structure<br />
and is interpreted to have intersected an hydraulically isolated low permeability zone. On <strong>the</strong><br />
western side of <strong>the</strong> ridge, slight drawdown effects have been noted at Glenearn North-1 and at<br />
Lynrock-2.<br />
The most recent of <strong>the</strong> wells on <strong>the</strong> eastern flank is Louise-1, drilled in 1985. This well is<br />
interpreted to have a hydraulic head of 263 m which implies a drop of approximately 120 m over six<br />
years of Wunger Ridge hydrocarbon production. Examination of Figure 6.44 shows that <strong>the</strong> group<br />
of wells around Louise-1 seem to show differential drawdown rates. As <strong>the</strong>se wells are quite close<br />
toge<strong>the</strong>r both spatially and chronologically, <strong>the</strong> reason for <strong>the</strong> spread in data may be reflective of<br />
permeability variations. Tucker (1989) describes a “sweet spot” area of high permeability, which<br />
includes Captain Cook-1 and Kippers-1, but excludes Louise-1 and Narrows-1. The data suggests<br />
that <strong>the</strong> influence of pressure reduction due to approximately 12 years production had extended at<br />
least 16.5 km into <strong>the</strong> basin to Captain Cook-1 and Louise-1 by <strong>the</strong> late 1980’s, with significant<br />
reduction in hydraulic head values. The overall effect will be to redirect flow up to <strong>the</strong> ridge from<br />
<strong>the</strong> deeper parts of <strong>the</strong> basin towards <strong>the</strong> low at Silver Springs/Renlim.<br />
The recalculated flow rate towards this point is 0.9 m/year (based on 150 mD) and this may affect<br />
both <strong>the</strong> speed and direction of movement of injected CO 2 as flow would be redirected along <strong>the</strong><br />
predicted CO 2 path. Although <strong>the</strong>re is no data currently available, production from <strong>the</strong> nor<strong>the</strong>rn end<br />
of <strong>the</strong> ridge has been underway since 1993 and it is likely that <strong>the</strong>re has been some pressure<br />
reduction from here also, which may produce a competing effect drawing <strong>the</strong> CO 2 to <strong>the</strong> north,<br />
away from <strong>the</strong> predicted path.<br />
Since 1990 <strong>the</strong>re has been continued production from fields in both <strong>the</strong> nor<strong>the</strong>rn and sou<strong>the</strong>rn ends<br />
of <strong>the</strong> Wunger Ridge and it is likely that in reality <strong>the</strong> current flow system may be more extreme<br />
than that shown on <strong>the</strong> map and <strong>the</strong> induced hydraulic gradient maybe even steeper.<br />
6.6.4. Hydraulic Communication<br />
Significant drawdown of pressure detected in wells drilled approximately 16.5 km away from <strong>the</strong><br />
sou<strong>the</strong>rn production within 12 years of initial production indicates regional scale connectivity and<br />
transmissivity. Although <strong>the</strong> hydrodynamic model assumed a uniform regional connectivity, <strong>the</strong><br />
facies model indicates that this is unlikely to be <strong>the</strong> case. It is more likely that <strong>the</strong> pressure effects<br />
are focused along zones of high permeability.<br />
A northward trend of increasing reservoir heterogeneity can be interpreted geologically.<br />
A northward trend of increasing hydraulic pressure disconnectedness within <strong>the</strong> Showgrounds<br />
Sandstone can be interpreted from some of <strong>the</strong> DST results which show evidence of depleting<br />
reservoirs over <strong>the</strong> time scale of <strong>the</strong> test or localised isolation from <strong>the</strong> greater aquifer system such<br />
as at Taylor-14. Production from this area indicates volumes in <strong>the</strong> order of 100–450 million cubic<br />
metres gaseous hydrocarbons are able to be accessed although some fields have produced less than<br />
40 million cubic metres implying a lack of reservoir continuity within <strong>the</strong> area mapped above <strong>the</strong><br />
interpreted gas-water contact. This implies that in some areas local connectivity with <strong>the</strong> greater<br />
aquifer may be limited particularly towards <strong>the</strong> nor<strong>the</strong>rn part of <strong>the</strong> Wunger Ridge (Figures 6.45 and<br />
6.46).<br />
85
500<br />
Waggamba/Yellowbank Ck<br />
Boxleigh/Thomby Ck<br />
Renlim/Silver Springs<br />
Sirrah/Fairymount/McWhirter<br />
Louise/Narrows (Re)<br />
Taylor<br />
Beechwood/East Glen/Nth Boxleigh/Roswin<br />
Namarah (Re)/Parknook (Re)/TInker (Re)<br />
Glen Fosslyn/Lark/Warroon<br />
Link/Major<br />
400<br />
300<br />
Hydraulic Head (m)<br />
200<br />
100<br />
0<br />
-100<br />
MOOL REWA SHOW PREP EVER PERMIAN<br />
-200<br />
1960<br />
1962<br />
1965<br />
1968<br />
1971<br />
1973<br />
1976<br />
1979<br />
1982<br />
1984<br />
1987<br />
1990<br />
1993<br />
1995<br />
1998<br />
Spud Date<br />
Figure 6.45. Head vs spud data for wells sub-divided into formation.<br />
500<br />
Waggamba/Yellowbank Ck<br />
Boxleigh/Thomby Ck<br />
Renlim/Silver Springs<br />
Sirrah/Fairymount/McWhirter<br />
Louise/Narrows (Re)<br />
Taylor<br />
Beechwood/East Glen/Nth Boxleigh/Roswin<br />
Namarah (Re)/Parknook (Re)/TInker (Re)<br />
Glen Fosslyn/Lark/Warroon<br />
Link/Major<br />
400<br />
300<br />
Hydraulic Head (m)<br />
200<br />
100<br />
0<br />
-100<br />
Area 1 (south) Area 2 (north) Area 3 (flank)<br />
-200<br />
1960<br />
1962<br />
1965<br />
1968<br />
1971<br />
1973<br />
1976<br />
1979<br />
1982<br />
1984<br />
1987<br />
1990<br />
1993<br />
1995<br />
1998<br />
Spud Date<br />
Figure 6.46. Head vs spud data for wells.<br />
Sub-divided into: i) along <strong>the</strong> Wunger Ridge, south of <strong>the</strong> zero edge of <strong>the</strong> Rewan Formation, ii) along <strong>the</strong> Wunger Ridge,<br />
north of <strong>the</strong> zero edge of <strong>the</strong> Rewan Formation, and iii) off <strong>the</strong> ridge and into <strong>the</strong> basin.<br />
86
Rewan Formation- Showgrounds Sandstone<br />
At <strong>the</strong> nor<strong>the</strong>rn end of <strong>the</strong> Wunger Ridge, production is from ei<strong>the</strong>r or both <strong>the</strong> Showgrounds<br />
Formation or <strong>the</strong> underlying Rewan Formation. There is some suggestion of communication<br />
between <strong>the</strong> units, although this is difficult to confirm as all of <strong>the</strong> wells except one are considered<br />
production affected. At Link-1, DSTs were taken in both <strong>the</strong> Showgrounds and <strong>the</strong> Rewan<br />
Formation, both having <strong>the</strong> same hydraulic head value suggesting that <strong>the</strong> Showgrounds is in<br />
hydraulic communication with <strong>the</strong> Rewan Formation at this location. This well was drilled soon<br />
after production began from <strong>the</strong> Rewan Formation at <strong>the</strong> nearby Tinker Field. The Rewan<br />
Formation data points indicate reduced pressure, potentially due to production from <strong>the</strong> fields to<br />
<strong>the</strong> south, which are beyond <strong>the</strong> zero edge of <strong>the</strong> Rewan Formation.<br />
Showgrounds Sandstone- Precipice Formation<br />
The western edge of <strong>the</strong> hydraulic low coincides with <strong>the</strong> location of <strong>the</strong> zero edge of both <strong>the</strong><br />
Snake Creek Mudstone and <strong>the</strong> Showgrounds Sandstone, near <strong>the</strong> Major field (located some distant<br />
west of <strong>the</strong> Wunger Ridge) and forms <strong>the</strong> only point of potential communication between <strong>the</strong><br />
Showgrounds Sandstone and <strong>the</strong> Precipice Sandstone. The Major field is located 25 km to <strong>the</strong> west<br />
of <strong>the</strong> first line of structures (comprising <strong>the</strong> Wunger Ridge) that a migrating CO 2 front would<br />
encounter. Comparison of <strong>the</strong> two maps indicates that <strong>the</strong> hydraulic head values in <strong>the</strong> Precipice<br />
Sandstone are very similar to those in <strong>the</strong> Showgrounds Sandstone. In addition, <strong>the</strong>re are two<br />
hydraulic head values from Elgin-1 (334 m) and Donga-1 (323 m) measured in sands within <strong>the</strong><br />
Moolayember Group. Both of <strong>the</strong>se values were taken from Scorer, 1966, and <strong>the</strong> raw data was not<br />
available for examination, however, both are very similar, within gauge error, to <strong>the</strong> hydraulic head<br />
values seen at <strong>the</strong> edge of <strong>the</strong> Showgrounds Sandstone, and very similar to those contours<br />
interpreted by Scorer (1966) for <strong>the</strong> overlying Precipice Formation. The similarity of <strong>the</strong>se points<br />
suggests that <strong>the</strong>re may be a small component of flow between <strong>the</strong>se units, however <strong>the</strong> vertical<br />
direction is not clear and <strong>the</strong> hydraulic low is channelling <strong>the</strong> bulk of <strong>the</strong> water away from this edge<br />
and out to <strong>the</strong> south of <strong>the</strong> study area. Examination of <strong>the</strong> composite logs for Major-1, 2, 3, and 4<br />
indicate that hydrocarbons have managed to penetrate <strong>the</strong> lower sand prone units of <strong>the</strong><br />
Moolayember Formation. Drill stem tests conducted over <strong>the</strong> hydrocarbon shows indicate a lack of<br />
hydrocarbon volume and poor permeability. However no hydrocarbons have been detected in sand<br />
prone units in <strong>the</strong> upper Moolayember Formation<br />
6.6.5. Water Salinity<br />
The salinity data for <strong>the</strong> Showground Sandstone indicate that <strong>the</strong> salinity is approximately 6000–<br />
9200 ppm NaCl. This level of water salinity is suitable for stock suggesting that saline aquifers of<br />
<strong>the</strong> greater Wunger Ridge area could be considered as a resource. As <strong>the</strong>re is superior quality water<br />
within <strong>the</strong> Great Artesian Basin above <strong>the</strong> Moolayember Formation, storing CO 2 in <strong>the</strong> Showground<br />
Sandstone reservoir is unlikely to conflict with future water extraction activities in <strong>the</strong> area.<br />
The water in <strong>the</strong> overlying Precipice Formation is predominantly fresh, although <strong>the</strong>re are some<br />
local variations (Hitchon, 1971). Hitchon (1971) shows a salinity distribution map for <strong>the</strong> Precipice<br />
Sandstone, showing that salinities range from higher than 3,000 ppm in <strong>the</strong> west, near <strong>the</strong> discharge<br />
region, to less than 1000 ppm in <strong>the</strong> nor<strong>the</strong>ast towards <strong>the</strong> recharge region.<br />
6.6.6. Analysis of Results<br />
The original predominant flow direction on <strong>the</strong> eastern side of <strong>the</strong> flank is southwest at a rate of<br />
approximately 0.2 m/yr using an 150 mD or 1.3 m/yr using 1000mD average permeability. This is<br />
almost at right angles to <strong>the</strong> predicted migration pathway of injected CO 2 and means <strong>the</strong> potential<br />
for hydrodynamic trapping is limited and flow will be dominated by buoyancy effects. It may have<br />
an effect of deflecting <strong>the</strong> CO 2 south, but <strong>the</strong> degree is unknown at this time.<br />
The Wunger Ridge has been a producing area for nearly 30 years and some fields have undergone<br />
significant pressure depletion. The radial extent of this depletion is unclear, but it is appears to<br />
extend down <strong>the</strong> flank and out into <strong>the</strong> deeper parts of <strong>the</strong> basin. A current day (1998) production<br />
87
affected flow rate has been calculated at 0.9 m/yr (assuming a permeability of150 mD) to 5.9 m/yr<br />
(assuming a permeability of 1000 mD). This switches <strong>the</strong> flow direction away from <strong>the</strong> discharge<br />
direction and up onto <strong>the</strong> ridge. The formation water is interpreted to be broadly moving in <strong>the</strong> same<br />
direction as <strong>the</strong> predicted migration pathway and hence migration of CO 2 along this path may be<br />
faster than initially predicted.<br />
Once <strong>the</strong> flow system has re-equilibrated after production ceases, injected CO 2 will migrate<br />
generally updip under buoyancy drive. However, <strong>the</strong> presence of a flow path across <strong>the</strong> migration<br />
pathway may allow some component of <strong>the</strong> CO 2 displaced water to migrate in this direction and act<br />
as a pressure dissipation mechanism.<br />
6.6.7. Fur<strong>the</strong>r Work<br />
The next stage in understanding <strong>the</strong> impact of <strong>the</strong> formation water flow system in <strong>the</strong> Showgrounds<br />
Formation on injected CO 2 is to understand <strong>the</strong> current day flow system. This will provide<br />
information about <strong>the</strong> potential for a deflection of <strong>the</strong> predicted CO 2 migration path and <strong>the</strong> relative<br />
timing required for <strong>the</strong> aquifer to return to its original state. This requires more detailed production<br />
data from petroleum companies operating in <strong>the</strong> area. Unfortunately it is unlikely this information<br />
would be made available prior to <strong>the</strong> fields exhaustion. When <strong>the</strong> data in terms of static gradient<br />
tests, wellhead pressures, etc becomes available this must be coupled with a mass balance<br />
calculation.<br />
6.7. Reservoir Model and Simulation<br />
6.7.1. Introduction<br />
Coarse-scale geological models based on a smoo<strong>the</strong>d structure map and approximate reservoir<br />
parameters were used as inputs to <strong>the</strong> reservoir simulations (Figure 6.40). The coarse scale allowed<br />
changes to reservoir saturations and pressures and CO 2 migration rates to be related to specific<br />
parameter changes. The coarse scale geological model approach allowed: 1) <strong>the</strong> range of results<br />
from reservoir simulation runs to constrain an outer bound of possibilities for CO 2 migration rates,<br />
and 2) initial results to be viewed so as to better scope reservoir simulation for <strong>the</strong> finer scale<br />
geological models. The detailed reservoir engineering <strong>report</strong> can be found in Appendix 10.6.7.<br />
6.7.2. Model Description<br />
A coarse scale 3D reservoir model was constructed for simulation study (Figures 6.47b to d).<br />
The total number of grid blocks was 9600 (Nx = 64, Ny = 25, Nz = 6), with cell sizes in <strong>the</strong> x, y<br />
and z direction being 460, 400 and 1.167 m, respectively. The coarse scale 3D model has a one<br />
degree structural gradient, estimated from <strong>the</strong> average gradient of <strong>the</strong> seismic-based depth map<br />
(Figure 6.3). The model area is rectangular in shape (10×29.5 km 2 , Figure 6.40) and was divided<br />
into two equal parts: 1) medium-porosity and medium-permeability (i.e. 150 mD) that occurs in <strong>the</strong><br />
eastern part of <strong>the</strong> reservoir and, 2) high-porosity (20%) and high-permeability (i.e. 1000 mD) that<br />
occurs in <strong>the</strong> western part. The top of <strong>the</strong> reservoir rises 800 m from east-to-west (Figure 6.47d),<br />
and although <strong>the</strong> formation thickness varies within <strong>the</strong> reservoir (i.e. ~ 3–17 m), a constant reservoir<br />
thickness of 7 m is used based on average thickness. A cross-section through <strong>the</strong> model shows<br />
medium permeability and low vertical connectivity in <strong>the</strong> eastern part of <strong>the</strong> reservoir (Figure<br />
6.47c). A simple checker-board pattern was used to model <strong>the</strong> permeability distribution in an<br />
attempt to include some degree of geological heterogeneity in <strong>the</strong> reservoir (Figure 6.47b).<br />
Six aquifers that surround <strong>the</strong> model area are represented in <strong>the</strong> simulator using an analytical<br />
method (Carter & Tracy, 1960), although it is known that analytical models are weak in modelling<br />
reservoir fluids flowing back to <strong>the</strong> aquifer (i.e. <strong>the</strong>y account only for water flow at <strong>the</strong><br />
aquifer/reservoir boundary with CO 2 remaining in <strong>the</strong> reservoir). In such cases, <strong>the</strong> use of aquifers<br />
represented numerically ra<strong>the</strong>r than analytically is preferred, which requires a large number of grid<br />
blocks in a reservoir simulation.<br />
88
For a simplified model, as used in this study, it is preferred to use an analytical model to represent<br />
<strong>the</strong> six surrounding different aquifers ra<strong>the</strong>r than adding additional grid blocks, which is almost<br />
impossible for all aquifers because of computational limitations. For <strong>the</strong> first model run, <strong>the</strong> initial<br />
condition for <strong>the</strong> reservoir was assumed to be at hydrostatic pressure with <strong>the</strong> total aquifer volume<br />
approximated by <strong>the</strong> six regions surrounding <strong>the</strong> reservoir (Figure 6.47d), with model permeabilities<br />
shown averaged from well data. Communication of <strong>the</strong> aquifer within <strong>the</strong> surroundings of <strong>the</strong> model<br />
area was also demonstrated in <strong>the</strong> study of Tucker (1989).<br />
Tables 6.4-6.6 give a summary of <strong>the</strong> reservoir, rock and fluid properties, and it was assumed that<br />
only saline water is present at <strong>the</strong> onset of injection. The fluid properties of CO 2 were obtained for<br />
corresponding reservoir pressure and temperature based on <strong>the</strong> work of Span and Wagner (1996).<br />
The van Genuchten (1980) model proposed by Preuss et al., (2002) for <strong>the</strong> CO 2 /brine system, which<br />
represents <strong>the</strong> drainage of brine by CO 2 , was used to determine multiphase flow. Experimental data<br />
on multiphase flow properties (e.g. relative permeability and capillary pressure) for this model are<br />
not available.<br />
A two-phase GASWATER option of <strong>the</strong> IMEX TM black oil simulator was used to model an<br />
immiscible displacement of reservoir brine with CO 2 . Dissolution effects of CO 2 in brine, as well as<br />
chemical reactions of CO 2 with <strong>the</strong> solid phase (rock matrix) were not considered in this study.<br />
Simulations of 1000 years were run as <strong>the</strong> aim was to examine <strong>the</strong> CO 2 injectivity and to track CO 2<br />
migration after <strong>the</strong> injection ceased. Wells were centrally located in <strong>the</strong> grid blocks and not<br />
modelled comprehensively. Thus, <strong>the</strong> injection rates determined represent those for locations ra<strong>the</strong>r<br />
than for a specified wellbore. The number of actual wells required may increase depending on <strong>the</strong><br />
wellbore geometry.<br />
6.7.3. Simulation Scenarios<br />
Table 6.7 summarises <strong>the</strong> different injection cases with different numbers of vertical and horizontal<br />
wells under various conditions. In Case 1, we simply changed <strong>the</strong> location of a single vertical<br />
injector in <strong>the</strong> high permeability part of <strong>the</strong> model area (Figures 6.47c), while keeping all o<strong>the</strong>r<br />
parameters constant and examined <strong>the</strong> maximum injection rates. The results show that none of <strong>the</strong><br />
single injectors reach <strong>the</strong> proposed injection rate of 1.2 Mt/y (rate of CO 2 emissions from a<br />
hypo<strong>the</strong>tical 200-MW coal-fired power station), so that additional wells are required to get <strong>the</strong> best<br />
combined rate (Q total -Figure 6.47). A vertical injector located away from <strong>the</strong> low-permeability<br />
aquifers and regions seems to be optimal for good injectivity: it can also be argued that <strong>the</strong> wells<br />
located at shallower depths have higher injectivity in case 1. Care has to be taken with <strong>the</strong> aquifer<br />
description to understand <strong>the</strong> behaviour of those wells located at <strong>the</strong> numerical reservoir–analytical<br />
aquifer boundary where CO 2 outflow is not modelled because of <strong>the</strong> problems related to <strong>the</strong><br />
inclusion of analytical aquifers in <strong>the</strong> simulator as explained previously.<br />
Increasing <strong>the</strong> injection bottom-hole pressure up to 90% of <strong>the</strong> fracture gradient (Case 2) clearly<br />
improves <strong>the</strong> injectivity relative to Case 1 (Table 6.7) such that <strong>the</strong> required rate of 1.2 Mt/y is<br />
achieved. Locating a single injector in <strong>the</strong> medium-permeability part of <strong>the</strong> reservoir (Case 3) for<br />
<strong>the</strong> same conditions, however, results in lowered injectivity to such an extent that assuming no well<br />
interference, in <strong>the</strong> order of 9–10 wells would be required to achieve <strong>the</strong> target injection rate.<br />
The injection rate is also reduced considerably when geological heterogeneity is included through<br />
a checker-board patterned permeability distribution (Figure 6.47b) to values that are about half <strong>the</strong><br />
proposed injection rate (Case 4, Table 6.7). The injectors located in <strong>the</strong> middle of <strong>the</strong> high<br />
permeability model area have more favourable injection rates than for o<strong>the</strong>r locations. This proves<br />
that inclusion of geological heterogeneity is significant in <strong>the</strong> determination of CO 2 injectivity.<br />
89
Figure 6.47.(a) Generic model profile (not to scale) of lithologies, sedimentary environments and trapping<br />
mechanisms of <strong>the</strong> Showgrounds Sandstone present within <strong>the</strong> model area. Top lacustrine shale layer represents<br />
<strong>the</strong> Snake Creek Mudstone regional seal (thickness ~ 15–30 m). (b) Plan view of modelled permeabilities used in<br />
reservoir simulation Cases 4, 6, 8 and 9. (c) Profile view of modelled permeabilities used in reservoir simulation<br />
Cases 1, 2, 3, 5 and 7. (d) Plan view of model area (high and medium permeability) and surrounding aquifers used<br />
in reservoir simulations.<br />
90
Table 6.5. Reservoir properties. Pres – reservoir pressure, Tres – reservoir temperature, Pfrac – fracture pressure,<br />
µw – water viscosity, Bw – water formation volume factor, ρw, sc – water density at standard conditions. Standard<br />
temperature and pressure (STP) is 25°C (77°F) and 1.01325 * 105 Pa atmospheres (14.7 psi).<br />
Reservoir properties<br />
P res at top depth (1.9 km) 19.3 MPa<br />
T res 70 ºC<br />
P frac<br />
39.4 MPa<br />
Water salinity<br />
20000 ppm<br />
µ w 1.03 mPa.s<br />
B w 1.00214 m 3 /m 3<br />
ρ w, sc 1012.4 kg/m 3<br />
Table 6.6. Variation with pressure of CO 2 properties (from Span and Wagner, 1996). ρ g,sc – gas (CO 2 ) density at<br />
standard conditions, P – pressure, z g – gas (CO 2 ) compressibility factor, µ g – gas (CO 2 ) viscosity, B g – gas (CO 2 )<br />
formation volume factor.<br />
Variation with pressure of CO 2 properties<br />
ρ g,sc 1.9 kg/m 3<br />
P, MPa z g µ g , mPa.s B g , m 3 /m 3<br />
0.101 0.997 0.0171 1.192<br />
2.76 0.912 0.0174 0.040<br />
10.74 0.639 0.0239 0.007<br />
21.38 0.506 0.0555 0.003<br />
32.02 0.625 0.0726 0.002<br />
40.00 0.727 0.0823 0.002<br />
50.00 0.750 0.0928 0.002<br />
Table 6.7. Relative permeability and capillary pressure calculated from <strong>the</strong> model developed by van Genuchten<br />
(1980). S w – water saturation, k rw – water relative permeability, k rg – gas (CO 2 ) relative permeability, P c – capillary<br />
pressure.<br />
Relative permeability and capillary pressure<br />
S w k rw k rg P c , kPa<br />
0.2 0.0 1.0 400.0<br />
0.3 0.00001 0.74 80.7<br />
0.4 0.00008 0.5 28.1<br />
0.5 0.0008 0.3 14.8<br />
0.6 0.004 0.16 9.0<br />
0.7 0.015 0.06 5.8<br />
0.8 0.048 0.01 3.7<br />
0.9 0.147 0.0006 2.1<br />
0.95 0.275 0.0 1.3<br />
1.0 1.0 0.0 0.0<br />
91
Table 6.8. Summary of simulation study. P inj – well injection pressure, P frac – fracture pressure, Q inj – Injection rate.<br />
See Figures 6.48b to 6.48d for k distribution. Number of grid blocks varies as follows: 0
6.7.4. Simulation Results<br />
Preliminary simulation results were determined using simplified reservoir model parameters to<br />
simulate various structural, geological and injection scenarios in <strong>the</strong> reservoir. The early reservoir<br />
simulations showed that varying <strong>the</strong> vertical-to-horizontal permeability ratio (e.g. from 0.1 to 0.01)<br />
in a relatively thin reservoir (i.e. ~ 5 m), has a negligible effect on injection rates.<br />
The 3D model, simulations showed that placing injectors in medium permeability zones (i.e. 150<br />
mD) reduced <strong>the</strong> injection rate by a factor of 5 (Table 6.7). A large part of <strong>the</strong> western Bowen Basin<br />
area is likely to have similar medium reservoir permeabilities (Figure 6.47), so a larger number of<br />
wells would be required to reach <strong>the</strong> target 1.2 Mt/y injection rate. However, <strong>the</strong> advantage of<br />
injection in a lower-permeability (150 mD) zone is that a larger proportion of <strong>the</strong> injected volume of<br />
CO 2 would remain trapped residually within <strong>the</strong> pore space when <strong>the</strong> local injection induced<br />
pressure regime re-equilibrates with <strong>the</strong> regional hydrodynamic pressure regime. The simplified 3D<br />
modelling also simulated a high permeability (i.e. 1000 mD) homogenous reservoir followed by <strong>the</strong><br />
inclusion of low-permeability baffles (Table 6.7). This provided fur<strong>the</strong>r complexity with subsequent<br />
reduction of injection and CO 2 migration rates up <strong>the</strong> flank, enabling an appreciation of system<br />
sensitivities. Additional simulations were run where injection pressure was increased from 70% to<br />
90% of fracture gradient, resulting in higher CO 2 injection rates.<br />
Figure 6.48. Numerical simulation results showing gas saturation and reservoir pressure distributions using<br />
combinations of injectors giving best total rate (Q total ). (a–d) Gas saturations and reservoir pressures for cases 5, 6,<br />
7 and 9, respectively, and for years 7, 25 (injection ceases), 125, and 1025. Cartesian axes shown to locate grid<br />
blocks of Table 6.7; 0
One result, stemming from <strong>the</strong> testing of lower and higher permeability areas, is that an<br />
intermediate and optimal permeability range must exist where injection rate and long-term trapping<br />
integrity can be maximized against <strong>the</strong> potential negative effects of higher CO 2 migration rates in a<br />
higher permeability case, and less favourable economics in <strong>the</strong> lower permeability case.<br />
Secondly and more importantly, if <strong>the</strong>re is an inability to dissipate <strong>the</strong> injected CO 2 away from <strong>the</strong><br />
storage area due to low hydraulic connectivity in <strong>the</strong> surrounding rocks <strong>the</strong>n adding additional<br />
injection boreholes simply increases <strong>the</strong> rate of pressure build-up ra<strong>the</strong>r than significantly increasing<br />
<strong>the</strong> injection volume.<br />
The duration period for CO 2 migration before it reaches <strong>the</strong> Wunger Ridge is case-dependant, but<br />
does show that, for injector wells located in <strong>the</strong> eastern part of <strong>the</strong> high permeability zone it is in <strong>the</strong><br />
order of 25 to 50 years for a uniform reservoir (cases 5 and 7: Figures 6.48a and c), and greater than<br />
100 years for a reservoir with heterogeneity included (cases 6 and 9: Figures 6.48b and d). The<br />
duration period for CO 2 migration for injection in <strong>the</strong> eastern model area is greater than 500 years<br />
(not shown), and much of <strong>the</strong> CO 2 probably remains trapped through residual trapping.<br />
A second phase of modelling could compare <strong>the</strong> simplified 3D models to more complex reservoir<br />
models (e.g. Gorell & Bassett, 2001). Increased geological heterogeneity could be expected to<br />
increase volumes trapped in stratigraphic traps (e.g. Hovorka et al., 2004). For <strong>the</strong> simulation<br />
model, characterizing <strong>the</strong> connectivity of <strong>the</strong> reservoir and <strong>the</strong> surrounding aquifer is crucial to<br />
maintaining higher injection rates, as it allows flow within and out of <strong>the</strong> model area (boundary<br />
effects) to be more realistically simulated (Obdam et al., 2003).<br />
To this end, <strong>the</strong> simplified 3D model only considered a uniform pressure system. From previous<br />
studies, aquifers in <strong>the</strong> Bowen/Surat basins have been shown to be dynamic systems with recharge<br />
occurring to <strong>the</strong> north of <strong>the</strong> study area and with flow directions predominantly towards <strong>the</strong> south<br />
and sou<strong>the</strong>ast across <strong>the</strong> study area (Radke et al., 2000). However, models for <strong>the</strong> aquifer system<br />
(i.e. including flow and pressure) would need to be varied for a local area such as <strong>the</strong> Wunger Ridge<br />
because of <strong>the</strong> effects of hydrocarbon production over <strong>the</strong> last few decades.<br />
6.8. Conclusions from reservoir simulation of coarse scale models<br />
This assessment of <strong>the</strong> Wunger Ridge flank as a potential CO 2 storage site indicates that <strong>the</strong> area<br />
remains a viable injection and storage site subject to a range of limitations and assumptions.<br />
Suitability of Reservoir, Seal and Trap<br />
• <strong>the</strong> characteristics of <strong>the</strong> reservoir and pressure regime of <strong>the</strong> surrounding aquifer can<br />
significantly affect reservoir simulation results (e.g. injection pressure profiles and migration<br />
rates).This is particularly <strong>the</strong> case with small scale (few tens of km), large cell size<br />
(100’s of metres) simulations.<br />
• <strong>the</strong> Showgrounds Sandstone has <strong>the</strong> potential to be a viable reservoir for CO 2 injection and<br />
storage. The trap and seal integrity over geological time, have been demonstrated. The more<br />
stratigraphically complex facies with intra-reservoir baffles and medium permeabilities<br />
(i.e. 150 mD), have been shown to have better long term (10’s years – 100’s years) storage<br />
characteristics, when using horizontal wells for injection to offset poorer reservoir<br />
(injectivity and connectivity) characteristics.<br />
• <strong>the</strong> Showgrounds Sandstone is interpreted to be present on <strong>the</strong> Wunger Ridge flank and<br />
reservoir characteristics generally have been estimated as ~ 10 < porosity < 20 % and ~ 100<br />
< permeability < 1000 mD.<br />
• <strong>the</strong> Showgrounds Sandstone has been shown to be hydraulically connected over distances of<br />
<strong>the</strong> order of 10 km. This is a favourable attribute of a large scale storage site as it indicates a<br />
large proportion of <strong>the</strong> gross pore volume within <strong>the</strong> intended storage site may be accessed<br />
from relatively few well locations.<br />
94
• it is difficult to quantify <strong>the</strong> influence of multiple secondary baffles in <strong>the</strong> form of shale<br />
bands and micro-scale faults which would increase <strong>the</strong> tortuosity of <strong>the</strong> migration pathway.<br />
Modelling indicates that increasing <strong>the</strong> tortuosity of <strong>the</strong> migration pathway increases <strong>the</strong><br />
potential for en-route trapping for CO 2 , probably slows <strong>the</strong> migration rate <strong>the</strong>refore<br />
increasing <strong>the</strong> effectiveness of dissolution trapping.<br />
• <strong>the</strong> primary Snake Creek Mudstone and secondary Moolayember Formation seals have been<br />
interpreted to be laterally extensive, and <strong>the</strong>se are relatively un-faulted across <strong>the</strong> Wunger<br />
Ridge flank.<br />
• as <strong>the</strong> long-term trapping mechanisms are by trapping CO 2 residually and in small scale traps<br />
(metres to 100’s of metres), <strong>the</strong> top seals ability to hold back a certain pressure (expressed as<br />
a CO 2 column height) is analysed to ensure that CO 2 migrates laterally through <strong>the</strong> storage<br />
reservoir during <strong>the</strong> injection phase. Post-injection, as <strong>the</strong> pressure re-equilibrates with <strong>the</strong><br />
surrounding aquifer, <strong>the</strong> top seal strength becomes largely superfluous to CO 2 migration,<br />
whereas <strong>the</strong> seals lateral extent remains an important consideration.<br />
Aquifer Connectivity<br />
• <strong>the</strong> original predominant aquifer flow direction on <strong>the</strong> eastern side of <strong>the</strong> flank is to <strong>the</strong><br />
southwest at a rate of 0.2 m/yr. This is approximately perpendicular to <strong>the</strong> regional migration<br />
pathway for injected CO 2 which is modelled approximately to <strong>the</strong> west. The implication is<br />
that hydrodynamic flow is acting against any stratigraphic permeability barrier slightly<br />
reducing <strong>the</strong> barrier’s seal capacity. The hydraulic gradient would have a small effect of<br />
deflecting <strong>the</strong> migrating CO 2 slightly southward, as estimated at a semi-regional level.<br />
Separate flow paths for CO 2 and H 2 O indicate that, potentially, long-term injectivity may be<br />
enhanced by reducing reservoir pressure as water is able to escape <strong>the</strong> area down dip as <strong>the</strong><br />
CO 2 migrates up dip.<br />
• <strong>the</strong> Wunger Ridge has been a petroleum producing area for approximately 30 years with<br />
some fields have undergone significant pressure depletion. The radial extent of this depletion<br />
is unclear, but it is believed to extend down <strong>the</strong> flank, and out into <strong>the</strong> deeper parts of <strong>the</strong><br />
basin. Given <strong>the</strong> most current information available, and using hydraulic head values<br />
calculated from Waggamba-1, a new production affected flow rate has been calculated at 0.9<br />
m/yr. The increased flow-rate changes <strong>the</strong> flow direction away from <strong>the</strong> recharge direction<br />
and up onto <strong>the</strong> ridge. This means that <strong>the</strong> formation water is broadly moving in <strong>the</strong> same<br />
direction as <strong>the</strong> predicted migration pathway towards <strong>the</strong> better permeability sands, fur<strong>the</strong>r<br />
implying that migration of CO 2 along this path may be faster than initially predicted.<br />
Injection Characteristics<br />
• <strong>the</strong> reservoir simulation runs show that a minimum of two vertical wells are needed to reach<br />
injection rates of 1.2 Mt/y, or alternatively, at least one horizontal well, assuming an idealized<br />
homogenous reservoir model (i.e. porosity = 20 %; K = 1000 mD).<br />
• increasing injection pressure closer to maximum fracture gradient (i.e. 90% instead of 70%)<br />
dramatically improves injection rates, whilst <strong>the</strong> level of intra-reservoir baffle complexity and<br />
<strong>the</strong>ir proximity to <strong>the</strong> well bore can adversely affect rates.<br />
• if it is not possible to dissipate <strong>the</strong> injected CO 2 away from <strong>the</strong> storage area due to low<br />
hydraulic connectivity in <strong>the</strong> surrounding rocks, <strong>the</strong>n adding additional injection boreholes<br />
potentially increases <strong>the</strong> rate of pressure build up without a corresponding increase in <strong>the</strong><br />
injection rate and volume.<br />
• <strong>the</strong> migration time for CO 2 , before it reaches <strong>the</strong> Wunger Ridge is case dependent. The CO 2<br />
plume migration time to reach <strong>the</strong> Wunger Ridge from injector wells located in <strong>the</strong> eastern<br />
part of <strong>the</strong> modelled high permeability zone is in <strong>the</strong> order of 25 to 50 years assuming a<br />
95
uniform reservoir, and greater than 100 years modelling a reservoir with heterogeneity<br />
included. The migration time for CO 2 injected in <strong>the</strong> eastern part of <strong>the</strong> modelled area<br />
(i.e. K = 150 mD) is greater than 500 years.<br />
Impact of Modelled Site on Existing Natural Resources<br />
A number of effects from CO 2 injection activity in <strong>the</strong> Showgrounds Sandstone reservoir can be<br />
pre-empted and are described below. Some of <strong>the</strong>se effects may impinge positively or negatively on<br />
petroleum resources of <strong>the</strong> Wunger Ridge.<br />
• reservoir simulation of coarse scale models on <strong>the</strong> Wunger Ridge flank indicates that it is<br />
unlikely that CO 2 would migrate into <strong>the</strong> producing fields within <strong>the</strong> first 25 years, assuming<br />
injection at a rate of 1.2 Mt/y over 25 years. This scenario assumes a fairly uniform reservoir<br />
system with very good reservoir characteristics and injection wells drilled in <strong>the</strong> order of 10<br />
km away.<br />
Modelling of more tortuous pathways using <strong>the</strong> same quality reservoir, indicates that<br />
migration times could be significantly greater (i.e. > 100 years). If <strong>the</strong> injection site is linked<br />
via a highly permeable channel sandstone surrounded laterally by low permeability rocks<br />
directly towards <strong>the</strong> Wunger Ridge <strong>the</strong>n migration time to <strong>the</strong> ridge could be substantially<br />
less: this scenario has not been modelled.<br />
• pressure data indicates hydraulic communication between <strong>the</strong> Louise-1 well on <strong>the</strong> flank and<br />
<strong>the</strong> pressure depletion caused by <strong>the</strong> exploitation of hydrocarbons along <strong>the</strong> Wunger Ridge.<br />
Therefore, <strong>the</strong>re is a potential for <strong>the</strong> fields to be affected by changes in pressure from<br />
potential CO 2 injection operations. At this point in time it is unknown whe<strong>the</strong>r <strong>the</strong> net result<br />
would be positive or negative.<br />
• for example, an increase in field pressure (without a significant increase in water movement<br />
into <strong>the</strong> field area) may enhance hydrocarbon recovery as <strong>the</strong> increase in <strong>the</strong> pressure gradient<br />
may drive a greater volume of hydrocarbons toward <strong>the</strong> wells where semi-depleted reservoirs<br />
are associated with pressure lows. One consequence of a CO 2 injection project is that<br />
migration pathways would be better understood if reservoir pressure in different areas of <strong>the</strong><br />
ridge were able to be monitored across <strong>the</strong> lifespan of <strong>the</strong> project. Tracers placed within <strong>the</strong><br />
CO 2 would fur<strong>the</strong>r quantify migration pathways.<br />
• on <strong>the</strong> negative side, increasing <strong>the</strong> pressure may contract <strong>the</strong> gas–water/gas–oil contacts<br />
back above intra-reservoir scale stratigraphic baffles reducing <strong>the</strong> ultimate hydrocarbon<br />
recovery from fields on <strong>the</strong> Wunger Ridge. Alternatively, increasing <strong>the</strong> pressure through<br />
CO 2 migration may accelerate water break-through potentially reducing <strong>the</strong> swept area of<br />
reservoirs which are in pressure connection. The shape of <strong>the</strong> pressure front would need to<br />
be modelled as it contacts <strong>the</strong> fields to see what <strong>the</strong> reaction of individual wells, potentially,<br />
would be.<br />
6.9. Chapter References<br />
Boggs, S., 1995. Principles of sedimentology and stratigraphy (2 nd ed.) Prentice Hall, New Jersey<br />
U.S.A.<br />
Bohac, K., 2002. Continental Sequence Stratigraphy: Insights for Lacustrine Hydrocarbon Systems.<br />
Esso Australia/PESA Short Course. Unpublished Course Notes.<br />
Brady, H., 2004. A major play in <strong>the</strong> Surat–Bowen Basin Lan Nguyen and eight years of Permian<br />
ideas, PESA news August/September 2004, p22–28.<br />
96
Brakel et al., (in press), In Korsch, R.J. & Totterdell, J.M. (eds) Evolution of <strong>the</strong> Bowen, Gunnedah<br />
and Surat basins, Eastern Australia. Australian Journal of Earth Sciences.<br />
Bridge Oil Limited (BON), 1981. Waggamba-1 Well Completion Report. Unpublished.<br />
Bridge Oil Limited (BON), 1989. Sirrah-5 Well Completion Report. Unpublished.<br />
Butcher, P.M. 1984. The Showgrounds Formation, its setting and seal, in ATP 145P, QLD. APEA<br />
Journal 1984 Vol. 24 Part 1 (336–357).<br />
Coho Exploration Pty Ltd (Coho), 1982. Well Completion Report, Inglestone No. 1.<br />
Fielding, C.R., Silwa, R., Holcombe, R.J. and Jones, A.T., 2001. A new Palaeogeographic Syn<strong>the</strong>sis<br />
for <strong>the</strong> Bowen, Gunnedah and Sydney Basins of Eastern Australia. PESA Eastern Australasian<br />
Basins Symposium Melbourne, Victoria, 25–28 November 2001.<br />
Folk, R.L., 1974. Petrology of sedimentary rocks. Hemphill, Austin, Texas.<br />
Galloway, W.E. and Hobday, D.K., 1983. Terrigenous clastic depositional systems: application to<br />
petroleum, coal, and uranium exploration. Springer-Verlag, New York.<br />
Home, P.C., Dalton, D.G. & Brannan, J., 1990. Geological Evolution of <strong>the</strong> Western Papuan Basin.<br />
Petroleum Exploration in Papuan New Guinea: Proceedings of <strong>the</strong> First PNG Petroleum<br />
Convention, Port Moresby, 12–14 th February 1990, Carman, G.J. and Z eds.<br />
Jordan, D. W., Pryer, W.A., 1992. Hierarchical Levels of Heterogeneity in a Mississippi River<br />
meander belt and application to reservoir systems. AAPG Bulletin, 76, Vol 10, pg 1601–1624.<br />
Kassan, J. and Lang, S. 1999. Sedimentology and Stratigraphy of Fluvial & Deltaic Reservoirs<br />
Field Guide Bowen and Surat Basins, A field guide for Participants of <strong>the</strong> 1998 Excursion.<br />
Publishers — Whistler Research & GeoSed.<br />
Korsh, R.J., Wake-Dyster, K.D. & Johnstone, D.W., 1992. Seismic imaging of Late Palaeozoic-<br />
Early Mesozoic extensional and contractional structures in <strong>the</strong> Bowen and Surat basins, eastern<br />
Australia. Tectonophysics, 215, 273–294.<br />
Korsch, R.J., Boreham, C.J., Totterdell, J.M., Shaw, R.D. and Nicoll, M.G., 1998. Development<br />
and petroleum resource evaluation of <strong>the</strong> Bowen, Gunnedah and Surat Basins, Eastern Australia.<br />
APPEA Journal 1998 Vol. 38 Part1 (pp. 199–237).<br />
Merrill, R.K., Trujillo, S.K., Simpson, S.D. & Wall, R.M., 2004. An international perspective on<br />
entry into hydrocarbon-producing basins of eastern Australia. PESA Eastern Australasian Basins<br />
Symposium II. Adelaide, 19–22 September 2004, 35–40.<br />
Miall, A., D., 1990. Principles of Sedimentary Basin Analysis (2 nd ed.). Springer-Verlag New<br />
York U.S.A.<br />
<strong>Read</strong>ing, H.G., 1996. Sedimentary Environments: Processes, facies and stratigraphy (3 rd ed).<br />
Blackwell Science Ltd, London.<br />
Reeve, J., Adamson, M., Dorsch, C., 1988. Final Well Report, Yellowbank Creek North-1, Surat-<br />
Bowen Basin, Queensland. Sydney Oil Company (Canning) Pty Ltd. Operator for and on behalf of<br />
PL18 Joint Venture. Unpublished.<br />
Robein, E., 2003. Velocities, time-imaging and depth-imaging in reflection seismics - Principles<br />
and methods. EAGE Publications <strong>the</strong> Ne<strong>the</strong>rlands, 461p.<br />
97
Schlumberger, 1989. Log Interpretation Principles/Applications. Schlumberger Wireline and<br />
testing, Texas, USA.<br />
Shaw, R.D., Korsch, R.J., Boreham, C.J., Totterdell, J.M., Lelbach, C. & Nicoll, M.G., 1999.<br />
Evaluation of <strong>the</strong> undiscovered hydrocarbon resources of <strong>the</strong> Bowen and Surat Basins,<br />
sou<strong>the</strong>rn Queensland. AGSO Journal of Australian Geology and Geophysics, 17 (5/6),<br />
pp 43- 65.<br />
Strong, P.C., Wood G.R., Lang S.C., Jollands A., Karalaus E. & Kassan J., 2002. High resolution<br />
palaeogeographic mapping of <strong>the</strong> fluvial–lacustrine Patchawarra Formation in <strong>the</strong> Cooper Basin,<br />
South Australia APPEA Journal pp65–81.<br />
Sunshine Gas, 2005. Australian Stock Exchange Announcement April 7, 2005.<br />
http://www.sunshinegas.com.au/inv_asx.php?q=2&y=2005<br />
Sydney Oil Company (Canning) Pty Ltd (SOC), 1987. Final Well Report, Kinkabilla Creek-1.<br />
Union Oil Development Corporation (UOD), 1961. Well Completion Report No.1,<br />
Union-Kern-AOG — Cabawin No. 1.<br />
Union Oil Development Corporation (UOD), 1964. Well Completion Report No.28,<br />
Union-Kern-AOG — Tarthra No. 1.<br />
Union Oil Development Corporation (UOD), 1966. Well Completion Report,<br />
Union-Kern-AOG- Kinkabilla No. 1.<br />
Willink, R.J., Pass, G.P., Horton, P., Taylor, R., Su<strong>the</strong>rland, G. & Pidgeon, B., 2004. Did <strong>the</strong><br />
exploration well Myall Creek-1, plugged and abandoned in 1964, actually find <strong>the</strong> biggest gas<br />
field in <strong>the</strong> Surat Basin? — Introducing <strong>the</strong> Tinowon Formation stratigraphic play. PESA Eastern<br />
Australasian Basins Symposium II, p 13–28.<br />
98
7. Summary and Implications - Sou<strong>the</strong>ast Queensland CO 2<br />
Storage Sites<br />
Summary<br />
The sou<strong>the</strong>ast Queensland CO 2 storage sites project has provided a number of significant results<br />
concerning <strong>the</strong> potential to store CO 2 in Queensland, with <strong>the</strong> Bowen Basin being <strong>the</strong> focus of initial<br />
interest.<br />
• Based on <strong>the</strong> assessment methodology used by this study and <strong>the</strong> preceding GEODISC<br />
programme, <strong>the</strong> Bowen and Galilee basins are considered <strong>the</strong> most suitable for <strong>the</strong> injection<br />
and long term storage of CO 2 storage. The rest of <strong>the</strong> basins are perceived to have limited<br />
potential due to a variety of reasons as outlined in Table 3.1.<br />
• Preliminary results indicate that CO 2 storage on <strong>the</strong> Wunger Ridge flank appears technically<br />
feasible. Potentially similar sites exist in o<strong>the</strong>r parts of <strong>the</strong> eastern Bowen Basin.<br />
Understanding <strong>the</strong> variation of facies and associated reservoir quality will be <strong>the</strong> key to<br />
assessing <strong>the</strong>se o<strong>the</strong>r sites.<br />
• The Wunger Ridge flank study area has been dynamically modelled by simulating injection<br />
and reservoir conditions using coarse scale 3D models. The simulations suggest that<br />
injection rates of 1.2 mT/yr can be sustained using a minimum of one horizontal well or two<br />
vertical wells. More complex modelling in Petrel TM and Eclipse TM could examine <strong>the</strong><br />
importance of stratigraphic complexity of <strong>the</strong> reservoir and detail <strong>the</strong> sensitivities of o<strong>the</strong>r<br />
parameters to fluid flow.<br />
• Using a basic net available pore space model, <strong>the</strong> Wunger Ridge flank area has been<br />
assessed to have a net available pore space for storage, equivalent to approximately<br />
40 - 170 Mt of CO 2 . More correct estimates of storage potential from dynamic modelling<br />
could be obtained from finer scale reservoir modelling and injection simulations as well as<br />
establishing residual gas saturation trapping. Improving <strong>the</strong> precision of <strong>the</strong>se estimates<br />
will requires in <strong>the</strong> first instance <strong>the</strong> acquisition of relative permeability data<br />
(H 2 O-CO 2 ) and as <strong>the</strong> data becomes available publicly, more well/seismic data to better<br />
understand reservoir heterogeneity and <strong>the</strong> structure.<br />
• many of <strong>the</strong> sou<strong>the</strong>ast Queensland basins have been established as having very poor<br />
reservoir characteristics including <strong>the</strong> eastern flank of <strong>the</strong> Bowen Basin. If <strong>the</strong> results from<br />
<strong>the</strong> Stanwell experiment in low permeability rocks located in <strong>the</strong> Denison Trough proves<br />
encouraging, <strong>the</strong>n low permeability reservoirs (i.e. < 50 mD) should be re-investigated as<br />
<strong>the</strong>y could provide viable long-term storage sites<br />
• <strong>the</strong> Wunger Ridge study of <strong>the</strong> Showgrounds Sandstone (reservoir ) Snake Creek Mudstone<br />
(seal) residual-structural trap is representative of <strong>the</strong> most likely CO 2 storage type to be<br />
found on <strong>the</strong> western margin of <strong>the</strong> Taroom Trough. The same basic concept and assessment<br />
methodologies could be applied to similar play types along <strong>the</strong> western margin with<br />
reasonable confidence, if similar geological and structural characteristics exist.<br />
• <strong>the</strong> potential storage site on <strong>the</strong> Wunger Ridge flank is located within a part of <strong>the</strong> Bowen<br />
Basin that has active exploration targeting <strong>the</strong> deeper Permian Tinowon Sandstone play,<br />
which has been extended east of <strong>the</strong> Roma Shelf, about 60 km north of <strong>the</strong> Wunger Ridge<br />
flank area. As such, <strong>the</strong>re is <strong>the</strong> possibility that special measures would have to be<br />
considered if an ESSCI was to be established in <strong>the</strong> area.<br />
99
Implications<br />
It is hoped that <strong>the</strong> knowledge-base gained from this project can be extrapolated to o<strong>the</strong>r parts of<br />
<strong>the</strong> Bowen Basin (e.g. <strong>the</strong> Roma Shelf). This project has also documented most of <strong>the</strong> geological<br />
risk factors, sensitivities and input those into several 3D geological models that incorporated<br />
multiple reservoir simulation scenarios. A number of implications result, as follows.<br />
• reservoir simulations have shown that a thorough understanding of <strong>the</strong> reservoir (aquifers)<br />
surrounding <strong>the</strong> storage area is as important as understanding <strong>the</strong> reservoir within <strong>the</strong> storage<br />
area itself.<br />
• while hydrodynamic flow systems are relatively slow compared with CO 2 migration,<br />
pre-production studies can provide insight into <strong>the</strong> likely ultimate destination of formation<br />
water, and <strong>the</strong> existence of pressure relief systems.<br />
• Modelling using homogenous reservoirs, in low dip areas, (approximately 1 degree in this<br />
case) indicated that <strong>the</strong> CO 2 plume will migrate towards <strong>the</strong> better permeability, porosity and<br />
low pressure areas generally but not exclusively in <strong>the</strong> up dip direction.<br />
• a potential impact to <strong>the</strong> petroleum industry is that exploration wells which are targeting<br />
future plays drilled within <strong>the</strong> storage area would require pipe resistant to CO 2 and HCO 3<br />
corrosion to prevent <strong>the</strong> accidental release of CO 2 into <strong>the</strong> well bore.<br />
100
8. Recommendations- Sou<strong>the</strong>ast Queensland CO 2<br />
Storage Sites<br />
Many of <strong>the</strong> following recommendations would depend on a commitment from stakeholders in<br />
taking up <strong>the</strong> Wunger Ridge area as a potential storage site. Additionally, knowledge from some<br />
of <strong>the</strong> following recommendations are transportable across to o<strong>the</strong>r areas.<br />
Transportable Knowledge Base<br />
One analysis that would be transportable world wide would be to measure CO 2 gas saturation for<br />
given capillary sizes under various scenarios of reservoir characteristics, depth / pressure.<br />
Measurements can be done by measuring/analysing core sample characteristics through laboratory<br />
work.<br />
Such a methodology would involve:<br />
• matching facies types (i.e. through electrical log reading and core analysis) to permeability<br />
distributions;<br />
• measuring capillary pressure for both drainage and imbibition. Imbibition measurement of<br />
CO 2 is required to mimic <strong>the</strong> saturation during injection over a range of<br />
porosities/permeability’s and pressures;<br />
• measuring residual water and CO 2 saturation for different capillary sizes and pressures,<br />
during drainage to estimate <strong>the</strong> residual trapping capability of a rock for a given capillary<br />
size;<br />
• modelling relative injection pressure, which is related to <strong>the</strong> difference between <strong>the</strong><br />
lithological and hydrological pressures that change with depth and hydrological<br />
environment. The pressure potential across an area can be mapped to indicate potential<br />
migration pathways, and <strong>the</strong> subsequent location of potential injection sites;<br />
• modelling pressure decline curves away from <strong>the</strong> injector well that are dependant on<br />
reservoir thickness, permeability, gross connectivity, small scale heterogeneity and<br />
formation pressure distributions, all changing with <strong>the</strong> geological environment;<br />
• modelling <strong>the</strong> relative density of CO 2 that changes with depth (especially true for <strong>the</strong><br />
larger/longer monoclinal residual traps).<br />
• modelling <strong>the</strong> effect of differing formation water salinities and <strong>the</strong> effect <strong>the</strong>y would have<br />
on injection and buoyancy.<br />
Non-transportable Knowledge Base<br />
• geomechanical work is required to document <strong>the</strong> local lithostatic gradient and estimate <strong>the</strong><br />
maximum fracture gradient. This would allow a better estimate of possible injection pressure<br />
rates with subsequent ramifications for CO 2 storage volume. Estimating <strong>the</strong> maximum<br />
fracture gradient is also a priority as injection pressure thresholds strongly influence possible<br />
rates of injection.<br />
• The sedimentary provenance within <strong>the</strong> Showgrounds Sandstone appears similar and<br />
continuous across <strong>the</strong> Wunger Ridge and Roma Shelf areas, however a number of individual<br />
river systems are suspected. Fur<strong>the</strong>r petrographic work could be undertaken to potentially<br />
improve <strong>the</strong> understanding of sediment provenance and <strong>the</strong>ir relationship with <strong>the</strong> two areas.<br />
101
This knowledge would assist in <strong>the</strong> interpretation of <strong>the</strong> palaeogeography within Roma Shelf<br />
area, thus giving an understanding of <strong>the</strong> connectivity of <strong>the</strong> Showgrounds Sandstone<br />
between <strong>the</strong> Wunger Ridge and Roma Shelf.<br />
• hydrodynamic work has been carried out as comprehensively as possible using available<br />
data: a more detailed review would require gaining permission to obtain field productionpressure<br />
data (i.e. production schedules) from <strong>the</strong> operator(s) of <strong>the</strong> Wunger Ridge fields.<br />
This pressure v production data would facilitate <strong>the</strong> interpretation of <strong>the</strong> state of depletion,<br />
inter and intra pressure connectivity of fields. The next stage in understanding <strong>the</strong> flow<br />
system in <strong>the</strong> Showgrounds Sandstone and its potential impact on <strong>the</strong> migration direction of<br />
injected CO 2 is to understand <strong>the</strong> current day flow system. This requires more detailed<br />
production data from petroleum companies operating in <strong>the</strong> area in terms of static gradient<br />
tests, wellhead pressures, etc. This must be coupled with a mass balance calculation.<br />
• it would also be important to locate <strong>the</strong> digital SEGY seismic data that may be available as<br />
original tapes. These SEGY tapes may need reprocessing to enable <strong>the</strong> interpretation of <strong>the</strong><br />
data to determine structural as well as stratigraphic information.<br />
O<strong>the</strong>r<br />
• it is recommended that <strong>the</strong> resource status of various sub 10000 ppm NaCL salinity reservoirs<br />
be monitored.<br />
102
9. Acknowledgements<br />
The project group would like to thank <strong>the</strong> many people who have contributed to <strong>the</strong> project,<br />
including:<br />
• colleagues within <strong>the</strong> Geoscience Australia <strong>CO2CRC</strong> project team including Kila Bale, Rick<br />
Causebrook, Tess Dance, Lynton Spencer, Frank La Pedalina, Ian Newlands, Tim<br />
Robertson, and Rob Langford;<br />
• interpretive support from colleagues in <strong>the</strong> Australian School of Petroleum including Max<br />
Watson and Ca<strong>the</strong>rine Gibson-Poole<br />
• Erin Parkinson who was hired as a temporary employee to digitise <strong>the</strong> seismic data, Felix<br />
Booth who was hired as a temporary employee to quality control <strong>the</strong> well-logs, and<br />
Ca<strong>the</strong>rine Martin who digitised <strong>the</strong> seismic data, and<br />
• Andy Rigg (past) and John Kaldi (present) — Program Manager of <strong>the</strong> <strong>CO2CRC</strong> who<br />
helped with logistical support.<br />
Geoscience Australia’s component of this work is published with <strong>the</strong> permission of <strong>the</strong> Chief<br />
Executive Officer of Geoscience Australia — Dr Neil Williams, as well as support from <strong>the</strong> Chief<br />
of <strong>the</strong> Petroleum and Marine Division — Dr Clinton Foster.<br />
103
10. Appendices<br />
10.1 Bowen Basin- Autho-Stratigraphic chart and references<br />
10.2 Denison Trough<br />
10.3 East Bowen Basin Study area- Burunga Anticline/ Dulucca Area<br />
10.4 Sou<strong>the</strong>ast Bowen Basin Study area<br />
10.5 Nor<strong>the</strong>ast Bowen Basin Study Area<br />
10.6 Wunger Site Flank Associated Reports<br />
10.6.1 Geological Dataset- Well information<br />
10.6.2 Petrology (Stuart Barclay)<br />
10.6.3 Hydrodynamics (Alison Hennig, Luke Johnson)<br />
10.6.4 Petrophysics (Tim O-Sullivan)<br />
10.6.5 Seal Capacity (Ric Daniel)<br />
10.6.6 Geophysics (Jacques Sayers)<br />
10.6.7 Reservoir Engineering (Yildiray Cinar)<br />
10.7 Glossary of Geosequestration Terms<br />
104
List of authors<br />
Note: (main authors-underlined)<br />
Stuart Barclay 1 (CSIRO Petroleum, Sydney) — Geochemist. Stuart carried out <strong>the</strong><br />
petrography/petrology analysis of core samples and wrote <strong>the</strong> stand-alone petrology/petrography<br />
<strong>report</strong>s. Contacts: Ph. 61 2 9490 8890, e-mail: sbarclay@co2crc.com.au.<br />
John Bradshaw 1 (Geoscience Australia, Canberra) - principal petroleum geologist. John was<br />
project leader of <strong>the</strong> <strong>CO2CRC</strong> project group until August 2005, and responsible for leading<br />
strategic aspects of <strong>the</strong> project including networking of key stake-holders. John also played a<br />
significant role in reviewing of <strong>the</strong> <strong>report</strong>. Contacts: Ph. 61 2 6249 9659, e-mail:<br />
john.bradshaw@ga.gov.au.<br />
Yildiray Cinar (University of New South Wales, Sydney) — senior reservoir engineer. Yildiray<br />
was responsible for carrying out both <strong>the</strong> 2D profile and 3D reservoir simulations of <strong>the</strong> site area,<br />
and wrote <strong>the</strong> stand-alone reservoir engineering <strong>report</strong>. Contacts: Ph. 61 2 9385 5786,<br />
e-mail: ycinar@co2crc.com.au.<br />
Ric Daniel 2 (Australian School of Petroleum, Adelaide) — Seals Data Research Fellow. Ric carried<br />
out <strong>the</strong> analysis of seal samples using MICP and wrote <strong>the</strong> stand-alone seal capacity <strong>report</strong>.<br />
Contacts: Ph. 61 8 8303 4297, e-mail: rdaniel@asp.adelaide.edu.au.<br />
Allison Hennig (CSIRO Petroleum, Perth) — senior petroleum geologist specialising in<br />
hydrodynamics. Allison was responsible for quality controlling and interpreting <strong>the</strong> hydrodynamics<br />
data and writing <strong>the</strong> stand-alone hydrodynamics <strong>report</strong>. Contacts: Ph. 61 8 6436 8743,<br />
e-mail: ahennig@co2crc.com.au.<br />
Aleks Kalinowski (Geoscience Australia, Canberra) — petroleum geologist. Aleks was<br />
responsible for writing <strong>the</strong> geological summary of <strong>the</strong> sou<strong>the</strong>ast Bowen Basin study area for CO 2<br />
storage potential and wrote <strong>the</strong> stand-alone <strong>report</strong>. Contacts: Ph. 61 2 6249 9609, e-mail:<br />
aleks.kalinowski@ga.gov.au.<br />
Cameron Marsh (Geoscience Australia, Canberra) — senior petroleum geologist. Cameron was<br />
responsible for data ga<strong>the</strong>ring, geological interpretation and leading aspects of <strong>the</strong> geological<br />
component of <strong>the</strong> project. Contacts: Ph. 61 2 6249 9833,<br />
e-mail: cameron.marsh@co2crc.com.au.<br />
Annette Patchett (Geoscience Australia, Canberra) — petroleum geologist. Annette was<br />
responsible for assessing <strong>the</strong> east Bowen Basin study area (Burunga Anticline/Dulucca area)<br />
for CO 2 storage potential and wrote <strong>the</strong> stand-alone <strong>report</strong>. Contacts:<br />
Ph. 61 2 6249 9484, e-mail: apatchett@co2crc.com.au.<br />
Jacques Sayers 3 (Geoscience Australia, Canberra) — senior petroleum geophysicist, and was<br />
<strong>the</strong> team leader for this project. Jacques was responsible for data ga<strong>the</strong>ring and geophysical<br />
interpretation. Contacts: Ph. 61 2 6249 9609, e-mail: jsayers@co2crc.com.au.<br />
Adam Scott (Geoscience Australia (Canberra) — petroleum geologist. Adam was responsible<br />
for data ga<strong>the</strong>ring, geological interpretation and leading aspects of <strong>the</strong> geological component of<br />
<strong>the</strong> project. Contacts: Ph. 61 2 6249 9148, e-mail: ascott@co2crc.com.au.<br />
Lloyd White 1 (Geoscience Australia, Canberra) — geologist. Lloyd was responsible for writing <strong>the</strong><br />
geological summary of <strong>the</strong> nor<strong>the</strong>ast Bowen Basin study area for CO 2 storage potential and wrote<br />
<strong>the</strong> stand-alone <strong>report</strong>. Contacts: Ph. 61 2 6249 9621, e-mail: lloyd.white@ga.gov.au.<br />
1 No longer a participant of <strong>CO2CRC</strong><br />
2 Not a member of <strong>CO2CRC</strong><br />
3 Now at ASP<br />
105
List of contributors<br />
Luke Johnson (CSIRO Petroleum, Perth) — petroleum geologist specialising in hydrodynamics.<br />
Luke was responsible for quality controlling and interpreting aspects of <strong>the</strong> hydrodynamics data.<br />
Tim Robertson (Geoscience Australia, Canberra) — technical assistant throughout <strong>the</strong> project and<br />
was involved with assembling <strong>the</strong> seismic database for <strong>the</strong> project.<br />
List of reviewers<br />
Andrew Barrett 2 (Geoscience Australia, Canberra) — senior geophysicist. Andrew reviewed <strong>the</strong><br />
geophysical components of <strong>the</strong> <strong>report</strong>.<br />
Rick Causebrook (Geoscience, Canberra) —senior petroleum geologist and is project leader for<br />
<strong>CO2CRC</strong> Project 1.1. Rick reviewed <strong>the</strong> whole <strong>report</strong>.<br />
Alfredo Chirinos (Geoscience Australia, Canberra) — senior geologist. Alfredo reviewed <strong>the</strong><br />
whole <strong>report</strong>.<br />
Rob Langford (Geoscience Australia, Canberra) — senior geologist and is project leader for<br />
<strong>CO2CRC</strong> Project 1.8. Rob reviewed <strong>the</strong> appendices of <strong>the</strong> <strong>report</strong>.<br />
Frank La Pedalina 4 (Geoscience Australia, Canberra) — geophysicist. Frank reviewed <strong>the</strong><br />
geophysical components of <strong>the</strong> <strong>report</strong>.<br />
Donghai Xu 2 (Geoscience Australia, Canberra) — senior petroleum engineer. Donghai reviewed<br />
<strong>the</strong> engineering components of <strong>the</strong> <strong>report</strong>.<br />
2 Not a member of <strong>CO2CRC</strong><br />
106
![Post-combustion solvent absorption [PDF 438KB] - CO2CRC](https://img.yumpu.com/48575763/1/184x260/post-combustion-solvent-absorption-pdf-438kb-co2crc.jpg?quality=85)