Gateshead and Newcastle Strategic Housing Market Assessment
Gateshead and Newcastle Strategic Housing Market Assessment
Gateshead and Newcastle Strategic Housing Market Assessment

Create successful ePaper yourself
Turn your PDF publications into a flip-book with our unique Google optimized e-Paper software.
<strong>Gateshead</strong> & <strong>Newcastle</strong> <strong>Strategic</strong> <strong>Housing</strong> <strong>Market</strong> <strong>Assessment</strong> 2010<br />
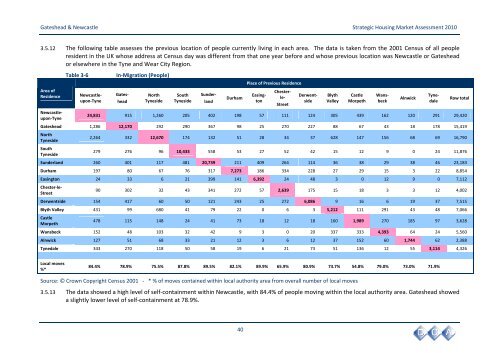
3.5.12 The following table assesses the previous location of people currently living in each area. The data is taken from the 2001 Census of all people<br />
resident in the UK whose address at Census day was different from that one year before <strong>and</strong> whose previous location was <strong>Newcastle</strong> or <strong>Gateshead</strong><br />
or elsewhere in the Tyne <strong>and</strong> Wear City Region.<br />
Area of<br />
Residence<br />
Table 3‐6<br />
In‐Migration (People)<br />
<strong>Gateshead</strong><br />
North<br />
Tyneside<br />
South<br />
Tyneside<br />
Sunderl<strong>and</strong><br />
Durham<br />
Place of Previous Residence<br />
Blyth<br />
Valley<br />
Castle<br />
Morpeth<br />
24,831 915 1,260 205 402 198 57 111 124 305 439 162 120 291 29,420<br />
<strong>Gateshead</strong> 1,286 12,170 292 290 367 98 25 270 227 88 67 43 18 178 15,419<br />
North<br />
Tyneside<br />
South<br />
Tyneside<br />
2,264 332 12,670 174 132 51 28 34 37 628 147 156 68 69 16,790<br />
279 276 96 10,433 558 53 27 52 42 15 12 9 0 24 11,876<br />
Sunderl<strong>and</strong> 260 401 117 481 20,739 211 409 264 114 36 38 29 38 46 23,183<br />
Durham 197 80 67 76 317 7,273 186 334 228 27 29 15 3 22 8,854<br />
Easington 24 33 6 21 399 141 6,392 24 48 3 0 12 9 0 7,112<br />
Wansbeck<br />
<strong>Newcastle</strong>upon‐Tyne<br />
Chester‐le‐<br />
Street<br />
90 302 32 43 341 272 57 2,639 175 15 18 3 3 12 4,002<br />
Derwentside 154 417 60 50 121 243 25 272 6,086 9 16 6 19 37 7,515<br />
Blyth Valley 431 99 680 41 79 22 0 6 3 5,212 111 291 43 48 7,066<br />
Castle<br />
Morpeth<br />
478 115 148 24 41 73 18 12 18 160 1,989 270 185 97 3,628<br />
Wansbeck 152 48 103 32 42 9 3 0 20 337 333 4,393 64 24 5,560<br />
Alnwick 127 51 68 33 21 12 3 6 12 37 152 60 1,744 62 2,388<br />
Tynedale 343 270 118 50 58 19 6 21 73 51 136 12 55 3,114 4,326<br />
<strong>Newcastle</strong>upon‐Tyne<br />
Easington<br />
Chester‐<br />
le‐<br />
Street<br />
Derwentside<br />
Alnwick<br />
Tynedale<br />
Row total<br />
Local moves<br />
%*<br />
84.4% 78.9% 75.5% 87.8% 89.5% 82.1% 89.9% 65.9% 80.9% 73.7% 54.8% 79.0% 73.0% 71.9%<br />
Source: © Crown Copyright Census 2001 ‐ * % of moves contained within local authority area from overall number of local moves<br />
3.5.13 The data showed a high level of self‐containment within <strong>Newcastle</strong>, with 84.4% of people moving within the local authority area. <strong>Gateshead</strong> showed<br />
a slightly lower level of self‐containment at 78.9%.<br />
40