Vol 1 2003 The Monthly April.pdf - Central Statistical Office of Zambia
Vol 1 2003 The Monthly April.pdf - Central Statistical Office of Zambia
Vol 1 2003 The Monthly April.pdf - Central Statistical Office of Zambia

Create successful ePaper yourself
Turn your PDF publications into a flip-book with our unique Google optimized e-Paper software.
Republic <strong>of</strong> <strong>Zambia</strong><br />
<strong>The</strong><br />
<strong>Monthly</strong><br />
<strong>Central</strong> <strong>Statistical</strong> <strong>Office</strong><br />
Director’s<br />
Foreword<br />
FIRST RELEASE<br />
Welcome to the first issue <strong>of</strong> ‘<strong>The</strong><br />
<strong>Monthly</strong>’, a production <strong>of</strong> the<br />
Data Dissemination Unit <strong>of</strong> the<br />
<strong>Central</strong> <strong>Statistical</strong> <strong>Office</strong> (CSO). <strong>The</strong> CSO<br />
has embarked on a vigorous task <strong>of</strong><br />
helping the <strong>Zambia</strong>n public in making<br />
informed decisions through the use <strong>of</strong><br />
<strong>of</strong>ficial statistics. This has been done<br />
through the strengthening <strong>of</strong> a Data<br />
Dissemination Unit aimed at helping<br />
build Partnership between the CSO and<br />
the entire data user community.<br />
<strong>The</strong>refore ‘<strong>The</strong> <strong>Monthly</strong>’ is, but one <strong>of</strong><br />
the many ways that the <strong>of</strong>fice will employ<br />
to inform and serve you better.<br />
‘<strong>The</strong> <strong>Monthly</strong>’, as the name implies will<br />
be produced monthly and circulated free,<br />
in order to provide information to our<br />
users <strong>of</strong> statistics on the current and upcoming<br />
activities and products available<br />
at the CSO, how to access this<br />
information and when certain<br />
information and reports will be ready for<br />
dissemination.<br />
<strong>April</strong> <strong>2003</strong><br />
Finally, I would like to encourage readers<br />
and data users to send any comments and<br />
enquiries to my <strong>of</strong>fice or the Data<br />
Dissemination Unit on the address<br />
provided. Enjoy your first copy <strong>of</strong> ‘<strong>The</strong><br />
<strong>Monthly</strong>’ as we aim to serve your data<br />
needs.<br />
As you may be aware, the CSO produces a<br />
number <strong>of</strong> statistical products and<br />
services in the Economic, Social,<br />
Agricultural and Environmental areas,<br />
necessary for effective policy formulation,<br />
planning, implementation, monitoring<br />
and evaluation <strong>of</strong> programs and projects.<br />
I therefore urge you to visit or contact the<br />
CSO for all your data needs.<br />
Dr. Buleti G. Nsemukila<br />
Director <strong>of</strong> Census & Statistics<br />
<strong>Central</strong> <strong>Statistical</strong> <strong>Office</strong>, Nationalist Road, P.O. Box 31908, Lusaka ● Telefax:253468 ● E-mail:info@zamstats.gov.zm ● Website:www.zamstats.gov.zm
‘<strong>The</strong> <strong>Monthly</strong>’ <strong>Central</strong> <strong>Statistical</strong> <strong>Office</strong> Page 2<br />
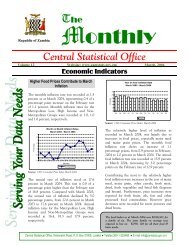
<strong>April</strong> CPI shows lower food prices…<br />
CSO, through its monthly Consumer Price<br />
Index (CPI) survey, reported a decrease in the<br />
monthly inflation rate from 0.8% in March to<br />
0.2% in <strong>April</strong>. <strong>The</strong> decrease in inflation was<br />
attributed to significantly lower food prices<br />
recorded in <strong>April</strong>, especially for Mealie Meal,<br />
Maize grain, fresh and dried Kapenta, fresh<br />
Fish, dressed Chickens, Meat, Samp,<br />
Groundnuts and Sweet Potatoes.<br />
Comparatively, the price <strong>of</strong> Roller Meal<br />
declined by 3.8% in March and by 2.9% in<br />
<strong>April</strong>, while the price <strong>of</strong> Maize grain declined<br />
by 10.3% in March and by 25.3% in <strong>April</strong>,.<br />
Breakfast meal, which had recorded a price<br />
increase <strong>of</strong> 0.4% in March, declined by 1.5%<br />
in <strong>April</strong>. Furthermore price reductions <strong>of</strong><br />
5.4%, 9.8%, 3.6%, 0.9%, 8.5%, 0.3% and<br />
38.9% were registered for Kapenta, fresh<br />
Fish, dressed Chickens, Meat, Samp,<br />
Groundnuts and Sweet Potatoes, respectively.<br />
Overall, the food index recorded a decrease <strong>of</strong><br />
0.7%.<br />
Nonetheless, price increase were observed for<br />
some <strong>of</strong> the foodstuff such as Oils and Fats,<br />
fresh Vegetables, other Cereals and Cereal<br />
products, Milk and milk products, Fruits,<br />
alcoholic and non-alcoholic beverages and<br />
other processed food commodities.<br />
In addition, the non-food sector also<br />
registered price increases in the Rent and<br />
Household Energy, Medical Care, Transport<br />
(Petrol and Diesel), Other Goods and<br />
5<br />
Month on Month Inflation Rates<br />
Percent<br />
LCMS III to capture Seasonal Variations in<br />
Poverty Levels<br />
<strong>The</strong> on-going Living Conditions Monitoring<br />
Survey III will for the first time highlight the<br />
seasonal variations in poverty levels in<br />
<strong>Zambia</strong>. Unlike in the past, when poverty was<br />
measured at a point in time, it is now being<br />
captured over a period <strong>of</strong> twelve months.<br />
Poverty levels have been known to vary with<br />
season, especially in rural areas. A survey <strong>of</strong><br />
this nature and scope, which has taken into<br />
account the seasonal variations, will provide<br />
more accurate poverty levels and indicators.<br />
<strong>The</strong> survey will provide valuable and timely<br />
information that is accurate and vital for<br />
monitoring and evaluating the performance<br />
<strong>of</strong> the Poverty Reduction Strategy (PRS) and<br />
the Transitional National Development Plan<br />
(TNDP), as well as efforts aimed at improving<br />
the welfare <strong>of</strong> the <strong>Zambia</strong>n people by both<br />
Government and its development cooperating<br />
partners.<br />
100<br />
90<br />
80<br />
70<br />
60<br />
50<br />
40<br />
30<br />
20<br />
10<br />
0<br />
Incidence <strong>of</strong> Poverty by Household Size, 1991 - 1998<br />
1991 1996 1998<br />
1 member '2-3 '4-6 '7-9 '10-12 '13-15 16+<br />
Household Size<br />
4<br />
Percent<br />
3<br />
2<br />
1<br />
0<br />
Services.<br />
Nov-02 Dec-02 Jan-03 Feb-03 Mar-03 Apr-03<br />
Your <strong>Monthly</strong> Food Basket<br />
<strong>The</strong> food basket as <strong>of</strong> <strong>April</strong> <strong>2003</strong><br />
was K474,111 for a family <strong>of</strong> six.<br />
<strong>The</strong> same family on average was<br />
expected to live on K680,818 for<br />
all their basic needs<br />
Vulnerability to poverty tends to increase with<br />
household size.<br />
Poverty levels increased from 69.7% (1991) and<br />
69.2% (1996) to 73.2 in 1998.<br />
Urban areas have seen major increase in Poverty<br />
than rural areas between 1991 and 1998.<br />
Western and Northern provinces exhibit the highest<br />
Poverty levels. Western Province has experienced<br />
an increase in Poverty levels from 84.3% in 1991 to<br />
89.2% in 1998.<br />
Source: LCMS Reports
‘<strong>The</strong> <strong>Monthly</strong>’ <strong>Central</strong> <strong>Statistical</strong> <strong>Office</strong> Page 3<br />
Agriculture ‘pulled down’ economic<br />
performance in 2002<br />
Overall, the economy experienced a positive<br />
growth in the year 2002. Total Gross<br />
Domestic Product measured at constant<br />
(1994) prices was estimated at K2,701.9<br />
billion in 2002 and K2,622.5 billion in 2001,<br />
representing an increase <strong>of</strong> 3.0% in 2002<br />
compared to 4.9% in 2001. This increase<br />
could be attributed mainly to the satisfactory<br />
performance <strong>of</strong> the Mining, Manufacturing,<br />
Construction, Wholesale and Retail Trade,<br />
Transport and Communications and the Real<br />
Estate and Business Services sub-sectors.<br />
“Changes in GDP at constant prices are used<br />
in assessing the performance (growth) <strong>of</strong> the<br />
economy. An increase in the aggregate GDP at<br />
constant prices indicates increased economic<br />
activity and production in the nation.”<br />
Revenue from Exports rises as the value<br />
<strong>of</strong> imports rises too<br />
<strong>The</strong> Total Value <strong>of</strong> revenue from exports<br />
increased from K217 billion in January to<br />
K350 billion in February, <strong>2003</strong>. This<br />
represents a 29.2% rise.<br />
Major Exports<br />
7<br />
6<br />
5<br />
4<br />
3<br />
2<br />
1<br />
0<br />
Real Growth Rates <strong>of</strong> GDP at constant 1994 prices,<br />
1995 - 2002<br />
<strong>The</strong> Major Exports in the months <strong>of</strong> January<br />
and February were Copper and Cobalt.<br />
Copper accounted for K184 billion in<br />
January, and K201 billion in February while<br />
Cobalt accounted for K17 billion and K18<br />
billion in revenue, over the same period. This<br />
represented a nominal growth in terms <strong>of</strong><br />
Cobalt revenue <strong>of</strong> about 1%.<br />
-1<br />
-2<br />
-3<br />
1995<br />
1996<br />
1997<br />
1998<br />
Years<br />
Note: <strong>The</strong> 2002 figures are preliminary and are likely<br />
to undergo revision.<br />
However, declines in economic performance<br />
were recorded mainly in Agriculture, Forestry<br />
and Fishing, and the Electricity, Gas and<br />
Water sub-sectors. <strong>The</strong> decline in agricultural<br />
output, estimated at 4.1%, had an overall<br />
dampening effect on the growth <strong>of</strong> the<br />
economy as the sector accounts for about 16%<br />
share <strong>of</strong> the overall GDP.<br />
<strong>The</strong> Mining and Quarrying sub-sector grew<br />
by 16.4% in 2002 compared to 14.0% in<br />
2001. Manufacturing grew by 5.8%,<br />
Construction grew by 17.4%, Wholesale and<br />
Retail Trade (4.0%), Restaurants, Bars and<br />
Hotels (4.7%), Transport, Storage and<br />
Communications (5.4%), Financial<br />
Institutions and Insurance (3.5%), Real Estate<br />
and Business Services (4.4%)and<br />
Community, Social and Personal Services<br />
(1.6%).<br />
1999<br />
2000<br />
2001<br />
2002<br />
Billions<br />
250<br />
200<br />
150<br />
100<br />
50<br />
0<br />
<strong>Monthly</strong> Exports <strong>of</strong> Selected Products (in ZMK)<br />
Copper & articles there<strong>of</strong> Cobalt Natural/cultured pearls<br />
Major Imports<br />
precious/sem-precious stone<br />
Product Category<br />
Phamaceutcal<br />
'January <strong>2003</strong><br />
'February <strong>2003</strong><br />
Similarly, the Total <strong>Monthly</strong> Import value<br />
increased during the January to February<br />
period. <strong>The</strong> total imports value was K503<br />
billion in January and increased to K674<br />
billion in February, representing a 34.1%<br />
nominal growth.<br />
Note: Exports and imports figures are<br />
preliminary and are subject to change.<br />
Cotton
‘<strong>The</strong> <strong>Monthly</strong>’ <strong>Central</strong> <strong>Statistical</strong> <strong>Office</strong> Page 4<br />
120<br />
<strong>Monthly</strong> Imports <strong>of</strong> Selected Products (in ZMK)<br />
This is lower than the preliminary figures<br />
released earlier in <strong>April</strong> 2001, which were<br />
Population Distribution by Province, <strong>Zambia</strong>, 2000<br />
Billions<br />
100<br />
80<br />
60<br />
40<br />
Jan-03<br />
Feb-03<br />
North Western<br />
6%<br />
Southern<br />
12%<br />
Western<br />
8%<br />
<strong>Central</strong><br />
10%<br />
Copperbelt<br />
16%<br />
20<br />
0<br />
Nuclear reactors<br />
boilers machinery<br />
& mechanical<br />
applian<br />
Mineral fuels<br />
mineral oils &<br />
products <strong>of</strong> their<br />
distilla<br />
Inorganic<br />
chemicals:<br />
organic/inorganic<br />
compounds <strong>of</strong> pr'<br />
Books<br />
newspapers<br />
pictures & other<br />
products <strong>of</strong><br />
Product Category<br />
Nuclear reactors, boilers machinery &<br />
mechanical appliances, Products <strong>of</strong> printing<br />
(including news print paper) were some <strong>of</strong><br />
the major products imported over this period.<br />
Cereals recorded an increase <strong>of</strong> about 51%<br />
over this period.<br />
“European Union ranks second as <strong>Zambia</strong>’s<br />
trading partners after South Africa.”<br />
Final 2000 Population figure out<br />
Amid the controversy surrounding the 2000<br />
total population <strong>of</strong> <strong>Zambia</strong>, CSO has finally<br />
confirmed the <strong>of</strong>ficial figure as 9,885,591.<br />
This reflects the Dejure figure as opposed to<br />
the earlier Defacto figure <strong>of</strong> 9,337,425<br />
released late last year. (Dejure and Defacto<br />
explained on page 7).<br />
Population (Millions)<br />
12<br />
10<br />
8<br />
6<br />
4<br />
2<br />
0<br />
4.1<br />
Total Population <strong>of</strong> <strong>Zambia</strong>, 1969-2000<br />
5.7<br />
1969 Census 1980 Census 1990 Census 2000 Census<br />
Total Population<br />
printing<br />
7.8<br />
Electrical<br />
machinery &<br />
equipment &<br />
parts there<strong>of</strong><br />
Cereals<br />
9.9<br />
Northern<br />
13%<br />
Lusaka<br />
14%<br />
Luapula<br />
8%<br />
Eastern<br />
13%<br />
based on the summary count estimates<br />
(10,285,631).<br />
<strong>Zambia</strong> continues to exhibit a YOUNG<br />
population with 46% below the age <strong>of</strong> 15<br />
years. A young population tends to have<br />
implications on population growth, due to a<br />
large number <strong>of</strong> young persons entering the<br />
reproductive ages in the coming years.<br />
<strong>The</strong> population distribution pattern at<br />
provincial level remains the same with<br />
Copperbelt having the highest population,<br />
followed by Lusaka. Northwestern has the<br />
lowest population followed by Luapula.<br />
“ Males outnumber Females”<br />
Unexpectedly results from the 2000 census reveal<br />
that males surpass females, the total population<br />
comprises 4,946,298 males and 4,939,293 females.<br />
Western Province has the highest<br />
proportion <strong>of</strong> female headed<br />
households…<br />
<strong>The</strong> proportion <strong>of</strong> female-headed households<br />
has increased by 2% between 1990 and 2000<br />
with Western Province having the highest<br />
proportion <strong>of</strong> female-headed households at<br />
27%.<br />
<strong>Zambia</strong>n women now bear one child less<br />
than before<br />
Fertility in <strong>Zambia</strong> shows a downward trend in the<br />
last 20 years. Total Fertility declined to 6.7% in<br />
1990 from 7.2% in 1980 and finally to 6.0% in the<br />
year 2000. Fertility has declined more rapidly in<br />
the period 1990-2000. However, <strong>Zambia</strong> still has<br />
one <strong>of</strong> the highest fertility levels in the region<br />
despite the decline.
‘<strong>The</strong> <strong>Monthly</strong>’ <strong>Central</strong> <strong>Statistical</strong> <strong>Office</strong> Page 5<br />
Infant Mortality remains high …<br />
TFR<br />
8<br />
7<br />
6<br />
5<br />
4<br />
3<br />
Total Fertility in <strong>Zambia</strong>,1980-2000<br />
Infant Mortality Rate remains high in <strong>Zambia</strong><br />
with 1 in 9 infants dying before their first<br />
birthday. However, it has declined over the<br />
last ten years by 12%. North-western province<br />
has the least infant mortality rates with 1 in<br />
12 dying before their first birthday compared<br />
to 1 in 7 for Western province, which has the<br />
2<br />
1<br />
0<br />
1980 Census 1990 Census 2000 Census<br />
Years<br />
North-Western: glimmer <strong>of</strong> hope for<br />
<strong>Zambia</strong><br />
Estimate from the 2000 Census show that<br />
there has been an increase in Life expectancy<br />
at birth between 1990 and 2000. It rose from<br />
47 to 50 years in the ten year period, an<br />
improvement <strong>of</strong> 3 years. It is also observed<br />
that the newly born babies in urban areas<br />
have a higher expectation <strong>of</strong> life at birth than<br />
their rural counterparts. (54 years compared<br />
to 48 years, respective). At provincial level,<br />
North-western province registered the<br />
highest life expectancy at birth <strong>of</strong> 56 years,<br />
compared with the lowest, Western province<br />
at 44 years.<br />
Adults in <strong>Zambia</strong> now (2000) live 11<br />
years less than in 1990<br />
Adults mortality has increased in the last decade,<br />
an adult has lost about 11 years <strong>of</strong> survival (33<br />
years in 2000 compared to 44 years in 1990). At<br />
provincial level, adult survivorship level vary<br />
significantly. North-western province has the least<br />
Adult mortality risks whereas the Copperbelt<br />
province has the greatest risks <strong>of</strong> adults not<br />
surviving to older ages. Southern province showed<br />
a drastic decline in adult survivorship levels<br />
between age 25 and 35, while the rest <strong>of</strong> the<br />
provinces showed a steady decline.<br />
Females in the reproductive ages have higher<br />
mortality than their male counterparts. In 2000,<br />
there were 434,000 fewer adults aged 15 years and<br />
older than would have been if adult mortality<br />
levels had remained at levels observed in the<br />
1980-1990 inter-censal period.<br />
Deaths per 1000<br />
160<br />
140<br />
120<br />
100<br />
80<br />
60<br />
40<br />
20<br />
0<br />
100<br />
Infant Mortality Rate by Province, <strong>Zambia</strong> 2000<br />
91<br />
129 132<br />
highest rates <strong>of</strong> infant mortality.<br />
88<br />
<strong>Central</strong> Copperbelt Eastern Luapula Lusaka Northern N/Western Southern Western<br />
Province<br />
Luapula province has the highest<br />
Under-five deaths…<br />
Results from the 2000 census reveal that the<br />
number <strong>of</strong> children that die before their fifthbirthday<br />
has increased in <strong>Zambia</strong> between<br />
1990 and 2000 by about 7%, with Luapula<br />
province recording the highest. One in four<br />
under-five children in Luapula die before<br />
their fifth birthday. Copperbelt and Lusaka<br />
provinces recorded the least under-five<br />
deaths.<br />
Lusaka leads in unemployment levels<br />
Census 2000 shows increased unemployment<br />
rates in urban provinces. Unemployment<br />
rates increased in Lusaka from 14% to 26%<br />
and in Copperbelt from 17% to 24%. Declines<br />
were recorded most in Western (21% to 5%)<br />
and North Western (18% to 8%).<br />
Furthermore Lusaka and Copperbelt<br />
provinces recorded the highest urban<br />
unemployment trends, (14% to 30% and 17%<br />
to 25%, respectively). Western and Eastern<br />
provinces recorded the biggest declines (21%<br />
to 4% and 17% to 3%, respectively).<br />
Lusaka and Copperbelt registered the highest<br />
growths in rural unemployment rates; 13% to<br />
24% for Lusaka and 15% to 24% for<br />
Copperbelt.<br />
130<br />
83<br />
93<br />
140
‘<strong>The</strong> <strong>Monthly</strong>’ <strong>Central</strong> <strong>Statistical</strong> <strong>Office</strong> Page 6<br />
<strong>The</strong> rate <strong>of</strong> urbanization has continued<br />
to decline…<br />
<strong>The</strong> more urbanized provinces are not attracting<br />
migrants as indicated by the decline in the<br />
number <strong>of</strong> migrants to the Copperbelt, <strong>Central</strong>,<br />
Lusaka and Southern provinces. On the other<br />
hand, in-migration to rural provinces has<br />
increased in nearly all the provinces. This<br />
indicates that there<br />
is predominance <strong>of</strong> urban-rural migration over<br />
rural-urban migration.<br />
<strong>The</strong>re has been a sustained decline in the number<br />
<strong>of</strong> immigrants into the country. <strong>Zambia</strong> recorded<br />
a decline <strong>of</strong> immigrants between 1980 and 1990 <strong>of</strong><br />
34%. This was followed by a 6% decline between<br />
1990 and 2000. <strong>The</strong> majority <strong>of</strong> immigrants<br />
captured during the 2000 Census <strong>of</strong> Population<br />
and Housing are political refugees.<br />
Less than one percent <strong>of</strong> the population<br />
is disabled…<br />
According to the 2000 Census <strong>of</strong> Population and<br />
Housing 0.7% <strong>of</strong> the population is disabled.<br />
Western province has the largest proportion <strong>of</strong> the<br />
disabled, with Lusaka having the least percentage<br />
<strong>of</strong> the disabled. <strong>The</strong>re are more disabled males<br />
(53%) than females (47%).<br />
Literacy rates lowest in Eastern<br />
province<br />
Results from the 2000 census reveal that the<br />
general literacy rate (proportion <strong>of</strong> literate<br />
population aged 5 years and above) for <strong>Zambia</strong><br />
has stagnated at 55% since 1990. Despite this,<br />
youth literacy rates (15-24 years) have declined<br />
from 75% in 1990 to 70% in 2000. While there has<br />
been a slight increase in adult literacy (proportion<br />
<strong>of</strong> literate population aged 15 years and above),<br />
from 60% to 67%.<br />
Eastern province has the lowest literacy levels,<br />
with the general literacy rate at 38% compared to<br />
Lusaka and Copperbelt with the highest (70% and<br />
71%, respectively). Youth and Adult literacy rates<br />
are also low in Eastern province compared to the<br />
rest <strong>of</strong> the provinces at 50% and 48%,<br />
respectively.<br />
HIV/AIDS levels in urban areas double<br />
those for rural areas<br />
According to the 2001/2 <strong>Zambia</strong><br />
Demographic and Health Survey conducted<br />
by the CSO, 23% <strong>of</strong> urban population is HIV<br />
positive compared to 11% <strong>of</strong> the population in<br />
rural areas.<br />
This has been confirmed by the high<br />
prevalence rates for urban provinces, Lusaka<br />
and Copperbelt, which lead the levels <strong>of</strong> HIV<br />
at 22% and 20% for Lusaka and Copperbelt<br />
province respectively. <strong>The</strong> ZDHS results also<br />
indicate that there are distinct differences<br />
between women and men in the age pattern<br />
<strong>of</strong> HIV infection. Survey results show that<br />
HIV is higher among women (18%) than men<br />
(13%). Women have much higher infection<br />
levels under age 35 than men. However,<br />
among the population age 40 and older, HIV<br />
infection rates are higher for men than<br />
women.<br />
Precent<br />
25<br />
20<br />
15<br />
10<br />
5<br />
0<br />
Precent<br />
8.3<br />
35<br />
30<br />
25<br />
20<br />
15<br />
10<br />
5<br />
0<br />
9.2<br />
HIV Prevalence Rate by Province<br />
11.2<br />
13.1 13.7<br />
15.3<br />
Age - Sex Pattern <strong>of</strong> HIV<br />
'15-19 '20-24 '25-29 '30-34 '35-39 '40-44 '45-49<br />
Age Group<br />
17.6<br />
Males<br />
19.9<br />
Northern N/Western Luapula Western Eastern <strong>Central</strong> Southern Copperbelt Lusaka<br />
Province<br />
Note: <strong>The</strong>se rates are preliminary, more in the Final<br />
report<br />
At the National level, the survey results show<br />
that one in six adults aged 15 to 49 years is<br />
HIV positive, the proportion found to be HIV<br />
positive rises from a level <strong>of</strong> 5% among 15-19<br />
year olds to 25% among those individuals age<br />
30-34, before falling to a level <strong>of</strong> 17 among<br />
the 45-49 age group.<br />
22<br />
Females
‘<strong>The</strong> <strong>Monthly</strong>’ <strong>Central</strong> <strong>Statistical</strong> <strong>Office</strong> Page 7<br />
Low Condom use with non-regular<br />
partners contributing to High HIV<br />
infections<br />
Condom use is one <strong>of</strong> the most important<br />
means <strong>of</strong> preventing the spread <strong>of</strong> HIV/AIDS<br />
and other STIs. <strong>The</strong> ZDHS results indicate<br />
that efforts to promote condom use among<br />
<strong>Zambia</strong>ns are having some impact; however,<br />
many individuals are still not using condoms<br />
in situations where the risk <strong>of</strong> contracting<br />
HIV or another STI is high. For example, only<br />
44% <strong>of</strong> <strong>Zambia</strong>n men aged 15-59 and 31% <strong>of</strong><br />
women aged 15-49 used a condom the last<br />
time they had sex with someone other than<br />
their spouse or live-in partner.<br />
Precent<br />
40<br />
35<br />
30<br />
25<br />
20<br />
15<br />
10<br />
5<br />
0<br />
Net Secondary School Attendance Rates, 2002<br />
37.6<br />
28.2<br />
24.2<br />
19.6<br />
17<br />
15.3<br />
15.7<br />
13.2<br />
8.3<br />
<strong>Central</strong> Copperbelt Eastern Luapula Lusaka Northern N/Western Southern Western<br />
Province<br />
“Eastern Province Lags behind in<br />
Education”<br />
Results from the first comprehensive nationwide<br />
survey on education indicate that the<br />
Eastern province lags behind in terms <strong>of</strong><br />
education. According to the results <strong>of</strong> the<br />
2002 <strong>Zambia</strong> Demographic and Education<br />
Survey (ZDES) conducted by the CSO,<br />
Eastern Province has the lowest Primary<br />
school attendance rate (54%) compared with<br />
North Western Province (78%), which had<br />
the highest primary attendance rates.<br />
<strong>The</strong> survey also shows that Eastern Province<br />
has the lowest secondary school attendance<br />
rates at only 8%, with Copperbelt Province<br />
having the highest secondary school<br />
attendance rates <strong>of</strong> 38%.<br />
Eastern province had the highest percentage<br />
<strong>of</strong> children (15%), citing household labour<br />
contribution as the reason for not attending<br />
school.<br />
Precent<br />
90<br />
80<br />
70<br />
60<br />
50<br />
40<br />
30<br />
20<br />
10<br />
0<br />
Net Primary School Attendance Rates, 2002<br />
<strong>Central</strong> Copperbelt Eastern Luapula Lusaka Northern N/Western Southern Western<br />
Province<br />
This section is aimed at helping the laymen understand<br />
some <strong>of</strong> the <strong>Statistical</strong> terminology and phrases in order<br />
to enhance understanding <strong>of</strong> the subject and the figures<br />
behind the terminology or phrase. In this issue we look<br />
at three important phrases, De jure Population, De<br />
Facto Population and Life Expectancy at Birth.<br />
De jure Population: Refers to the<br />
Country’s “true population”. It is the people<br />
counted at their homes during the Census as<br />
present when the Census Enumerator visited<br />
the home, plus those that were temporarily<br />
away from their home e.g. school children in<br />
Boarding school, Patients in Hospital and<br />
people temporarily away from home for any<br />
other reason. It is referred to as the “True<br />
Population” because it includes all people<br />
present at home and those temporarily away<br />
from home at the time <strong>of</strong> the Census.<br />
De Facto Population: Refers to the total<br />
population <strong>of</strong> the country at particular point<br />
in time, and includes people counted at their<br />
home during the Census as present when the<br />
enumerator visited the home, plus all visitors<br />
present in the home at the time <strong>of</strong> the<br />
enumerator’s visit. It does not include any<br />
persons absent from their homes at the time<br />
the Census enumerator visited the home.<br />
Life Expectancy at Birth: Refers to the<br />
number <strong>of</strong> years that a child born at a<br />
particular time will live. This involves taking<br />
into consideration the existing health<br />
conditions and chances <strong>of</strong> diseases and death<br />
at the particular time. As an example, a baby<br />
born in 2000 is expected to live about 50<br />
years and an adult aged 15 years in 2000 is<br />
expected to live about 33 years.
‘<strong>The</strong> <strong>Monthly</strong>’ <strong>Central</strong> <strong>Statistical</strong> <strong>Office</strong> Page 8<br />
Whenever people hear <strong>of</strong> ‘Sales’ automatically their minds switch to pr<strong>of</strong>its, but that is not the<br />
case with the CSO Sales <strong>Office</strong>. <strong>The</strong> value <strong>of</strong> the publications on sale cannot compare with the<br />
prices at which they are sold. This is because CSO does not aim to make pr<strong>of</strong>its but to equip the<br />
<strong>Zambia</strong>n people with information they very much need.<br />
Are you in need <strong>of</strong> statistical information? then visit the CSO Sales <strong>Office</strong> and look at the various<br />
publications and information products in stock. We may be stocking just what you need for your<br />
informed decision.<br />
‘REMEMBER STATISTICS ARE KEY TO NATIONAL DEVELOPMENT’.<br />
<strong>Central</strong> <strong>Statistical</strong> <strong>Office</strong> insists on requests for information to be provided in writing specifying, as<br />
clearly as possible information required. <strong>The</strong> requests should be addressed to <strong>The</strong> Director,<br />
CSO, P. O. Box 31908, Lusaka – ZAMBIA.<br />
Below are telephone numbers for both CSO Headquarters and Provincial <strong>Office</strong>s<br />
CSO Headquarters 260-01-251377/253468<br />
Provincial <strong>Office</strong>s<br />
<strong>Central</strong> - Kabwe 260-05-223655/223795<br />
Copperbelt - Ndola 260-02-613624/613427<br />
Eastern - Chipata 260-06-221340/221497<br />
Luapula - Mansa 260-03-821114<br />
Northern - Kasama 260-04-221214<br />
North Western - Solwezi 260-08-821263/821577/8<br />
Western - Mongu 260-03-323124<br />
Southern - Livingstone 260-07-221252/221783<br />
1. Dr. Buleti G. Nsemukila Director<br />
2. Christine S. Chikolwa Publications and Marketing <strong>Office</strong>r<br />
3. Sheila S. Mudenda Operations Manager<br />
4. Richard Banda Demographer<br />
5. Chola Nakazwe Statistician<br />
6. Musale H. Banda Operations <strong>Office</strong>r<br />
7. Anthony Nkole Desktop Publishing <strong>Office</strong>r<br />
8. Perry Musenge Desktop Publishing <strong>Office</strong>r<br />
9. Chisuwa Sandu Press Liaison <strong>Office</strong>r<br />
10. Henry Zulu Information Desk <strong>Office</strong>r