Vol 12 2004 The Monthly March.pdf - Central Statistical Office of ...
Vol 12 2004 The Monthly March.pdf - Central Statistical Office of ...
Vol 12 2004 The Monthly March.pdf - Central Statistical Office of ...

Create successful ePaper yourself
Turn your PDF publications into a flip-book with our unique Google optimized e-Paper software.
Republic <strong>of</strong> Zambia<br />
<strong>The</strong><br />
<strong>Monthly</strong><br />
<strong>Central</strong> <strong>Statistical</strong> <strong>Office</strong><br />
<strong>Vol</strong>ume <strong>12</strong> Website: www.zamstats.gov.zm <strong>March</strong>, <strong>2004</strong><br />
Economic Indicators<br />
Higher Food Prices Contribute to <strong>March</strong><br />
Inflation<br />
<strong>The</strong> monthly inflation rate was recorded at 1.5<br />
percent as at <strong>March</strong> <strong>2004</strong>, representing 0.4 <strong>of</strong> a<br />
percentage point increase on the February rate<br />
<strong>of</strong> 1.1 percent. <strong>Monthly</strong> inflation rates for the<br />
Metropolitan Low, High Income and Non-<br />
Metropolitan Groups were recorded at 1.8, 1.0<br />
and 1.6 percent, respectively.<br />
Percentage<br />
4<br />
3.5<br />
3<br />
2.5<br />
2<br />
1.5<br />
1<br />
0.5<br />
0<br />
-0.5<br />
Month on Month Inflation Rates,<br />
<strong>March</strong> 2003 - <strong>March</strong> <strong>2004</strong><br />
Mar Apr May June Jul Aug Sept Oct Nov Dec Jan Feb Mar<br />
Months<br />
Composite<br />
Source: CSO, Consumer Price Index, <strong>March</strong> <strong>2004</strong><br />
<strong>The</strong> annual rate <strong>of</strong> inflation stood at 17.6<br />
percent in <strong>March</strong> <strong>2004</strong>. This rate is 0.8 <strong>of</strong> a<br />
percentage point higher than the February rate<br />
<strong>of</strong> 16.8 percent. Compared with <strong>March</strong> 2003,<br />
the annual rate <strong>of</strong> inflation declined by 5.0<br />
percentage points, from 22.6 percent in <strong>March</strong><br />
2003 to 17.6 percent in <strong>March</strong> <strong>2004</strong>. Annual<br />
inflation rates for the Metropolitan Low, High<br />
Income and Non-Metropolitan Groups were<br />
recorded at 16.4, 18.3 and 17.9 percent,<br />
respectively.<br />
(Percentage)<br />
30<br />
25<br />
20<br />
15<br />
10<br />
5<br />
0<br />
Year on Year Inflation Rate<br />
<strong>March</strong> 2003 - <strong>March</strong> <strong>2004</strong><br />
Mar Apr May Jun Jul Aug Sept Oct Nov Dec Jan Feb Mar<br />
Composite<br />
Source: CSO, Consumer Price Index, <strong>March</strong> <strong>2004</strong><br />
<strong>The</strong> relatively higher level <strong>of</strong> inflation as<br />
recorded in <strong>March</strong> <strong>2004</strong>, was largely due to<br />
increases in food prices, especially maize meal<br />
and maize grain prices. <strong>The</strong> monthly food<br />
inflation rate shows an increase <strong>of</strong> 1.1<br />
percentage points, from 0.9 percent in February,<br />
<strong>2004</strong> to 2.0 percent in <strong>March</strong> <strong>2004</strong>. <strong>The</strong> annual<br />
food inflation rate was recorded at 15.9 percent<br />
at <strong>March</strong> <strong>2004</strong>, increasing by 3.0 percentage<br />
points on the February rate <strong>of</strong> <strong>12</strong>.9 percent.<br />
Contributing the most to the relatively higher<br />
food inflation were increases in the cost <strong>of</strong> maize<br />
meal, maize grain, other cereals, fresh meat,<br />
dried, fresh vegetables and bried fish (kapenta<br />
and bream). Furthermore, price increases were<br />
reported for fresh fruits, oils, fats and other<br />
processed food commodities. However price<br />
decreases were recorded for sweet potatoes and<br />
dried beans.<br />
<strong>The</strong> food basket as at <strong>March</strong> <strong>2004</strong> was K556,501 for<br />
a family <strong>of</strong> six. <strong>The</strong> same family on average was<br />
expected to live on K799, <strong>12</strong>8 for all their food &<br />
basic needs.<br />
<strong>Central</strong> <strong>Statistical</strong> <strong>Office</strong>, Nationalist Road, P.O. Box 31908, Lusaka ● Telefax:260-1-253468 ● E-mail:info@zamstats.gov.zm
<strong>The</strong> <strong>Monthly</strong><br />
<strong>The</strong> monthly Non-Food inflation rate declined<br />
from 1.4 percent in February <strong>2004</strong>, to 1.0 percent<br />
in <strong>March</strong> <strong>2004</strong>, decreasing by 0.4 <strong>of</strong> a percentage<br />
point. Similarly, the annual non-food inflation rate<br />
was recorded at 19.6 percent, decreasing by 2.0<br />
percent on the February rate <strong>of</strong> 21.6 percent.<br />
Percent<br />
4<br />
3<br />
2<br />
1<br />
0<br />
-1<br />
-2<br />
CPI Food and Non Food Index,<br />
2003 - <strong>2004</strong><br />
Mar Apr May Jun Jul Aug Sept Oct Nov Dec Jan Feb Mar<br />
Food Non Food Total<br />
Source: CSO, Consumer Price Index, <strong>March</strong> <strong>2004</strong><br />
Higher Food Prices Prevail in <strong>March</strong> <strong>2004</strong><br />
A comparison <strong>of</strong> prices between February and<br />
<strong>March</strong> <strong>2004</strong>, shows that the average price <strong>of</strong> a<br />
25kg bag <strong>of</strong> Roller Meal increased by 5.3 percent,<br />
from K25,794 in February to K27,162 in <strong>March</strong><br />
<strong>2004</strong>, while the price <strong>of</strong> Maize Grain measured in a<br />
20-litre tin increased by 14.5 percent. <strong>The</strong> average<br />
price <strong>of</strong> 1kg <strong>of</strong> dried Mpulungu Kapenta showed an<br />
increase <strong>of</strong> 8.2 percent. And the average price <strong>of</strong><br />
1kg <strong>of</strong> onion went up by 22.5 percent during the<br />
month.<br />
National Average Prices for Selected Products<br />
Products February <strong>March</strong><br />
Percentage<br />
Change (%)<br />
White breakfast 25kg 32,1<strong>12</strong> 33,565 4.5<br />
White roller 25 kg 25,794 27,162 5.3<br />
White maize 20 ltr tin 13,163 15,066 14.5<br />
Samp 1kg 2,431 3,366 38.5<br />
Rice local 1kg 3,<strong>12</strong>8 3,276 4.7<br />
Dried Kapenta Mpulungu 28,538 30,886 8.2<br />
Dried Bream 17,569 18,861 7.4<br />
Onion 2,934 3,594 22.5<br />
Tomatoes 2,217 2,487 <strong>12</strong>.2<br />
Mixed Cut 10,843 11,<strong>12</strong>0 2.6<br />
Source: CSO, Consumer Price Index, <strong>March</strong> <strong>2004</strong><br />
International Trade<br />
Exports Record a Decrease!<br />
<strong>The</strong> total value <strong>of</strong> export earnings for the month <strong>of</strong><br />
February <strong>2004</strong> was K428,795 million as compared<br />
to K457,293 million in January, <strong>2004</strong>. This is<br />
equivalent to a six percent decline in the total<br />
value <strong>of</strong> export revenues. <strong>The</strong> decline in earnings<br />
<strong>Central</strong> <strong>Statistical</strong> <strong>Office</strong><br />
could be attributed mainly to the drop in export<br />
values <strong>of</strong> refined copper, copper ores &<br />
concentrates, intermediate products <strong>of</strong> cobalt<br />
metallurgy, cotton-not carded or combed, cane<br />
sugar, precious/semi-precious stones, c<strong>of</strong>fee not<br />
roasted, Portland cement and cut flowers & flower<br />
buds.<br />
Domestic exports (exports <strong>of</strong> locally produced<br />
goods) declined to K426,055 million in February<br />
from K454,377 million in January <strong>2004</strong>. Domestic<br />
exports accounted for 99 percent shares <strong>of</strong> total<br />
exports while the remaining one percent represents<br />
re-exports (exports <strong>of</strong> originally imported goods in<br />
free circulation).<br />
Period<br />
Total Exports and Imports, Jan – Dec 2003<br />
and Jan – Feb, <strong>2004</strong>, (K’ Millions)<br />
Imports (cif)<br />
Domestic<br />
Exports<br />
(fob)<br />
Re-Exports<br />
(fob)<br />
Total<br />
Exports<br />
(fob)<br />
Trade<br />
Balance<br />
3-Jan 592,175 269,450 1,345 270,795 -321,380<br />
3-Feb 700,380 347,626 583 348,209 -352,171<br />
3-Mar 635,234 346,566 2,069 348,635 -286,599<br />
Sub-Total Q1 1,927,789 963,642 3,997 967,639 -960,150<br />
3-Apr 606,291 3<strong>12</strong>,136 1,088 313,224 -293,067<br />
3-May 595,376 401,796 9,828 411,624 -183,752<br />
3-Jun 564,006 422,585 2,222 424,807 -139,199<br />
Sub-Total Q2 1,765,673 1,136,517 13,138 1,149,655 -616,018<br />
3-Jul 542,724 429,302 1,263 430,565 -1<strong>12</strong>,159<br />
3-Aug 577,888 384,860 1,723 386,583 -191,305<br />
3-Sep 518,229 382,377 3,484 385,861 -132,368<br />
Sub-Total Q3 1,638,841 1,196,539 6,470 1,203,009 -435,832<br />
3-Oct 619,260 391,794 6,100 397,894 -221,366<br />
3-Nov 695,711 442,5<strong>12</strong> 1,723 444,235 -251,476<br />
3-Dec 675,541 313,326 3,431 316,757 -358,784<br />
Sub-Total Q4 1,990,5<strong>12</strong> 1,147,632 11,254 1,158,886 -831,626<br />
Grand Total 03 7,899,777 4,898,707 37,775 4,936,482 -2,963,295<br />
Jan -04* 576,962 454,377 2,916 457,293 -119,669<br />
Feb -04* 559,520 426,055 2,740 428,795 -130,725<br />
Note: (*) Provisional<br />
Source: CSO, International Trade Statistics, <strong>2004</strong><br />
For the month <strong>of</strong> February, imports recorded<br />
K559,520 million compared with K576,962 million<br />
in January. This represents a marginal decrease <strong>of</strong> 3<br />
percent. Some <strong>of</strong> the products that contributed to<br />
this decrease are mainly motor vehicles for<br />
transporting goods and persons, fertilizers, worn<br />
clothing & other worn articles, medicaments in<br />
measured doses, salts, foot wear, co-axial cables &<br />
other co-axial conductors and liquid dielectric<br />
transformers.<br />
Page 2
\<br />
<strong>The</strong> <strong>Monthly</strong><br />
Imports by SITC Sections, January to February <strong>2004</strong><br />
in (K’ Millions)<br />
Section Description Jan-04 Feb-04 Total<br />
0 Food & Live Animals 31,784 44,641 76,425<br />
1 Beverages & Tobacco 730 686 1,416<br />
2 Crude Materials, (Exc. Fuels) 31,860 26,683 58,543<br />
3 Mineral Fuels, Lubricants & Related Materials 113,669 59,983 173,652<br />
4 Animal & Vegetable Oils, Fats & Waxes 14,059 19,457 33,516<br />
5 Chemicals 100,091 116,842 216,933<br />
6 Manufactured Goods Classified Chiefly By Material 91,259 89,261 180,520<br />
7 Machinery & Transport Equipment 147,774 172,326 320,100<br />
8 Miscellaneous Manufactured Articles 42,053 29,632 71,685<br />
9 Commodities & Transactions Nec In Sitc 3,683 9 3,692<br />
TOTAL: 576,962 559,520 1,136,482<br />
Source: CSO, International Trade Statistics, <strong>2004</strong><br />
<strong>The</strong>se products accounted for a larger proportion<br />
<strong>of</strong> the total value <strong>of</strong> Zambia’s imports during the<br />
month <strong>of</strong> February as compared to January.<br />
Exports (fob) by SITC Sections, January to February<br />
<strong>2004</strong> in (K’ Millions)<br />
Section Description Jan-04 Feb-04 Total<br />
0 Food & Live Animals 27,865 52,393 80,258<br />
1 Beverages & Tobacco 10,590 20,131 30,721<br />
2 Crude Materials, (Exc. Fuels) 22,692 30,055 52,747<br />
3 Mineral Fuels, Lubricants & Related Materials 7,300 8,596 15,896<br />
4 Animal & Vegetable Oils, Fats & Waxes 310 428 738<br />
5 Chemicals 3,145 10,847 13,992<br />
6 Manufactured Goods Classified Chiefly By Material 370,724 299,795 670,519<br />
7 Machinery & Transport Equipment 13,077 4,169 17,246<br />
8 Miscellaneous Manufactured Articles 1,456 2,317 3,773<br />
9 Commodities & Transactions Nec In Sitc 134 63 197<br />
TOTAL: 457,293 428,794 886,087<br />
Note: (*) Provisional<br />
Source: CSO, International Trade Statistics, <strong>2004</strong><br />
Export trade was dominated mainly by<br />
manufactured goods classified chiefly by material,<br />
which includes refined copper and its articles,<br />
intermediate products <strong>of</strong> cobalt metallurgy, maize<br />
seed, precious or semi precious stones worked but<br />
not set. <strong>The</strong>se products accounted for about 98%<br />
percent <strong>of</strong> the total export revenue in January and<br />
February <strong>2004</strong>. Other products exported were<br />
petroleum oils & oils obtained from bituminous<br />
minerals and parts <strong>of</strong> machinery for sorting/ earth,<br />
stone, ores.<br />
Trade in K’ millions by Mode <strong>of</strong> transport,<br />
January to February <strong>2004</strong><br />
Code<br />
Transport Type<br />
Imports<br />
(Cif)<br />
Exports<br />
(Fob)<br />
20 Road Transport 578,948 539,<strong>12</strong>2<br />
30 Rail Transport 52,958 301,295<br />
40 Air Transport 131,848 45,670<br />
61 Multimodal - Sea & Rail 9,136 0<br />
62 Multimodal - Sea & Road 359,921 0<br />
63 Multimodal - Other 3,662 0<br />
90 Not Elsewhere Specified 9 0<br />
Total: 1,136,482 886,087<br />
Source: CSO, International Trade Statistics, <strong>2004</strong><br />
<strong>Central</strong> <strong>Statistical</strong> <strong>Office</strong><br />
Zambia’s merchandize trade is mainly through<br />
three main transport modes namely road, air and<br />
rail, and to some extent multimode (i.e. by Sea<br />
then rail and road). <strong>The</strong> major transport type used<br />
for the period January to February <strong>2004</strong> was road<br />
transport, which accounted for K578,948 million<br />
in terms <strong>of</strong> imports and K 539,<strong>12</strong>2 million for<br />
exports. During this period, air transport<br />
accounted for more in terms <strong>of</strong> imports while rail<br />
also recorded a high figure in terms <strong>of</strong> exports. <strong>The</strong><br />
major trading partners with Zambia’s during this<br />
period are United Kingdom, South Africa,<br />
Tanzania, Switzerland, India, Japan, China, Hong<br />
Kong, Kenya, Malawi, Zimbabwe and Congo (DR).<br />
Trade with SADC and COMESA Member States,<br />
Jan – Dec 2003 and Jan – Feb, <strong>2004</strong>, (K’ Millions)<br />
Jan-03 Feb-03 Jan-04 Feb-04<br />
COMESA:<br />
Exports (fob) 16,909 28,<strong>12</strong>3 52,749 74,202<br />
Imports (cif) 86,693 116,591 102,434 98,282<br />
Trade Balance -69,784 -88,468 -49,685 -24,080<br />
SADC:<br />
Exports (fob) 110,507 150,627 146,509 172,005<br />
Imports (cif) 303,513 469,080 337,489 343,605<br />
Trade Balance -193,006 -318,453 -190,980 -171,600<br />
WORLD:<br />
Exports (fob) 270,795 348,209 457,293 428,795<br />
Imports (cif) 592,175 700,380 576,962 559,520<br />
Trade Balance -321,380 -352,171 -119,669 -130,725<br />
Note: fob=free on board, cif=cost insurance and freight<br />
Source: CSO, International Trade Statistics, <strong>2004</strong><br />
Imports from COMESA in value terms decreased<br />
from K102,434 million in January to K98,282<br />
million in February <strong>2004</strong>. This trend is a reverse to<br />
that experienced during the same period in 2003.<br />
<strong>The</strong> major contributing products to this increase<br />
are refined palm oil, ammonium nitrate, soap &<br />
organic surface active products, agricultural or<br />
horticultural appliances for projecting liquids, wire<br />
<strong>of</strong> iron or non-alloy steel & rolled iron/steel and<br />
urea whether or not in aqueous solution.<br />
500,000<br />
450,000<br />
400,000<br />
350,000<br />
300,000<br />
250,000<br />
200,000<br />
150,000<br />
100,000<br />
50,000<br />
0<br />
Total imports (cif) from COMESA & SADC<br />
Jan-Feb 2003 & Jan-Feb <strong>2004</strong>, K'millions<br />
COMESA<br />
SADC<br />
Jan-03 Feb-03 Jan-04 Feb-04<br />
Source: CSO, International Trade Statistics, 2000/<strong>2004</strong><br />
Page 3
<strong>The</strong> <strong>Monthly</strong><br />
Import trade from SADC for the period January to<br />
February <strong>2004</strong> increased marginally by two<br />
percent. During the same period in 2003, the<br />
scenario was that <strong>of</strong> a significant increase in the<br />
total value <strong>of</strong> imports. However, some <strong>of</strong> the<br />
products related to this decline in import value in<br />
<strong>2004</strong> include motor vehicles, sulphuric acid, malt<br />
whether or not roasted, soap & organic surface<br />
active products and polyethylene in primary forms.<br />
Values<br />
200,000<br />
180,000<br />
160,000<br />
140,000<br />
<strong>12</strong>0,000<br />
100,000<br />
80,000<br />
60,000<br />
40,000<br />
20,000<br />
0<br />
Total Exports (fob) to COMESA & SADC Jan - Feb<br />
2003 & Jan - Feb <strong>2004</strong>, K'millions)<br />
COMESA<br />
SADC<br />
Jan-03 Feb-03 Jan-04 Feb-04<br />
Source: CSO, International Trade Statistics, 2003/<strong>2004</strong><br />
Exports to COMESA during the period January to<br />
February <strong>2004</strong> were generally on the increasing<br />
side, with the lowest figure <strong>of</strong> K52, 749 million<br />
recorded in January; and the highest figure <strong>of</strong><br />
K74,202 million in February; representing a<br />
41percent increase. <strong>The</strong> major products that led to<br />
the increase in the value <strong>of</strong> export earnings are<br />
maize seed, cane sugar-raw in solid form, refined<br />
copper, portland cement and tobacco not stemmed<br />
or stripped. <strong>The</strong> major recipients <strong>of</strong> exports from<br />
Zambia that contributed to the increase include<br />
Zimbabwe, Kenya, Congo (DR) and Malawi.<br />
Exports to SADC during the period January to<br />
February <strong>2004</strong> showed a similar pattern to that <strong>of</strong><br />
exports to COMESA. Total exports to SADC were<br />
K146,509 million in January and K 172,005 million<br />
in February; representing an increase <strong>of</strong> 17<br />
percent. This increase is mainly attributed to the<br />
high export values <strong>of</strong> the same products like to<br />
COMESA including also cotton yarn and cotton<br />
not carded or combed. <strong>The</strong> major trading partners<br />
within SADC are South Africa with the largest<br />
proportion, Zimbabwe, Tanzania Congo (DR),<br />
Botswana and Malawi.<br />
Prevalence Rates<br />
35.0<br />
30.0<br />
25.0<br />
20.0<br />
15.0<br />
10.0<br />
5.0<br />
0.0<br />
Health<br />
<strong>Central</strong> <strong>Statistical</strong> <strong>Office</strong><br />
Youth Participation in fight against<br />
HIV/AIDS vital<br />
HIV Prevalence Rates among males and<br />
females, Zambia 2001/2002<br />
6.6<br />
1.9<br />
4.4<br />
16.3<br />
15.0<br />
25.1<br />
20.5<br />
29.4<br />
22.422.6<br />
20.5 20.2<br />
17.3<br />
13.6<br />
15-19 20-24 25-29 30-34 35-39 40-44 45-49<br />
Age group<br />
Male<br />
Female<br />
Source: CSO, Zambia Demographic and Health Survey, 2001/02<br />
Zambia celebrated international youth day on <strong>12</strong>th<br />
march, whose theme was Youth participation in<br />
the fight against HIV/AIDS. It is very important<br />
that youths (i.e. people aged between 15 and 24)<br />
are incorporated in the fight against HIV/AIDS<br />
because even if the HIV prevalence rates among<br />
the youths are lower than the rates in the higher<br />
age groups, the youths’ knowledge, attitude and<br />
practice in matters concerning HIV/AIDS is <strong>of</strong><br />
concern. Results from the Zambia Demographic<br />
and Health survey show that 20 percent <strong>of</strong> females<br />
aged 15-19 and 14.4 percent <strong>of</strong> males <strong>of</strong> the same<br />
age group know no way <strong>of</strong> avoiding HIV/AIDS<br />
although the percentage <strong>of</strong> people who have heard<br />
<strong>of</strong> HIV/AIDS is universal. Youths are also less<br />
likely to discuss HIV/AIDS prevention with their<br />
partners. Only 55.5 percent females and 63 percent<br />
<strong>of</strong> males aged 15-24 reported having discussed<br />
HIV/AIDS prevention with their partners. When<br />
asked whether they used a condom during last<br />
sexual intercourse, only 30.2 percent <strong>of</strong> females age<br />
15-19 and 32.5 percent <strong>of</strong> males <strong>of</strong> the same age<br />
group reported using a condom during last sexual<br />
intercourse with a non-cohabiting partner. For<br />
those in age group 20-24, 38.2 percent <strong>of</strong> women<br />
and 51.9 percent <strong>of</strong> the males reported using a<br />
condom during last sexual intercourse with a noncohabiting<br />
partner.<br />
For the youths to participate effectively in the fight<br />
against HIV/AIDS, their literacy and education<br />
levels must be <strong>of</strong> acceptable standards.<br />
Page 4
<strong>The</strong> <strong>Monthly</strong><br />
<strong>The</strong> 2000 census reported that the literacy rate for<br />
the youth had declined from 74.9 percent in 1990<br />
to 70.1 percent in 2000.<br />
Lirate<br />
80.0<br />
70.0<br />
60.0<br />
50.0<br />
40.0<br />
30.0<br />
20.0<br />
10.0<br />
0.0<br />
Literacy rate by age group, Both sexes, Zambia,<br />
2000<br />
55.3<br />
55.3<br />
74.9<br />
70.1<br />
66.0<br />
5+ 15-24 15+<br />
Age group<br />
1990 2000<br />
67.2<br />
Source: CSO, 1990 and 2000 Censuses <strong>of</strong> Population and Housing<br />
<strong>The</strong> 2000 census also revealed that the youth’s<br />
school attendance has also gone down from 47.3<br />
percent in 1990 to 46.1 percent in 2000 for those<br />
in age group 15-19. For those in age group 20-24,<br />
the attendance rates reduced from 13.3 percent in<br />
1990 to 10.8 percent in 2000.<br />
Percent<br />
80<br />
70<br />
60<br />
50<br />
40<br />
30<br />
20<br />
10<br />
0<br />
Percent <strong>of</strong> population age 5 years and aove<br />
presently attending School, Both sexes,<br />
Zambia, 2000<br />
35.7<br />
28.8<br />
71.7<br />
66.4<br />
47.3 46.1<br />
13.3<br />
10.8<br />
4 3.8 2.4 2.9 1 1.6<br />
5-9 10-14 15-19 20-24 25-29 30-44 45+<br />
Age group<br />
1990 2000<br />
Source: CSO, 1990 and 2000 Censuses <strong>of</strong> Population and Housing<br />
World Summit for Children-Zambia’s<br />
Challenge<br />
In September 1990 Zambia was part <strong>of</strong> the World<br />
Summit that adopted a Declaration on the<br />
Survival, Protection and Development <strong>of</strong> Children<br />
and a Plan <strong>of</strong> Action for implementing the<br />
Declaration in the 1990s and beyond.<br />
<strong>Central</strong> <strong>Statistical</strong> <strong>Office</strong><br />
lack <strong>of</strong> clean water and inadequate sanitation and<br />
from the effects <strong>of</strong> the drug problem.<br />
Like the Millennium Development Goals, the goals<br />
set at the world summit for children are not only<br />
global but are also meant to identify priority areas<br />
for the improvement <strong>of</strong> child welfare and survival<br />
in respective member countries.<br />
While Zambia might have experienced some<br />
improvements in child indicators such as declines<br />
in infant and child mortality rates, the current<br />
levels are still considerably high and more efforts is<br />
required in order to ensure the survival <strong>of</strong> children<br />
to adulthood.<br />
<strong>The</strong> level <strong>of</strong> malnutrition as shown by the<br />
percentage <strong>of</strong> stunted children which is high at 47<br />
percent <strong>of</strong> under five children in Zambia points to<br />
the need to improve household food security and<br />
nutritional status <strong>of</strong> women and children.<br />
Selected World Summit for Children Indicators, Zambia 2001-2002<br />
Childhood<br />
mortality<br />
Childhood<br />
under<br />
nutrition<br />
Basic<br />
education<br />
Antenatal<br />
care<br />
Delivery care<br />
Low birth<br />
weight<br />
Iodized salt<br />
intake<br />
Vitamin A<br />
supplements<br />
Exclusive<br />
breastfeeding<br />
Vaccinations<br />
Infant mortality rate<br />
Under-five mortality rate<br />
Maternal Mortality rate<br />
Percent stunted (children under 5 years)<br />
Percent wasted (children under 5 years)<br />
Percent underweight (children under 5 years<br />
Proportion <strong>of</strong> children reaching grade 5 1<br />
Net primary school attendance rate 1<br />
Proportion <strong>of</strong> children entering primary school 1<br />
95 per 1,000<br />
168 per 1,000<br />
729 per 100,000<br />
46.8<br />
5.0<br />
28.1<br />
87.7<br />
67.1<br />
25.7<br />
Percent <strong>of</strong> women who received antenatal care<br />
from a health pr<strong>of</strong>essional 2 93.4<br />
Percent <strong>of</strong> births in the 5 years preceding the<br />
survey attended by a health pr<strong>of</strong>essional 43.4<br />
Percent <strong>of</strong> births in the 5 years preceding the<br />
survey at low birth weight 3 10.7<br />
Percent <strong>of</strong> households that use iodized salt 4 79.8<br />
Percent <strong>of</strong> children age 6-59 months who<br />
received a vitamin A dose in the 6 months<br />
67.4<br />
preceding the survey<br />
Percent <strong>of</strong> children under 6 months who are<br />
exclusively breastfed 40.1<br />
Percent <strong>of</strong> children age <strong>12</strong>-23 months with<br />
BCG vaccination<br />
94.0<br />
Percent <strong>of</strong> children age <strong>12</strong>-23 months with at<br />
least 3 DPT vaccinations<br />
80.0<br />
Percent <strong>of</strong> children age <strong>12</strong>-23 months with at<br />
least 3 polio vaccinations<br />
80.2<br />
Percent <strong>of</strong> children age <strong>12</strong>-23 months with<br />
measles vaccination<br />
84.4<br />
Percent <strong>of</strong> mothers who received at least 2<br />
tetanus toxoid vaccinations during pregnancy 1<br />
26.7<br />
1<br />
Based on De jure children<br />
2<br />
For the last live birth in the five years preceding the survey<br />
3<br />
For children without a reported birth weight, the proportion with low birth weight is<br />
assumed to be the same as the proportion with low birth weight in each birth size<br />
category among children who have a reported birth weight.<br />
4<br />
15 parts per million or more<br />
Parts <strong>of</strong> that declaration focuses on the fact that<br />
children suffer from the effects <strong>of</strong> poverty and<br />
economic declines or stagnation, from hunger and<br />
homelessness, from epidemics and illiteracy, from<br />
malnutrition and disease, including acquired<br />
immunodeficiency syndrome (AIDS), from the<br />
Page 5
<strong>The</strong> <strong>Monthly</strong><br />
Poverty<br />
Analysis <strong>of</strong> Household Expenditure Patterns<br />
Poverty analysis is not complete without a detailed<br />
analysis <strong>of</strong> household incomes and expenditure<br />
patterns as this forms an important indicator <strong>of</strong> the<br />
general welfare <strong>of</strong> a household.<br />
<strong>The</strong> proportion <strong>of</strong> household income spent on<br />
basic consumption items such as food provides a<br />
measure <strong>of</strong> how constrained a household is. Studies<br />
have shown that households in lower income<br />
brackets tend to spend a larger proportion <strong>of</strong> their<br />
incomes on food and other more basic items than<br />
on things considered luxuries.<br />
<strong>The</strong> CSO through the Living Conditions<br />
Monitoring surveys and other household budget<br />
and expenditure surveys has collected detailed<br />
information on household income and expenditure<br />
patterns, for example the 1998 LCMS showed that<br />
households in Zambia spent 59 percent <strong>of</strong> their<br />
incomes on Food, 4 percent on Education and 2<br />
percent on Medical care.<br />
(Percentage)<br />
70<br />
60<br />
50<br />
40<br />
30<br />
20<br />
10<br />
0<br />
Percentage Share <strong>of</strong> Household Eopenditure on<br />
different Consumption Items, Zambia, 1998<br />
59<br />
5 7<br />
4 2<br />
Food Housing Transport Education Medical Care Personal<br />
Services<br />
Percentage Share Expenditure<br />
Source: CSO, 1998 Living Conditions Monitoring Survey<br />
9<br />
4<br />
Alcoholic<br />
Beverages &<br />
Tobacco<br />
Comparison <strong>of</strong> results from the same survey across<br />
the different strata in urban areas shows that<br />
households in the highest income brackets spent<br />
39 percent <strong>of</strong> their incomes on food, 8 percent on<br />
Education and 13 percent on personal services,<br />
while those households in the lowest income<br />
brackets spent 52 percent <strong>of</strong> their incomes on food,<br />
4 percent on Education and 9 percent on personal<br />
services.<br />
(Percentage)<br />
60<br />
50<br />
40<br />
30<br />
20<br />
10<br />
0<br />
<strong>Central</strong> <strong>Statistical</strong> <strong>Office</strong><br />
Percentage Share <strong>of</strong> Household Expenditure on<br />
different Consumption Items by Urban Strata, 1998<br />
52<br />
49<br />
39<br />
7<br />
9<br />
6<br />
8 10 11<br />
4<br />
6<br />
8<br />
2 2 2<br />
13<br />
9 9<br />
Food Housing Transport Education Medical Care Personal<br />
Services<br />
Urban Low Income Urban Medium Income Urban High Income<br />
Source: CSO, 1998 Living Conditions Monitoring Survey<br />
4 3 2<br />
Alcoholic<br />
Beverages &<br />
Tobacco<br />
A comparison <strong>of</strong> different households in three<br />
urban strata <strong>of</strong> Low, Medium and High income<br />
brackets shows that households in the high income<br />
brackets spent a larger proportion <strong>of</strong> their incomes<br />
on housing, education, transport and personal<br />
services; compared to households in medium and<br />
low income brackets.<br />
On the other hand, households in the Low income<br />
brackets spent a larger proportion <strong>of</strong> their incomes<br />
on food and alcoholic beverages and tobacco<br />
compared to households in the medium and high<br />
income brackets.<br />
2000 to 2025 Census<br />
Population Projections<br />
Zambia’s Total Population Doubles in 2025<br />
Population projections show that the current<br />
Zambia’s total population will have increased by<br />
slightly more than 100 percent in the year<br />
2025.According to the projection report, Zambia’s<br />
population as at mid-year 2000 is 9,791,981 and<br />
will increase to 20,347,348 in 2025. <strong>The</strong> 2025<br />
projected population is thus less by 1,188,937 than<br />
what would have been projected if there had been<br />
no HIV/AIDS on the population.<br />
Page 6
<strong>The</strong> <strong>Monthly</strong><br />
<strong>Central</strong> <strong>Statistical</strong> <strong>Office</strong><br />
Projected population<br />
Projected Population for Zambia,2000-2025<br />
25000000<br />
20000000<br />
15000000<br />
10000000<br />
5000000<br />
0<br />
2000 2005 2010 2015 2020 2025<br />
Population 9791981 11441461 13272553 15302680 17626252 20347348<br />
Projected Year<br />
Population<br />
2001. Also Lusaka and Copperbelt provinces will<br />
experience relatively low fertility rates from 4.6 in<br />
2000 to 2.8 in 2025 and from 5.2 in 2000 to 3.4 in<br />
2025 respectively. Besides, although Lusaka and<br />
Copperbelt provinces have higher life<br />
expectancies, the high rates <strong>of</strong> HIV/AIDS may<br />
strongly counteract population growth.<br />
<strong>The</strong> Layman and<br />
Statistics<br />
Source: CSO, 2000 Projection Report<br />
Luapula Province will experience the highest<br />
increase (132 percent) over the projection period,<br />
followed by Northwestern and <strong>Central</strong> provinces<br />
that will increase by 131 percent and 119 percent,<br />
respectively. <strong>The</strong>se provinces will have their<br />
populations doubled much earlier than 2025 due to<br />
their unique demographic chararcteristics. For<br />
Luapula province will continue experiencing<br />
relatively high fertility from 7.1 in 2000 to 6.9 by<br />
2025 compared to that <strong>of</strong> Lusaka Province which is<br />
from 4.6 in 2000 to 2.8 in 2025,while Northwestern<br />
and <strong>Central</strong> Provinces experience<br />
relatively high Life expectancies (54.5 in 2000 to<br />
60.1 by 2025 and 54.5 in 2000 to 61.2 by<br />
2025,respectively) in comparison to Northern and<br />
Western provinces whose Life expectancies range<br />
from 45.2 to 47.3 in 2000 to 49.3 to 54.9 by 2025.<br />
<strong>The</strong> table below shows provincial 2000 and 2025<br />
projected populations and their respective percent<br />
increase over the projection period.<br />
Province<br />
2000 and 2025 Provincial projected population<br />
year<br />
2000 2025<br />
Percent<br />
Increase<br />
by 2025<br />
<strong>Central</strong> 1,001,020 2,196,588 119<br />
Copperbelt 1,563,670 2,914,227 86<br />
Eastern 1,306,173 2,732,649 109<br />
Luapula 766,746 1,780,635 132<br />
Lusaka 1,375,890 2,243,351 63<br />
Northern 1,244,726 2,435,309 96<br />
North-western 576,874 1,332,364 131<br />
Southern 1,198,670 2,518,396 110<br />
Western 756,596 1,489,495 97<br />
Source: CSO, 2000 Projection Report<br />
Lusaka and Copperbelt provinces will however not<br />
be expected to have doubled their populations by<br />
2025 as observed in the table above. <strong>The</strong><br />
HIV/AIDS prevalence rates for these provinces are<br />
relatively higher at 22.0 percent for Lusaka<br />
province and 19.9 percent for Copperbelt province<br />
in 2001 compared to other provinces whose<br />
prevalence rates range from 8.3 to 17.6 percent in<br />
This month we look at two phrases that help<br />
explain how we treat the personal information that<br />
is collected by interviewers during surveys and<br />
Censuses.<br />
Anonymity- In a survey, anonymity exists if the<br />
identity <strong>of</strong> a respondent who gives information is<br />
not known to anyone other than the interviewer<br />
and inference cannot be made as to whom the<br />
information belongs. This means that no code<br />
numbers or personal identifiers are put on the<br />
information so as to allow someone to know whom<br />
the information relates to.<br />
Example: During the 2001/2 Zambia Demographic<br />
and Health survey, blood samples were collected<br />
from individual respondents aged 15-59 for syphilis<br />
testing in the field, and for onward HIV testing in<br />
the laboratory. <strong>The</strong> HIV samples were not marked<br />
with any personal identifiers and the respective<br />
HIV result could not be traced to the respondent.<br />
<strong>The</strong> strict law <strong>of</strong> Anonymity was maintained.<br />
Confidentiality- Is when the privacy <strong>of</strong> personal<br />
information provided by individual respondents is<br />
maintained and the information provided cannot<br />
be derived from the published survey results or<br />
reports.<br />
Example: during surveys like the Zambia Sexual<br />
Behaviour survey, the interviewers obtain a lot <strong>of</strong><br />
personal information about the respondent’s sexual<br />
history. However, once the report is produced, it is<br />
not possible to link the survey results to any<br />
individual or group <strong>of</strong> individuals because no<br />
names are used in the analysis <strong>of</strong> the collected<br />
information.<br />
Page 7
<strong>The</strong> <strong>Monthly</strong><br />
Coming Soon…<br />
2003 Sexual Behaviour Survey<br />
to be disseminated on<br />
Wednesday 31 st <strong>March</strong> <strong>2004</strong><br />
<strong>Central</strong> <strong>Statistical</strong> <strong>Office</strong><br />
Up-Coming Surveys…<br />
Agricultural Crop Forecast<br />
Survey…<br />
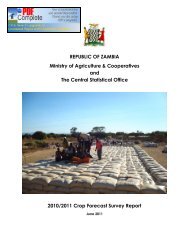
<strong>The</strong> <strong>Central</strong> <strong>Statistical</strong> <strong>Office</strong> in collaboration<br />
with the Ministry <strong>of</strong> Agriculture and<br />
Cooperatives will be conducting the 2003/4<br />
Crop Forecasting Survey in April <strong>2004</strong>.<br />
<strong>The</strong> main objective <strong>of</strong> the survey is to obtain<br />
information from farmers on the anticipated<br />
estimates <strong>of</strong> area under major crops, total<br />
production expected, and crop sales information<br />
during the season. This information is important<br />
in assessing the expected food security<br />
situation in the country and also in the<br />
computation <strong>of</strong> the National Food Balance<br />
Sheet, used to determine whether the country<br />
has a surplus or deficit in major cereals and<br />
tubers.<br />
<strong>The</strong> final Report on the 2003 Zambia Sexual<br />
Behaviour Survey will be disseminated on<br />
Wednesday, 31 st <strong>March</strong> <strong>2004</strong> at the Taj<br />
Pamodzi Hotel.<br />
<strong>The</strong> Dissemination Seminar will include<br />
presentation on the Summary <strong>of</strong> Findings,<br />
Knowledge, Attitudes and Practices, Sexual<br />
Behaviour, Sexually Transmitted Infections,<br />
Adolescents, Forsterhood, Orphanhood, and<br />
support to vulnerable households.<br />
<strong>The</strong> Survey was conducted by the <strong>Central</strong><br />
<strong>Statistical</strong> <strong>Office</strong> in collaboration with the<br />
Ministry <strong>of</strong> Health and the National AIDS<br />
Council; with financial support from the USAID<br />
Mission in Zambia and technical assistance from<br />
the Measure Evaluation Project <strong>of</strong> the<br />
University <strong>of</strong> North Carolina in the USA.<br />
2003 Living Conditions in Zambia<br />
Results from the 2003 Living Conditions<br />
Monitoring Survey will be released in April<br />
<strong>2004</strong>. Highlights from the survey will include<br />
current poverty levels, seasonal variation in<br />
poverty levels and coping strategies, household<br />
income and expenditure patterns, economic<br />
activity <strong>of</strong> the population, child health and<br />
nutritional status, household deaths and orphanhood<br />
and many more interesting information.<br />
This information is important to the<br />
Government, NGOs, private sector and donors<br />
for strategic planning and decision- making.<br />
Subscribe for your free electronic copy <strong>of</strong><br />
“<strong>The</strong> <strong>Monthly</strong>” online at<br />
www.zamstats.gov.zm<br />
Editorial Team<br />
1. Dr. Buleti G. Nsemukila - Director<br />
2. Modesto F. C. Banda - Deputy Director<br />
3. Stanley Kamocha-Senior Statistician<br />
4. Richard Banda-Demographer<br />
5. Chibwe Lwamba - Demographer<br />
6. Joseph Tembo - Statistician<br />
7. Jonathan Mukundu Statistician<br />
8. Linda Chonya – Statistician<br />
9. Musale H. Banda - Operations <strong>Office</strong>r<br />
10. Anthony Nkole - Desktop Publishing <strong>Office</strong>r<br />
11. Perry Musenge – Desktop Publishing <strong>Office</strong>r<br />
<strong>12</strong>. Maambo Simaata - Press Liaison <strong>Office</strong>r<br />
Thank you for supporting us<br />
<strong>The</strong> Editorial team would like to thank all<br />
media institutions and users <strong>of</strong> “<strong>The</strong><br />
<strong>Monthly</strong>” Statistics Bulletin for their support<br />
in 2003.<br />
We hope your support continues in <strong>2004</strong>.<br />
Page 8
<strong>The</strong> <strong>Monthly</strong><br />
<strong>Central</strong> <strong>Statistical</strong> <strong>Office</strong><br />
Page 9
<strong>The</strong> <strong>Monthly</strong><br />
<strong>Central</strong> <strong>Statistical</strong> <strong>Office</strong><br />
Special Note <strong>of</strong> Thanks<br />
<strong>The</strong> Management <strong>of</strong> CSO and the Editorial Team would like to<br />
pay sincere gratitude to Lusaka Stock Exchange for their moral<br />
and financial support towards the production <strong>of</strong> the CSO<br />
<strong>Statistical</strong> bulletin- “<strong>The</strong> <strong>Monthly</strong>”. We appreciate the<br />
partnership that has been initiated.<br />
Wishing you continued growth in <strong>2004</strong>!<br />
“Promoting and creating an investment culture in Zambia”<br />
Make the decision to own shares in a company your priority this year.<br />
Visit the Lusaka Stock Exchange Today!<br />
Page 10