Vol 41 2006 The Monthly August.pdf - Central Statistical Office of ...
Vol 41 2006 The Monthly August.pdf - Central Statistical Office of ...
Vol 41 2006 The Monthly August.pdf - Central Statistical Office of ...

You also want an ePaper? Increase the reach of your titles
YUMPU automatically turns print PDFs into web optimized ePapers that Google loves.
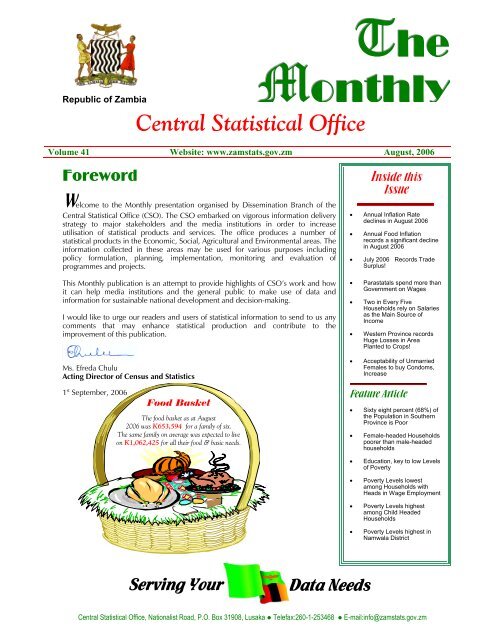
<strong>The</strong><br />
Republic <strong>of</strong> Zambia<br />
<strong>Vol</strong>ume <strong>41</strong> Website: www.zamstats.gov.zm <strong>August</strong>, <strong>2006</strong><br />
Foreword<br />
Welcome to the <strong>Monthly</strong> presentation organised by Dissemination Branch <strong>of</strong> the<br />
<strong>Central</strong> <strong>Statistical</strong> <strong>Office</strong> (CSO). <strong>The</strong> CSO embarked on vigorous information delivery<br />
strategy to major stakeholders and the media institutions in order to increase<br />
utilisation <strong>of</strong> statistical products and services. <strong>The</strong> <strong>of</strong>fice produces a number <strong>of</strong><br />
statistical products in the Economic, Social, Agricultural and Environmental areas. <strong>The</strong><br />
information collected in these areas may be used for various purposes including<br />
policy formulation, planning, implementation, monitoring and evaluation <strong>of</strong><br />
programmes and projects.<br />
<strong>Monthly</strong><br />
<strong>Central</strong> <strong>Statistical</strong> <strong>Office</strong><br />
Inside this<br />
Issue<br />
• Annual Inflation Rate<br />
declines in <strong>August</strong> <strong>2006</strong><br />
• Annual Food Inflation<br />
records a significant decline<br />
in <strong>August</strong> <strong>2006</strong><br />
• July <strong>2006</strong> Records Trade<br />
Surplus!<br />
This <strong>Monthly</strong> publication is an attempt to provide highlights <strong>of</strong> CSO’s work and how<br />
it can help media institutions and the general public to make use <strong>of</strong> data and<br />
information for sustainable national development and decision-making.<br />
I would like to urge our readers and users <strong>of</strong> statistical information to send to us any<br />
comments that may enhance statistical production and contribute to the<br />
improvement <strong>of</strong> this publication.<br />
Ms. Efreda Chulu<br />
Acting Director <strong>of</strong> Census and Statistics<br />
1 st September, <strong>2006</strong><br />
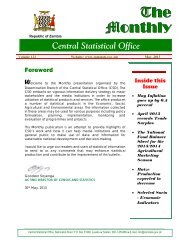
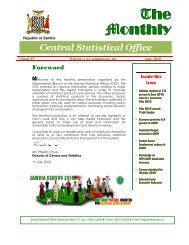
Food Basket<br />
<strong>The</strong> food basket as at <strong>August</strong><br />
<strong>2006</strong> was K653,594 for a family <strong>of</strong> six.<br />
<strong>The</strong> same family on average was expected to live<br />
on K1,062,425 for all their food & basic needs.<br />
• Parastatals spend more than<br />
Government on Wages<br />
• Two in Every Five<br />
Households rely on Salaries<br />
as the Main Source <strong>of</strong><br />
Income<br />
• Western Province records<br />
Huge Losses in Area<br />
Planted to Crops!<br />
• Acceptability <strong>of</strong> Unmarried<br />
Females to buy Condoms,<br />
Increase<br />
Feature Article<br />
• Sixty eight percent (68%) <strong>of</strong><br />
the Population in Southern<br />
Province is Poor<br />
• Female-headed Households<br />
poorer than male-headed<br />
households<br />
• Education, key to low Levels<br />
<strong>of</strong> Poverty<br />
• Poverty Levels lowest<br />
among Households with<br />
Heads in Wage Employment<br />
• Poverty Levels highest<br />
among Child Headed<br />
Households<br />
• Poverty Levels highest in<br />
Namwala District<br />
Serving Your<br />
Data Needs<br />
<strong>Central</strong> <strong>Statistical</strong> <strong>Office</strong>, Nationalist Road, P.O. Box 31908, Lusaka ● Telefax:260-1-253468 ● E-mail:info@zamstats.gov.zm
<strong>The</strong> <strong>Monthly</strong> – <strong>Vol</strong>ume <strong>41</strong><br />
Inflation<br />
<strong>Central</strong> <strong>Statistical</strong> <strong>Office</strong><br />
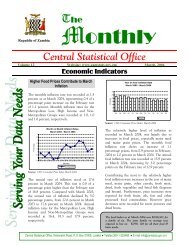
Annual Inflation Rate declines in <strong>August</strong> <strong>2006</strong><br />
<strong>The</strong> annual rate <strong>of</strong> inflation, as measured by the all<br />
items Consumer Price Index (CPI), was recorded at<br />
8.0 percent as at <strong>August</strong> <strong>2006</strong>. This rate is 0.7 <strong>of</strong> a<br />
percentage point lower than the July rate <strong>of</strong> 8.7<br />
percent. Compared with the same period last year,<br />
the annual rate <strong>of</strong> inflation declined by 11.3<br />
percentage points, from 19.3 percent in <strong>August</strong><br />
2005 to 8.0 percent in <strong>August</strong> <strong>2006</strong>.<br />
<strong>The</strong> <strong>August</strong> <strong>2006</strong> inflation rate <strong>of</strong> 8.0 percent means<br />
that prices as measured by the all items Consumer<br />
Price Index (CPI) increased by an average <strong>of</strong> 8.0<br />
percent between <strong>August</strong> 2005 and <strong>August</strong> <strong>2006</strong>.<br />
(Percentage)<br />
25<br />
20<br />
15<br />
10<br />
5<br />
0<br />
Twelve Month Inflation Rate<br />
<strong>August</strong> 2005 - <strong>August</strong> <strong>2006</strong><br />
Aug Sept Oct Nov Dec Jan Feb Mar Apr May Jun Jul Aug<br />
Composite<br />
Source: CSO, Consumer Price Index, <strong>August</strong>, <strong>2006</strong><br />
Annual Inflation Rates for CPI<br />
Main Groups<br />
Between July <strong>2006</strong> and <strong>August</strong> <strong>2006</strong>, the annual<br />
inflation rates increased for rent and household<br />
energy (from 12.2 percent to 15.2 percent),<br />
furniture and household goods (from 16.3 percent to<br />
19.4 percent), medical care (from 17.4 percent to<br />
19.2 percent), transport and communication (from –<br />
1.5 percent to 5.6 percent) main groups. <strong>The</strong> food,<br />
beverages and tobacco main group recorded a<br />
decline in the annual inflation rate (from 4.3 percent<br />
to 0.4 percent).<br />
Annual Inflation Rate: CPI Main Groups<br />
All<br />
Items<br />
Food<br />
Beverages<br />
And<br />
Tobacco<br />
Clothing<br />
And<br />
Footwear<br />
Rent<br />
and<br />
Household<br />
Energy<br />
Furniture<br />
and Medical<br />
Household care<br />
Goods<br />
Transport<br />
and<br />
Comms<br />
Per cent<br />
Recreation<br />
and<br />
Education<br />
Other<br />
Goods<br />
And<br />
Services<br />
Jan 05 – Jan 04 18.2 17.9 17.3 18.6 21.7 12.2 20.6 13.9 19.6<br />
Feb 05 – Feb 04 18.7 18.3 14.5 22.7 22.1 13.1 21.6 12.7 19.4<br />
Mar 05 – Mar 04 17.4 16.0 14.1 22.1 22.0 13.2 22.5 12.7 18.5<br />
April 05 - April 04 18.6 18.0 12.9 25.0 22.4 13.0 21.6 11.9 19.2<br />
May 05 - May 04 19.1 19.1 13.0 25.0 19.4 12.9 23.1 13.7 18.0<br />
Jun 05 – Jun 04 19.2 19.3 13.6 27.3 20.0 13.4 19.7 13.6 17.9<br />
Jul 05 - Jul 04 18.7 18.7 13.2 27.9 21.0 14.2 15.9 13.4 17.9<br />
Aug 05 – Aug 04 19.3 20.4 14.2 28.8 18.8 15.9 13.4 13.5 17.7<br />
Sep 05 – Sep 04 19.5 20.7 13.9 28.4 21.0 15.1 13.1 12.9 16.3<br />
Oct 05 - Oct 04 18.3 18.8 15.1 29.9 20.1 15.3 8.7 13.5 17.0<br />
Nov 05 – Nov 04 17.2 18.3 14.4 28.9 18.0 14.5 4.9 13.5 15.2<br />
Dec 05 – Dec 04 15.9 17.5 14.9 26.5 18.0 10.5 -3.5 13.4 14.9<br />
Jan 06 - Jan 05 12.2 12.8 15.6 20.4 18.2 10.2 -8.6 12.2 11.7<br />
Feb 06 – Feb 05 10.3 10.2 21.7 15.5 13.7 10.5 -9.9 12.7 11.6<br />
Mar 06 – Mar 05 10.7 10.9 23.0 17.2 12.4 11.5 -10.6 11.8 11.0<br />
April 06 - April 05 9.4 8.3 25.9 14.7 12.9 15.0 -10.9 11.7 13.9<br />
May 06 – May 05 8.6 5.6 29.2 14.1 14.7 16.9 -9.5 14.2 13.9<br />
Jun 06 – June 05 8.4 5.4 27.9 10.6 16.5 17.5 -6.5 12.0 13.7<br />
Jul 06 - July 05 8.7 4.3 29.2 12.2 16.3 17.4 -1.5 15.1 12.7<br />
Aug 06 – Aug 05 8.0 0.4 29.4 15.2 19.4 19.2 5.6 15.0 12.7<br />
Source: CSO, Consumer Price Index, <strong>August</strong> <strong>2006</strong><br />
Contributions <strong>of</strong> different Items<br />
to overall inflation<br />
<strong>The</strong> decline <strong>of</strong> 0.7 <strong>of</strong> a percentage point in inflation<br />
from 8.7 percent in July <strong>2006</strong> to 8.0 percent in<br />
<strong>August</strong> <strong>2006</strong> is due to the decline in the inflation<br />
rate for food, beverages and tobacco.<br />
Of the total 8.0 percent annual inflation in <strong>August</strong><br />
<strong>2006</strong>, food products accounted for 0.2 <strong>of</strong> a<br />
percentage point while non-food products in the<br />
Consumer Price Index (CPI) accounted for 7.8<br />
percentage points. This means that 97 percent <strong>of</strong><br />
inflation in <strong>August</strong> <strong>2006</strong> was due to the increase in<br />
the cost <strong>of</strong> non-food items.<br />
Percentage Points Contributions <strong>of</strong> Different Items to Overall Inflation<br />
Items<br />
Sep Oct Nov Dec Jan Feb Mar Apr May Jun Jul Aug<br />
05 05 05 05 06 06 06 06 06 06 06 06<br />
Food Beverages<br />
10.8<br />
and Tobacco<br />
9.9 9.6 9.3 6.8 5.4 5.8 4.4 2.9 2.9 2.2 0.2<br />
Clothing and<br />
Footwear<br />
1.1 1.2 1.1 1.1 1.2 1.5 1.7 1.9 2.2 2.1 2.2 2.2<br />
Rent and<br />
household 2.8 2.9 2.8 2.6 1.9 1.6 1.7 1.5 1.5 1.1 1.3 1.6<br />
energy<br />
Furniture and<br />
Household 2.0 2.0 1.8 1.8 1.8 1.3 1.2 1.3 1.4 1.6 1.6 1.9<br />
Goods<br />
Medical Care 0.1 0.1 0.1 0.1 0.1 0.1 0.1 0.1 0.1 0.1 0.1 0.2<br />
Transport (fuel,<br />
airfares, new 1.3 0.8 0.4 -0.3 -0.8 -0.9 -0.9 -1.0 -0.9 -0.6 -0.1 0.5<br />
motor vehicles)<br />
Recreation and<br />
Education<br />
0.9 0.9 0.9 0.9 0.8 0.8 0.8 0.8 0.9 0.8 1.0 1.0<br />
Other Goods and<br />
0.5<br />
Services<br />
0.5 0.5 0.4 0.4 0.4 0.3 0.4 0.4 0.4 0.4 0.4<br />
All Items 19.5 18.3 17.2 15.9 12.2 10.3 10.7 9.4 8.6 8.5 8.7 8.0<br />
Source: CSO, Consumer Price Index, <strong>August</strong> <strong>2006</strong><br />
2
<strong>The</strong> <strong>Monthly</strong> – <strong>Vol</strong>ume <strong>41</strong><br />
Annual Food Inflation records a<br />
significant decline in <strong>August</strong><br />
<strong>2006</strong><br />
<strong>The</strong> annual food inflation rate was recorded at 0.4<br />
percent in <strong>August</strong> <strong>2006</strong>, declining by 3.9 percentage<br />
points on the July rate <strong>of</strong> 4.3 percent. Contributing<br />
most to the decline in food inflation were decreases<br />
in the cost <strong>of</strong> maize grain, maize meal, fresh<br />
vegetables, fish, kapenta, dressed chicken, irish<br />
potatoes and shelled groundnuts.<br />
<strong>The</strong> annual non-food inflation rate stood at 16.4<br />
percent in <strong>August</strong> <strong>2006</strong>, compared with 13.6<br />
percent in July <strong>2006</strong>. This rise was mainly due to<br />
increases in the cost <strong>of</strong> house rent and household<br />
energy, furniture and household appliances, airfares<br />
and new motor vehicles.<br />
Annual Inflation Rates: Food and Non food Items<br />
Period Total Food Non-Food<br />
Jan 05 - Jan 04 18.2 17.9 18.7<br />
Feb 05 - Feb 04 18.7 18.3 19.1<br />
Mar 05 - Mar 04 17.4 16.0 19.0<br />
April 05 – April 04 18.6 18.0 19.3<br />
May 05 - May 04 19.1 19.1 19.2<br />
Jun 05 - Jun 04 19.2 19.3 19.2<br />
Jul 05 - Jul 04 18.7 18.7 18.7<br />
Aug 05 - Aug 04 19.3 20.4 18.2<br />
Sep 05 - Sep 04 19.5 20.7 18.2<br />
Oct 05 - Oct 04 18.3 18.8 17.8<br />
Nov 05 - Nov 04 17.2 18.3 16.1<br />
Dec 05- Dec 04 15.9 17.5 14.0<br />
Jan 06 - Jan 05 12.2 12.8 11.5<br />
Feb 06 - Feb 05 10.3 10.2 10.3<br />
Mar 06 - Mar 05 10.7 10.9 10.4<br />
April 06 – April 05 9.4 8.3 10.6<br />
May 06 - May 05 8.6 5.6 12.0<br />
Jun 06 - Jun 05 8.5 5.4 11.8<br />
Jul 06 - Jul 05 8.7 4.3 13.6<br />
Aug 06 - Aug 05 8.0 0.4 16,4<br />
Source: CSO, Consumer Price Index, <strong>August</strong> <strong>2006</strong><br />
Maize Grain and Maize Meal<br />
Prices continue to decline<br />
A comparison <strong>of</strong> prices between July <strong>2006</strong> and<br />
<strong>August</strong> <strong>2006</strong>, shows that the national average price<br />
<strong>of</strong> a 25 kg bag <strong>of</strong> roller meal declined by 3.2<br />
percent, from K25,406 to K24,599. <strong>The</strong> national<br />
average price <strong>of</strong> a 20 litre tin <strong>of</strong> maize grain declined<br />
by 0.4 percent, from K11,193 to K11,148. <strong>The</strong><br />
national average price <strong>of</strong> 1kg <strong>of</strong> tomatoes declined<br />
by 21.2 percent, while the national average price <strong>of</strong><br />
1kg <strong>of</strong> dried Kapenta (Mplungu) declined by 6.4<br />
percent. <strong>The</strong> high weight <strong>of</strong> maize grain, maize<br />
meal, fish/kapenta and fresh vegetables in the CPI<br />
means that any changes in the prices <strong>of</strong> these<br />
products have a strong bearing on the movement <strong>of</strong><br />
the CPI.<br />
<strong>Central</strong> <strong>Statistical</strong> <strong>Office</strong><br />
National Average prices for selected Products and<br />
Months<br />
Product Description<br />
White breakfast maize<br />
meal 25Kg<br />
White roller maize<br />
meal 25Kg<br />
<strong>2006</strong><br />
Percentage<br />
Changes<br />
January February March April May June July <strong>August</strong> Aug-06/Jul-06<br />
43,829 43,325 43,313 43,470 42,469 38,620 37,165 36,440 -2.0<br />
36,477 36,600 36,491 36,724 34,370 27,9<strong>41</strong> 25,406 24,599 -3.2<br />
White Maize 20 litre tin 21,106 23,184 22,433 17,950 12,906 11,619 11,193 11,148 -0.4<br />
Hammer Milling charge<br />
20 litre tin<br />
1,933 1,862 1,879 1,984 1,963 1,893 1,964 1,938 -1.3<br />
Rice Local 1 K g 3,788 3,915 4,130 4,385 3,993 3,954 3,874 3,616 -6.7<br />
Millet 5 litre tin 6,427 6,493 7,234 6,695 8,899 8,901 8,324 7,592 -8.8<br />
Sorghum 5 litre tin 5,070 4,498 6,455 8,912 11,793 8,469 5,368 5,143 -4.2<br />
Mixed Cut 1 Kg 12,714 12,865 13,451 13,439 13,331 13,215 13,031 12,990 -0.3<br />
Dressed chicken 1 Kg 13,519 13,542 13,723 13,576 12,615 12,451 12,440 11,696 -6.0<br />
Bream Fresh/Frozen 1 Kg 12,063 12,014 11,<strong>41</strong>1 12,082 12,696 12,071 12,257 11,690 -4.6<br />
Buka Buka 1 Kg 10,078 10,038 10,053 9,923 10,655 10,735 10,969 10,890 -0.7<br />
Dried Kapenta Mpulungu 1 Kg 31,966 31,422 32,824 31,246 31,838 32,054 35,373 33,098 -6.4<br />
Dried Kapenta Siavonga 1 Kg 31,868 29,832 31,159 32,273 30,732 28,724 28,660 28,597 -0.2<br />
Fresh milk (Pasteurised)<br />
Local 500 ml<br />
2,051 2,080 2,398 2,<strong>41</strong>4 2,300 2,275 2,151 2,007 -6.7<br />
Margarine Buttercup 250gm 5,058 5,044 4,804 4,682 4,957 4,957 4,903 4,889 -0.3<br />
Cooking oil Imported<br />
Any 750 ml<br />
6,180 5,986 6,018 5,815 5,611 5,326 5,237 5,029 -4.0<br />
Cabbage 1kg 1,371 1,339 1,449 1,423 1,257 1,192 1,002 983 -1.9<br />
Onion 1kg 4,134 4,256 4,575 5,574 5,287 5,295 5,122 4,292 -16.2<br />
Tomatoes 1kg 2,712 2,372 2,423 2,359 2,783 3,209 2,803 2,210 -21.2<br />
Rape 1kg 2,114 1,903 1,799 2,027 1,794 1,689 1,599 1,520 -4.9<br />
Shelled groundnut 1kg 6,524 6,388 6,886 6,537 5,949 5,929 5,685 5,656 -0.5<br />
Oranges 1kg 4,909 4,625 4,369 3,960 3,646 3,425 3,273 3,080 -5.9<br />
Irish potatoes 1kg 3,348 3,059 2,735 2,552 2,465 2,361 2,601 2,522 -3.0<br />
Paraffin 1 litre 3,875 3,790 3,769 3,772 3,743 3,939 3,977 4,116 3.5<br />
Petrol Premium 1 litre 5,433 5,136 5,097 5,122 5,322 5,775 6,003 6,152 2.5<br />
Diesel 1 litre 5,091 4,819 4,746 4,583 4,739 4,991 4,983 5,094 2.2<br />
Air Fare Lusaka/Ndola Zambian<br />
Airways 1 way<br />
Bed & continental Breakfast 3<br />
to 5 star Hotel<br />
442,000 447,850 442,000 442,000 326,000 355,000 462,800 575,100 24.3<br />
458,446 478,461 487,608 583,336 546,480 61,1177 62,7405 745,131 18.8<br />
Takeaway chicken & chips 11,644 11,130 12,130 11,939 11,855 12,185 12,516 12,271 -2.0<br />
Source: CSO, Consumer Price Index, <strong>August</strong> <strong>2006</strong><br />
Consumer Price Index<br />
(CPI) - Explanatory Notes<br />
1. What is Inflation<br />
Inflation is (a general rise) the continuous and<br />
persistent increase in prices <strong>of</strong> goods and services on<br />
which individuals or households spend their money.<br />
2. How is Inflation measured<br />
<strong>The</strong> Consumer Price Index (CPI) is used to measure<br />
and monitor inflation. <strong>The</strong> Consumer Price Index<br />
(CPI) is an index that measures the rate at which<br />
prices <strong>of</strong> consumption goods and services are<br />
changing from month to month (or from quarter to<br />
quarter).<br />
3. Annual Inflation Rate<br />
<strong>The</strong> annual inflation rate is calculated as the change<br />
in the Consumer Price Index (CPI) <strong>of</strong> the relevant<br />
month <strong>of</strong> the current year compared with the<br />
Consumer Price Index (CPI) <strong>of</strong> the same month in<br />
the previous year expressed as a percentage.<br />
3
<strong>The</strong> <strong>Monthly</strong> – <strong>Vol</strong>ume <strong>41</strong><br />
4. Average annual inflation rate<br />
<strong>The</strong> average annual inflation rate is the change in<br />
the CPI <strong>of</strong> one year compared with the average CPI<br />
<strong>of</strong> the previous year expressed as a percentage.<br />
5. <strong>Monthly</strong> Inflation Rate<br />
<strong>The</strong> monthly inflation rate is calculated as the<br />
change in the Consumer Price Index (CPI) <strong>of</strong> the<br />
relevant month compared with the Consumer Price<br />
Index (CPI) <strong>of</strong> the previous month expressed as a<br />
percentage.<br />
6. Prices Collection<br />
<strong>The</strong> Consumer Price Index (CPI) is compiled using<br />
retail prices <strong>of</strong> goods and services that are collected<br />
every month from shops or other retail outlets<br />
throughout Zambia. Enumerators (<strong>41</strong>) are based in<br />
all the 9 provinces and these are responsible for the<br />
collection <strong>of</strong> prices. From 1 st to about 15 th <strong>of</strong> each<br />
month, Enumerators visit selected outlets collecting<br />
prices for CPI basket. This information is then<br />
submitted to the head <strong>of</strong>fice for data processing and<br />
analysis.<br />
7. Consumer Price Index (CPI)<br />
Coverage<br />
<strong>The</strong> CPI covers the whole country - both rural and<br />
urban areas.<br />
• 9 provinces<br />
• <strong>41</strong> districts are covered<br />
• 1785 shops and retail outlets covered<br />
• An average <strong>of</strong> 15,000 prices are collected<br />
and processed each month<br />
8. Consumer Price Index (CPI)<br />
Basket<br />
While the Consumer Price Index is designed to<br />
reflect price changes over the whole range <strong>of</strong> goods<br />
and services on which households spend their<br />
money, it is practically impossible to collect prices<br />
month by month for each and every one <strong>of</strong> these<br />
goods and services. <strong>The</strong>refore, a sample <strong>of</strong> goods<br />
and services is selected to represent the price<br />
movements <strong>of</strong> all goods and services. Prices for 357<br />
items are collected every month.<br />
9. Consumer Price Index (CPI)<br />
Weights<br />
<strong>The</strong> CPI is a fixed weights index, which implies that<br />
the weight <strong>of</strong> each product/group stays the same<br />
until the income and expenditure survey is<br />
<strong>Central</strong> <strong>Statistical</strong> <strong>Office</strong><br />
conducted. <strong>The</strong> current weights are based on the<br />
results <strong>of</strong> the 1993/94 Household Budget Survey.<br />
<strong>The</strong> results from the 2002/3 Living Conditions<br />
Monitoring Survey (LCMS) will be used to update<br />
the weights for the New CPI.<br />
As some items are more important than others in the<br />
sense that more money is spent on them by the<br />
consumers, each item is given a ‘weight’ to represent<br />
its relative importance in the household s total<br />
expenditure budget. <strong>The</strong>se weights are used in the<br />
computation <strong>of</strong> the CPI.<br />
Consumer Price Index – Main Group Weights<br />
Main Group<br />
Weight<br />
Food , Beverages and tobacco 571<br />
Clothing and Foot wear 68<br />
Rent and Household Energy 85<br />
Furniture and household Goods 82<br />
Medical Care 8<br />
Transport and Communication 96<br />
Recreation and Education 49<br />
Other Goods and Services <strong>41</strong><br />
Total 1,000<br />
Consumer Price Index:<br />
Methodology<br />
<strong>The</strong> individual product level indices are evaluated in<br />
three stages. Stage 1 begins at the district level. Stage<br />
2 calculates province level index numbers. Stage 3<br />
calculates national level index numbers<br />
<strong>The</strong> following formula is used to calculate product<br />
indices :<br />
⎛ p<br />
⎜<br />
⎝<br />
n i , j<br />
t<br />
0:<br />
t 1<br />
i,<br />
j<br />
I<br />
i<br />
= ∑ 0<br />
ni,<br />
j j=<br />
1 pi,<br />
j<br />
where<br />
t<br />
I 0:<br />
i is an index for product i showing the average<br />
change between period 0 and t. It is calculated as<br />
arithmetic average <strong>of</strong> price relatives for all outlets<br />
which provided prices in both months.<br />
n<br />
i , j is the number <strong>of</strong> outlets providing price data<br />
for product i in period 0 and t.<br />
t<br />
p<br />
i , j is the price <strong>of</strong> product i in outlet j in a month<br />
t.<br />
0<br />
p<br />
i, j is the price <strong>of</strong> product i in outlet j in a month<br />
0.<br />
0 is the base period<br />
t is the current period<br />
⎞<br />
⎟<br />
⎠<br />
4
<strong>The</strong> <strong>Monthly</strong> – <strong>Vol</strong>ume <strong>41</strong><br />
<strong>Central</strong> <strong>Statistical</strong> <strong>Office</strong><br />
International Merchandize Trade<br />
July <strong>2006</strong> Records Trade Surplus!<br />
During the month <strong>of</strong> July <strong>2006</strong>, Zambia recorded a<br />
Trade Surplus valued at K146.1 billion. This means<br />
that the country exported more in July than it<br />
imported in value terms. Trade surpluses were also<br />
recorded in the months <strong>of</strong> April and May <strong>2006</strong>.<br />
However, it should be noted that the figures in the<br />
table below are preliminary and subject to revision<br />
up on receipt <strong>of</strong> additional data from customs and<br />
non-customs sources.<br />
Total Exports, Imports & Trade Balance, January<br />
<strong>2006</strong> to July <strong>2006</strong>*, (K’ Millions)*<br />
Months<br />
Imports<br />
(cif)<br />
Domestic<br />
Exports (fob)<br />
Re-Exports<br />
(fob)<br />
Total Exports<br />
(fob)<br />
Trade<br />
Balance<br />
January 660,161 590,658 3,143 593,801 (66,360)<br />
February 611,698 597,576 1,885 599,461 (12,237)<br />
March 771,004 725,025 973 725,997 (45,007)<br />
April 681,743 689,703 9,684 699,387 17,644<br />
May 751,262 865,595 1,646 867,242 115,979<br />
June 932,6<strong>41</strong> 871,713 1,733 873,446 (59,195)<br />
July 668,301 812,734 1,647 814,381 146,080<br />
TOTAL: 5,076,811 5,153,004 20,712 5,173,716 96,904<br />
Source: CSO, International Trade Statistics, <strong>2006</strong>, Note: (*) Preliminary<br />
Exports by SITC<br />
<strong>The</strong> table below shows the total value <strong>of</strong> exports in<br />
June and July <strong>2006</strong> classified by the standard<br />
International Trade classification (SITC).<br />
<strong>The</strong> total value <strong>of</strong> exports in June <strong>2006</strong> was K873.4<br />
billion compared to K814.4 billion in July <strong>2006</strong>. <strong>The</strong><br />
most prominent exports were manufactured goods<br />
classified chiefly by material accounting for 76.8<br />
percent in June <strong>2006</strong> and 78.4 percent in July <strong>2006</strong><br />
<strong>of</strong> which; refined copper was the most significant.<br />
Other important exports were crude materials<br />
(excluding fuels) such as copper ores and<br />
concentrates, cobalt ores and concentrates, sulphur,<br />
cotton and salt, which accounted for 12.3 and 10.6<br />
percent in June and July <strong>2006</strong> respectively.<br />
Total Exports by (SITC) sections, June and July<br />
<strong>2006</strong>*, K’ Millions<br />
CODE DESCRIPTION<br />
June <strong>2006</strong> July <strong>2006</strong><br />
Value (ZMK) % Share Value (ZMK) % Share<br />
0 Food and live animals 36,344 4.2 33,629 4.1<br />
1 Beverages and tobacco 26,103 3 28,330 3.5<br />
2 Crude materials, (excl fuels) 107,668 12.3 86,609 10.6<br />
Mineral fuels, lubricants and related<br />
3<br />
materials 6,521 0.7 6,408 0.8<br />
4 Animal and vegetable oils, fats and waxes 320 0 144 0<br />
5 Chemicals 6,934 0.8 5,628 0.7<br />
Manufactured goods classified chiefly by<br />
6<br />
material 671,164 76.8 638,503 78.4<br />
Of Which:<br />
Refined copper 437,197 65.1 422,704 66.2<br />
Plates, sheets and strip, <strong>of</strong> refined<br />
copper, >0.15mm thick 123,797 18.4 113,462 17.8<br />
Wire <strong>of</strong> refined copper 47,746 7.1 46,346 7.3<br />
Cobalt, wrought, and articles <strong>of</strong> cobalt <strong>41</strong>,352 6.2 30,085 4.7<br />
Other 21,072 3.1 25,906 4.1<br />
7 Machinery and transport equipment 16,420 1.9 13,244 1.6<br />
8 Miscellaneous manufactured articles 1,880 0.2 1,751 0.2<br />
Commodities and transactions<br />
9<br />
not classified elsewhere in the SITC 85 0 136 0<br />
Total: 873,438 100 814,381 100<br />
Source: CSO, International Trade Statistics, <strong>2006</strong>; Note: (*) Provisional<br />
Zambia’s Major Exports by HS<br />
<strong>The</strong> table below shows Zambia’s major export<br />
products classified by the Harmonized coding<br />
System (HS) in July <strong>2006</strong>.<br />
According to the HS coding system, Zambia’s major<br />
export product in July <strong>2006</strong> was copper and articles<br />
there<strong>of</strong> accounting for 72.2 percent <strong>of</strong> Zambia’s<br />
total export earnings. Other export products worth<br />
noting, though on a smaller scale were ores, slags<br />
and ash (8.8 percent), other base metals - such as<br />
cobalt (4.0 percent) which are copper related,<br />
tobacco (3.5 percent), sugars (2.5 percent) and<br />
cotton 2.2 percent. <strong>The</strong>se six product categories<br />
accounted for 93.2 percent <strong>of</strong> Zambia’s total export<br />
earnings.<br />
Zambia’s Major Exports by HS Chapter for July<br />
<strong>2006</strong>, K’ Millions<br />
Chapter Code Description Value (Zmk) % Share<br />
74 Copper And Articles <strong>The</strong>re<strong>of</strong> 588,305 72.2<br />
26 Ores, Slag And Ash 71,578 8.8<br />
81 Other Base Metals; Cermets; Articles <strong>The</strong>re<strong>of</strong> 32,624 4.0<br />
24 Tobacco And Manufactured Tobacco Substitutes 28,109 3.5<br />
17 Sugars And Sugar Confectionery 20,731 2.5<br />
52 Cotton 17,955 2.2<br />
84 Nuclear Reactors, Boilers, Mchy & Mech Appliance; Parts 6,612 0.8<br />
27 Mineral Fuels, Oils & Product Of <strong>The</strong>ir Distillation; Etc 6,429 0.8<br />
25 Salt; Sulphur; Earth & Ston; Plastering Mat; Lime & Cem 6,350 0.8<br />
85 Electrical Mchy Equip Parts <strong>The</strong>re<strong>of</strong>; Sound Recorder Etc 5,746 0.7<br />
07 Edible Vegetables And Certain Roots And Tubers 5,043 0.6<br />
11 Prod Mill Indust; Malt; Starches; Insulin; Wheat Gluten 3,591 0.4<br />
34 Soap, Organic Surface-Active Agents, Washing Prep, Etc 2,071 0.3<br />
09 C<strong>of</strong>fee, Tea, Mate And Spices 1,310 0.2<br />
68 Art Of Stone, Plaster, Cement, Asbestos, Mica/Sim Mat 1,262 0.2<br />
76 Aluminium And Articles <strong>The</strong>re<strong>of</strong> 1,213 0.1<br />
28 Inorgn Chem; Compds Of Prec Met, Radioact Elements Etc 1,121 0.1<br />
10 Cereals 1,071 0.1<br />
39 Plastics And Articles <strong>The</strong>re<strong>of</strong> 1,016 0.1<br />
Other 12,244 1.5<br />
Total: 814,381 100.0<br />
Source: CSO, International Trade Statistics, <strong>2006</strong>; Note: (*) Provisional<br />
5
<strong>The</strong> <strong>Monthly</strong> – <strong>Vol</strong>ume <strong>41</strong><br />
Zambia’s Major Export<br />
Destinations in July <strong>2006</strong><br />
<strong>The</strong> four major destinations <strong>of</strong> Zambia’s exports<br />
during the month <strong>of</strong> July <strong>2006</strong> were South Africa<br />
(31.9 percent), Switzerland (25.1 percent), Tanzania<br />
(13.5 percent) and the United Kingdom (10.4<br />
percent). <strong>The</strong>se four countries collectively accounted<br />
for 80.9 percent <strong>of</strong> Zambia’s total exports. However,<br />
it should be noted that most <strong>of</strong> the export products<br />
to these countries are copper related products and<br />
that these countries are mainly transshipment points<br />
to other final destinations. Other important outlets<br />
for Zambia’s exports were Congo (DR), China,<br />
Zimbabwe, Malawi and France, collectively<br />
accounting for 12.7 percent <strong>of</strong> Zambia’s total value<br />
<strong>of</strong> exports in July <strong>2006</strong>.<br />
Zambia’s Major Export Destinations by Country,<br />
July <strong>2006</strong>, K’ Millions<br />
COUNTRY VALUE (ZMK) % SHARE<br />
South Africa 260,074 31.9<br />
Switzerland 204,519 25.1<br />
Tanzania 109,795 13.5<br />
United Kingdom 84,848 10.4<br />
Congo (DR) 28,770 3.5<br />
China 23,893 2.9<br />
Zimbabwe 19,592 2.4<br />
Malawi 15,922 2.0<br />
France 15,383 1.9<br />
Portugal 8,940 1.1<br />
Belgium 8,216 1.0<br />
United States <strong>of</strong> America 8,084 1.0<br />
Other 26,344 3.2<br />
TOTAL: 814,381 100.0<br />
<strong>Central</strong> <strong>Statistical</strong> <strong>Office</strong><br />
Export Market Shares by Regional Groupings<br />
<strong>The</strong> Sothern African Development Community<br />
grouping <strong>of</strong> countries (SADC) was the largest market<br />
for Zambia’s exports accounting for 52.9 percent<br />
and 55.2 percent <strong>of</strong> Zambia’s total exports in June<br />
and July <strong>2006</strong> respectively. Within the SADC region,<br />
South Africa was the major market for Zambia’s<br />
exports accounting for 61.2 percent in June <strong>2006</strong><br />
and 57.8 percent in July <strong>2006</strong>.<br />
<strong>The</strong> European Union (EU) was the second largest<br />
destination <strong>of</strong> Zambia’s exports after SADC,<br />
accounting for 16.5 and 15.2 percent in June and<br />
July <strong>2006</strong> respectively. Within the EU, the dominant<br />
market was the United Kingdom with market shares<br />
<strong>of</strong> 57.7 and 68.5 percent in the respective months.<br />
Other key markets were France, Netherlands and<br />
Portugal.<br />
<strong>The</strong> Common Market for Eastern and Southern<br />
Africa region (COMESA) was the third largest<br />
destination <strong>of</strong> Zambia’s exports after SADC and the<br />
EU. Within COMESA, Congo (DR) was the key<br />
destination accounting for 42.9 percent in June<br />
<strong>2006</strong> and 39.6 percent in July <strong>2006</strong>, followed by<br />
Zimbabwe with 21.6 and 27.0 percent in June and<br />
July <strong>2006</strong> respectively. Malawi was third with 21.5<br />
percent in June <strong>2006</strong> and 21.9 percent in July <strong>2006</strong>.<br />
<strong>The</strong> Asian regional grouping accounted for 4.4 and<br />
3.6 percent <strong>of</strong> Zambia’s total exports in June and<br />
July <strong>2006</strong>, respectively. Within the Asian market,<br />
China dominated accounting for 57.6 and 82.6<br />
percent in June and July <strong>2006</strong> respectively. Other<br />
destinations included Japan, Taiwan, India and<br />
Hong Kong together accounting for 42.4 and 17.4<br />
percent in June and July <strong>2006</strong>, respectively.<br />
Export Market Shares by Regional Groupings, June and July <strong>2006</strong><br />
GROUPING<br />
June <strong>2006</strong> GROUPING<br />
July <strong>2006</strong><br />
Value (K' Million) % Share<br />
Value (K' Million)<br />
% Share<br />
SADC 461,648 100 SADC 449,569 100<br />
South Africa 282,629 61.2 South Africa 260,074 57.8<br />
Tanzania 106,715 23.1 Tanzania 109,795 24.4<br />
Congo ( DR) 29,905 6.5 Congo ( DR) 28,770 6.4<br />
Zimbabwe 15,056 3.3 Zimbabwe 19,592 4.4<br />
Malawi 14,999 3.2 Malawi 15,922 3.5<br />
Other SADC 6,171 1.3 Other SADC 7,707 1.7<br />
% <strong>of</strong> Total June Exports: 52.9 % <strong>of</strong> Total July Exports: 55.2<br />
EUROPEAN UNION 144,535 100 EUROPEAN UNION 123,948 100<br />
United Kingdom 83,433 57.7 United Kingdom 84,848 68.5<br />
France 28,383 19.6 France 15,383 12.4<br />
Netherlands 16,321 11.3 Portugal 8,940 7.2<br />
Finland 7,362 5.1 Belgium 8,216 6.6<br />
Belgium 4,964 3.4 Netherlands 4,783 3.9<br />
Other EU 4,072 2.8 Other EU 1,777 1.4<br />
% <strong>of</strong> Total June Exports: 16.5 % <strong>of</strong> Total July Exports: 15.2<br />
ASIA 38,659 100 ASIA 28,920 100<br />
China 22,281 57.6 China 23,893 82.6<br />
Japan 12,560 32.5 Japan 2,075 7.2<br />
Taiwan 1,517 3.9 Hong Kong 1,486 5.1<br />
India 1,392 3.6 Taiwan 1,104 3.8<br />
Other Asia 909 2.4 Other Asia 363 1.3<br />
% <strong>of</strong> Total June Exports: 4.4 % <strong>of</strong> Total July Exports 3.6<br />
COMESA 69,774 100 COMESA 72,676 100<br />
Congo ( DR) 29,905 42.9 Congo ( DR) 28,770 39.6<br />
Zimbabwe 15,056 21.6 Zimbabwe 19,592 27<br />
Malawi 14,999 21.5 Malawi 15,922 21.9<br />
Kenya 9,451 13.5 Kenya 5,705 7.9<br />
Other COMESA 181 0.3 Other COMESA 1,343 1.8<br />
% <strong>of</strong> Total June Exports: 8 % <strong>of</strong> Total July Exports: 8.9<br />
6
<strong>The</strong> <strong>Monthly</strong> – <strong>Vol</strong>ume <strong>41</strong><br />
Imports by SITC<br />
<strong>The</strong> table below shows the total value <strong>of</strong> imports in<br />
June and July <strong>2006</strong> classified by the Standard<br />
International Trade Classification (SITC).<br />
<strong>The</strong> total value <strong>of</strong> imports in June <strong>2006</strong> was K932.5<br />
billion compared to K668.3 billion in July <strong>2006</strong>. <strong>The</strong><br />
most prominent imports were machinery and<br />
transport equipment, which accounted for 33.5<br />
percent in June <strong>2006</strong> and 38.3 percent in July <strong>2006</strong>,<br />
respectively. Other important imports were mineral<br />
fuels, lubricants and related materials, chemicals and<br />
manufactured goods classified chiefly by material,<br />
which collectively accounted for 51.4 and 47.2<br />
percent in June and July <strong>2006</strong>, respectively.<br />
Total Imports by Standard International Trade<br />
Classification (SITC) sections, June and July<br />
<strong>2006</strong>*, K ’Millions<br />
CODE DESCRIPTION<br />
June <strong>2006</strong> July <strong>2006</strong><br />
Value (ZMK) % Share Value (ZMK) % Share<br />
0 Food and live animals 53,021 5.7 29,606 4.4<br />
1 Beverages and tobacco 2,075 0.2 2,151 0.3<br />
2 Crude materials, (excl fuels) 25,278 2.7 20,<strong>41</strong>5 3.1<br />
3<br />
Mineral fuels, lubricants and related<br />
materials 169,652 18.2 109,261 16.3<br />
4<br />
Animal and vegetable oils,fats and<br />
waxes 13,977 1.5 14,050 2.1<br />
5 Chemicals 174,075 18.7 95,636 14.3<br />
6<br />
Manufactured goods classified chiefly<br />
by material 135,701 14.6 110,324 16.5<br />
7 Machinery and transport equipment 312,059 33.5 256,151 38.3<br />
8 Miscellaneous manufactured articles 46,618 5.0 30,288 4.5<br />
9<br />
Commodities and transactions not<br />
classified elsewhere in the SITC 184 0.0 <strong>41</strong>9 0.1<br />
TOTAL: 932,6<strong>41</strong> 100.0 668,301 100.0<br />
Source: CSO, International Trade Statistics, <strong>2006</strong>; Note: (*) Provisional<br />
Zambia’s Major Imports by HS<br />
<strong>The</strong> table below shows Zambia’s major import<br />
products classified by the Harmonized coding<br />
System (HS) in July <strong>2006</strong>.<br />
Zambia’s major import products in July <strong>2006</strong> were<br />
boilers, machinery & mechanical appliances,<br />
electrical machinery equipment and Mineral fuels,<br />
oils and products <strong>of</strong> their distillation and Vehicles.<br />
<strong>The</strong>se three product categories collectively<br />
accounted for 48.7 percent <strong>of</strong> the total value <strong>of</strong><br />
imports for the month. Other important import<br />
products were electrical machinery equipment and<br />
parts there<strong>of</strong> and fertilizers accounting for 5.9 and<br />
4.6 percent in June and July <strong>2006</strong> respectively.<br />
<strong>Central</strong> <strong>Statistical</strong> <strong>Office</strong><br />
Zambia’s Major Imports by HS Chapters for July<br />
<strong>2006</strong>, K’ Millions<br />
CHAPTER<br />
CODE<br />
DESCRIPTION VALUE (ZMK) % SHARE<br />
84 Nuclear Reactors, Boilers, Mchy & Mech Appliance; Parts 136,850 20.5<br />
Of Which:<br />
Self-propelled bulldozers, angle dozers and graders 34,477 25.2<br />
Parts suitable for use solely or principally with dozers 10,936 8.0<br />
Machinery for sorting, screening, separating 10,815 7.9<br />
Derricks; cranes, including cable cranes 8,985 6.6<br />
Pumps for liquids, whether or not fitted with a measure 8,000 5.8<br />
Dish-washing machines; machinery for cleaning or drying 6,863 5.0<br />
Machinery, plant or laboratory equipment 4,701 3.4<br />
Refrigerators, freezers and other refrigerating equipment 3,874 2.8<br />
Other 48,198 35.2<br />
27 Mineral Fuels, Oils & Product Of <strong>The</strong>ir Distillation; Etc 109,745 16.4<br />
87 Vehicles O/T Railw/Tranw Rool-Stock, Pts & Accessories 79,005 11.8<br />
85 Electrical Mchy Equip Parts <strong>The</strong>re<strong>of</strong>; Sound Recorder Etc 39,126 5.9<br />
31 Fertilisers 30,512 4.6<br />
72 Iron And Steel 25,809 3.9<br />
73 Articles Of Iron And Steel 23,475 3.5<br />
39 Plastics And Articles <strong>The</strong>re<strong>of</strong> 22,255 3.3<br />
15 Animal/Veg Fats & Oil & <strong>The</strong>ir Cleavage Products; Etc 15,493 2.3<br />
40 Rubber And Articles <strong>The</strong>re<strong>of</strong> 13,177 2.0<br />
28 Inorgn Chem; Compds Of Prec Met, Radioact Elements Etc 12,624 1.9<br />
25 Salt; Sulphur; Earth & Ston; Plastering Mat; Lime & Cem 12,079 1.8<br />
48 Paper & Paperboard; Art Of Paper Pulp, Paper/Paperboard 10,504 1.6<br />
Other 137,649 20.6<br />
TOTAL: 668,301 100.0<br />
Source: CSO, International Trade Statistics, <strong>2006</strong>; Note: (*) Provisional<br />
Zambia’s Major Import Sources by Country, July<br />
<strong>2006</strong><br />
<strong>The</strong> major source <strong>of</strong> Zambia’s imports in July <strong>2006</strong><br />
was South Africa accounting for 51.9 percent <strong>of</strong> the<br />
total value <strong>of</strong> imports for the month. <strong>The</strong> major<br />
import products from South Africa were:<br />
mineral/chemical fertilizers, vehicles, dumpers for<br />
<strong>of</strong>f-highway use, gas oils (diesel) and motor spirit<br />
(petrol). <strong>The</strong> second main source was the United<br />
Arab Emirates (UAE) accounting for 9.4 percent <strong>of</strong><br />
Zambia’s imports in July <strong>2006</strong>. <strong>The</strong> major import<br />
products from the UAE were: crude petroleum oils<br />
and oils obtained from bituminous minerals, tube<br />
mills and blow moulding machines for working<br />
rubber or plastics. Zimbabwe was third with 7.1<br />
percent and supplied mainly coke and semi-coke <strong>of</strong><br />
coal/peat, Portland cement (excl. white) and fresh<br />
Oranges. Other notable sources <strong>of</strong> Zambia’s imports<br />
were China, India, Kenya and Japan; collectively<br />
accounting for 14.4 percent <strong>of</strong> Zambia’s total<br />
imports in July <strong>2006</strong>.<br />
Zambia’s Top Import Sources by country, July<br />
<strong>2006</strong>, K’Millions,<br />
COUNTRY VALUE (ZMK) % SHARE<br />
South Africa 346,854 51.9<br />
United Arab Emirates 62,551 9.4<br />
Zimbabwe 47,127 7.1<br />
China 46,798 7.0<br />
India 19,146 2.9<br />
Kenya 16,293 2.4<br />
Japan 13,928 2.1<br />
Switzerland 10,380 1.6<br />
Germany 10,124 1.5<br />
United Kingdom 9,716 1.5<br />
Mozambique 8,622 1.3<br />
Netherlands 8,291 1.2<br />
Tanzania, United 8,033 1.2<br />
Congo (DR) 6,007 0.9<br />
Other 54,430 8.1<br />
TOTAL: 668,301 100.0<br />
Source: CSO, International Trade Statistics, <strong>2006</strong>; Note: (*) Provisional<br />
7
<strong>The</strong> <strong>Monthly</strong> – <strong>Vol</strong>ume <strong>41</strong><br />
Import Market Shares by Regional Groupings<br />
<strong>The</strong> Southern African Development Community<br />
grouping <strong>of</strong> countries (SADC) was the largest source<br />
<strong>of</strong> Zambia’s imports accounting for 59.9 percent and<br />
65.6 percent in June and July <strong>2006</strong> respectively.<br />
Within the SADC region, South Africa was the major<br />
source for Zambia’s imports accounting for 78.9<br />
percent in June and 79.2 percent in July <strong>2006</strong>.<br />
<strong>The</strong> European Union (EU) was the second largest<br />
source <strong>of</strong> Zambia’s imports after SADC with 11.3<br />
percent in June <strong>2006</strong> and 5.6 percent in July <strong>2006</strong>.<br />
Within the EU, the dominant source was the United<br />
Kingdom with 37.0 percent and Germany with 27.0<br />
percent in June and July <strong>2006</strong> respectively. Other<br />
key markets were Sweden, Netherlands and<br />
Belgium.<br />
<strong>Central</strong> <strong>Statistical</strong> <strong>Office</strong><br />
<strong>The</strong> Asian market was the third largest source <strong>of</strong><br />
Zambia’s imports after SADC and the EU accounting<br />
for 24.3 and 24.0 percent in June and July<br />
respectively. Within the Asian market, United Arab<br />
Emirates dominated accounting for 61.8 percent in<br />
June and 39.0 percent in July <strong>2006</strong> while India and<br />
China were second in June with 13.5 percent and<br />
29.2 percent in July <strong>2006</strong>.<br />
<strong>The</strong> Common Market for Eastern and Southern<br />
Africa region (COMESA) was the fourth largest<br />
source accounting 9.9 percent in June <strong>2006</strong> and<br />
11.6 percent in July <strong>2006</strong>. Within COMESA,<br />
Zimbabwe was the main source accounting for 67.1<br />
and 61.0 percent in June and July <strong>2006</strong> respectively,<br />
followed by Kenya with 15.5 percent in June <strong>2006</strong><br />
and 21.1 percent in July <strong>2006</strong>.<strong>The</strong> other notable<br />
source was Congo (DR) with 9.9 and 7.3 percent in<br />
June and July <strong>2006</strong>, respectively.<br />
GROUPING<br />
Import Market shares by major Regional groupings, June and July <strong>2006</strong><br />
June <strong>2006</strong> July <strong>2006</strong><br />
GROUPING<br />
Value (K'Million) % Share<br />
Value (K'Million)<br />
SADC 550,097 100 SADC 438,097 100<br />
South Africa 433,796 78.9 South Africa 346,854 79.2<br />
Zimbabwe 62,147 11.3 Zimbabwe 47,127 10.8<br />
Mozambique 15,167 2.8 Mozambique 8,622 2<br />
Congo (DR) 9,147 1.7 Tanzania 8,033 1.8<br />
Tanzania 8,169 1.5 Congo (DR) 6,007 1.4<br />
Other SADC 10,835 2 Other SADC 10,727 2.4<br />
% <strong>of</strong> Total June Imports: 59 % <strong>of</strong> Total July Imports: 65.6<br />
EUROPEAN UNION 105,488 100 EUROPEAN UNION 37,458 100<br />
United Kingdom 39,030 37 Germany 10,124 27<br />
Sweden 15,072 14.3 United Kingdom 9,716 25.9<br />
Netherlands 12,594 11.9 Netherlands 8,291 22.1<br />
Germany 12,120 11.5 Belgium 1,921 5.1<br />
Other EU 26,672 25.3 Other EU 7,406 19.8<br />
% <strong>of</strong> Total June Exports: 11.3 % <strong>of</strong> Total July Exports: 5.6<br />
ASIA 226,350 100 ASIA 160,498 100<br />
United Arab Emirates 139,838 61.8 United Arab Emirates 62,551 39<br />
India 30,539 13.5 China 46,798 29.2<br />
China 17,689 7.8 India 19,146 11.9<br />
Japan 15,562 6.9 Japan 13,928 8.7<br />
Other Asia 22,723 10 Other Asia 18,075 11.3<br />
% Of Total June Imports: 24.3 % Of Total July Imports: 24<br />
COMESA 92,620 100 COMESA 77,208 100<br />
Zimbabwe 62,147 67.1 Zimbabwe 47,127 61<br />
Kenya 14,321 15.5 Kenya 16,293 21.1<br />
Congo (DR) 9,147 9.9 Congo (DR) 6,007 7.8<br />
Other COMESA 7,005 7.6 Other COMESA 7,781 10.1<br />
% <strong>of</strong> Total June Imports: 9.9 % <strong>of</strong> Total July Imports: 11.6<br />
Source: CSO, International Trade Statistics, <strong>2006</strong>; Note: (*) Provisional<br />
Note: Some countries are members <strong>of</strong> both SADC and COMESA<br />
% Share<br />
8
<strong>The</strong> <strong>Monthly</strong> – <strong>Vol</strong>ume <strong>41</strong><br />
Labour<br />
Parastatals spend more than<br />
Government on Wages<br />
About K190.7 billion was spent on workers as<br />
income by parastatal companies in January <strong>2006</strong>.<br />
This is according to the latest Formal Sector<br />
Employment and Earnings Inquiry Report published<br />
by <strong>Central</strong> <strong>Statistical</strong> <strong>Office</strong> in May <strong>2006</strong>.<strong>The</strong> report<br />
shows that 489,943 formal sector employees who<br />
include both Zambians and Non-Zambians got a<br />
total <strong>of</strong> K734.54 billion. It also states that during the<br />
same period, <strong>Central</strong> government spent K105 billion<br />
on civil servants as income.<br />
Number <strong>of</strong> Employees and Wage Bill by Sector,<br />
January <strong>2006</strong><br />
Sector<br />
Number <strong>of</strong><br />
Employees<br />
Average Income per month<br />
(In Kwacha)<br />
Total Wage<br />
Bill (In Kwacha)<br />
<strong>Central</strong> Government 117,056 896,779 104,973,317,378<br />
Local Government 7,771 969,019 7,530,250,336<br />
Parastatal 49,085 3,885,150 190,702,600,457<br />
Private 325,031 1,327,053 431,333,464,287<br />
Total 498,943 1,472,191 734,539,632,458<br />
Source: Formal Sector Employment and Earnings Inquiry Report, <strong>2006</strong><br />
A wage bill <strong>of</strong> about K431.3 billion spent by private<br />
institutions as income for workers was 2 times as<br />
much as that spent by parastatal institutions, yet in<br />
total, there were 325,031 workers in the private<br />
sector and 49,085 employees in the parastatal<br />
institutions, implying that a worker in the parastatal<br />
institution got a higher income on average than a<br />
worker in the private sector.<br />
Number <strong>of</strong> Employees and Wage Bill by Industry,<br />
January <strong>2006</strong><br />
Industry<br />
Number <strong>of</strong><br />
Employees<br />
Average<br />
Income<br />
per month<br />
(in Kwacha)<br />
Total Wage<br />
Bill (In Kwacha)<br />
Agriculture 56,139 382,473 21,471,651,747<br />
Mining 45,821 2,936,374 134,547,593,054<br />
Manufacturing 55,709 1,440,032 80,222,742,688<br />
Electricity and Water 12,399 5,644,892 69,991,015,908<br />
Construction 14,343 862,331 12,368,<strong>41</strong>3,533<br />
Trade 65,012 692,847 45,043,369,164<br />
Transport 19,378 1,580,453 30,626,018,234<br />
Business Services 54,032 3,160,290 170,756,789,280<br />
Personal and<br />
176,110 962,535 169,512,038,850<br />
Community Services<br />
Total 498,943 1,472,191 734,539,632,458<br />
Source: Formal Sector Employment and Earnings Inquiry Report, <strong>2006</strong><br />
Information on wage bill by industry was also<br />
collected. <strong>The</strong> report indicates that mining industry<br />
<strong>Central</strong> <strong>Statistical</strong> <strong>Office</strong><br />
spent more (K134.5 billion) on 45,821 employees<br />
compared to Trading and Agricultural industries with<br />
relatively more employees. Institutions specialized in<br />
Business services disbursed almost the same amount<br />
(K170.8 billion) on fewer employees as those<br />
institutions specialized in Personal and community<br />
services. This also entails that workers in Business<br />
service specailisation got higher income on average<br />
than those in Personal and community industry.<br />
Average income per month <strong>of</strong> K5,644,892 was<br />
highest in the Electricity and Water industry and was<br />
followed by that <strong>of</strong> Business Services <strong>of</strong> K3,160,290.<br />
<strong>The</strong> lowest average income was recorded in the<br />
Agricultural Industry amounting to K382,473.<br />
Living Conditions<br />
Two in Every Five Households<br />
rely on Salaries as the Main<br />
Source <strong>of</strong> Income<br />
According to the 2004 Living Conditions Monitoring<br />
Survey results, the major sources <strong>of</strong> household<br />
income were regular salaries at 38 percent followed<br />
by non-farming business at 23 percent.<br />
Consumption <strong>of</strong> own produce accounted for 13<br />
percent, while the sale <strong>of</strong> agricultural produce<br />
accounted for only 4 percent <strong>of</strong> total household<br />
income.<br />
Rural/urban analysis shows that regular salaries were<br />
the main source <strong>of</strong> income in the urban areas. One<br />
in every two households, or 52 percent, had regular<br />
salaries as their main source <strong>of</strong> income compared to<br />
18 percent <strong>of</strong> the rural households. This was<br />
followed by non-farming businesses, which<br />
accounted for 26 percent <strong>of</strong> the household income<br />
in the urban areas compared to 19 percent in the<br />
rural areas.<br />
<strong>The</strong> results further show that Income imputed from<br />
consumption <strong>of</strong> own produce was much more<br />
prominent among rural at 27 percent than among<br />
urban households at 3 percent. Noticeable amongst<br />
rural households are small-scale agricultural<br />
households whose imputed income from<br />
consumption <strong>of</strong> own produce accounted for about<br />
30 percent <strong>of</strong> their total household income, as<br />
compared to 17 percent among fish farming<br />
households, 16 percent among medium scale<br />
farming households, 11 percent among rural nonagricultural<br />
households and 7 percent among largescale<br />
agricultural households.<br />
9
<strong>The</strong> <strong>Monthly</strong> – <strong>Vol</strong>ume <strong>41</strong><br />
<strong>Central</strong> <strong>Statistical</strong> <strong>Office</strong><br />
Residence/<br />
Stratum<br />
Share <strong>of</strong> Total Household Income by Source <strong>of</strong> Income, Residence, Stratum and Zambia, 2004<br />
Sale <strong>of</strong><br />
Crops<br />
Sale <strong>of</strong><br />
live stock/<br />
Poultry<br />
Non<br />
Farming<br />
Business<br />
Consumption<br />
<strong>of</strong> own<br />
produce<br />
Regular<br />
Salary<br />
Other<br />
Sources<br />
Total<br />
Number <strong>of</strong><br />
households<br />
All Zambia 5.5 4.4 22.8 12.7 38.3 16.3 100 2,110,640<br />
Rural 12 9.4 18.5 26.6 17.9 15.6 100 1,288,064<br />
Urban 1.1 0.9 25.7 3.3 52.2 16.8 100 822,575<br />
Rural Small Scale 11.1 9.4 18.6 29.6 15.8 15.4 100 1,155,838<br />
Rural Medium Scale 28.7 12.6 14.4 15.8 14.0 14.6 100 43,311<br />
Rural Large Scale 18.9 28.3 7.3 7.0 22.3 16.2 100 3,569<br />
Fish farming 22.5 11.8 28.4 17.2 10.8 9.4 100 1,620<br />
Rural Non Agric 0.3 0.8 25.2 11.3 44.3 18.1 100 83,726<br />
Urban Low Cost 1 0.8 30.4 3.4 47.7 16.7 100 593,484<br />
Urban Medium Cost 1.1 0.8 20.3 3.5 56.3 18.0 100 143,394<br />
Urban High Cost 1.4 1.5 14.6 2.7 64.1 15.7 100 85,697<br />
Source: CSO, 2004 Living Conditions Monitoring Survey<br />
Analysis by province shows that the most <strong>of</strong> the<br />
provinces’ main source <strong>of</strong> income were regular<br />
salaries. All, except Luapula and Western provinces,<br />
reported regular salaries as their major source <strong>of</strong><br />
income. Luapula and Western provinces’ main<br />
source <strong>of</strong> income was non-farming businesses.<br />
Copperbelt and Lusaka provinces reported the<br />
highest share <strong>of</strong> household income from salaries, 53<br />
percent and 52 percent, respectively.<br />
Province<br />
Share <strong>of</strong> Total Household Income by Source <strong>of</strong> Income and Province, 2004<br />
Sale <strong>of</strong><br />
Crops<br />
Sale <strong>of</strong><br />
live stock/<br />
Poultry<br />
Non<br />
Farming<br />
Business<br />
Consumption<br />
<strong>of</strong> own<br />
produce<br />
Regular<br />
Salary<br />
Other<br />
Sources<br />
Total<br />
Number <strong>of</strong><br />
households<br />
<strong>Central</strong> 10.6 6.3 24.2 12.6 31.1 15.2 100 207,243<br />
Copperbelt 2.2 1.7 21.9 4.9 53.2 16.0 100 311,712<br />
Eastern 12 5.8 21.0 18.0 24.8 18.6 100 290,224<br />
Luapula 6.8 5.5 30.3 27.5 16.2 13.7 100 171,659<br />
Lusaka 1.8 1.7 23.6 2.3 52.2 18.4 100 309,949<br />
Northern 6.9 7.2 21.4 24.4 28.3 11.9 100 275,395<br />
North Western 6.7 3.2 16.9 17.0 37.9 18.2 100 125,814<br />
Southern 4.7 7.6 22.0 16.7 35.8 13.2 100 252,423<br />
Western 3.1 5.8 27.4 20.0 23.5 20.1 100 166,219<br />
Source: CSO, 2004 Living Conditions Monitoring Survey<br />
Agriculture<br />
Western Province records Huge Losses in Area Planted to Crops!<br />
According to findings from the Crop-Forecasting<br />
Survey 2005/<strong>2006</strong> Agricultural Season, there were a<br />
total <strong>of</strong> 1,106,248 agricultural households in<br />
Zambia. Of these households, 816,564 (73.8<br />
percent) were headed by males, where as 289,684<br />
(26.2 percent) were female-headed.<br />
Distribution <strong>of</strong> Household Heads by Province and Sex<br />
Sex <strong>of</strong> Head<br />
Province<br />
Male<br />
Female<br />
Total<br />
Number Percent Number Percent Number Percent<br />
<strong>Central</strong> 90,829 74.4 31,206 25.6 122,035 100.0<br />
Copperbelt 61,083 78.7 16,517 21.3 77,600 100.0<br />
Eastern 170,376 69.4 75,1<strong>41</strong> 30.6 245,516 100.0<br />
Luapula 79,537 81.0 18,612 19.0 98,149 100.0<br />
Lusaka 17,636 77.2 5,202 22.8 22,838 100.0<br />
Northen 151,011 80.5 36,586 19.5 187,597 100.0<br />
North<br />
57,686 75.5 18,719 24.5 76,404 100.0<br />
Western<br />
Southern 113,301 71.7 44,751 28.3 158,053 100.0<br />
Western 75,106 63.6 42,950 36.4 118,056 100.0<br />
Total 816,564 73.8 289,684 26.2 1,106,248 100.0<br />
Source: CSO, Crop Forecast Survey 2005/<strong>2006</strong><br />
In total, the male-headed households planted<br />
1,069,117.4 hectares, where as the female-headed<br />
households planted 255,620 hectares to various<br />
crops. This means the male-headed households had<br />
an average field-size <strong>of</strong> 1.3 hectares, while femaleheaded<br />
households had an average field size <strong>of</strong> 0.9<br />
hectares. <strong>The</strong> national average field size was 1.2<br />
hectares per household. Thus, fields for femaleheaded<br />
households tended to be below the national<br />
average in size and smaller than those for maleheaded<br />
households.<br />
At national level, <strong>of</strong> the area that was planted to<br />
various crops for male-headed households, 17.3<br />
percent is expected not to be harvested while 22.1<br />
percent <strong>of</strong> the area planted by female-headed<br />
households could similarly not be harvested.<br />
10
<strong>The</strong> <strong>Monthly</strong> – <strong>Vol</strong>ume <strong>41</strong><br />
At provincial level, Western Province recorded 46.3<br />
and 55.8 percent <strong>of</strong> area planted to crops that could<br />
not be harvested for male and female headed<br />
households, respectively. Southern Province was<br />
second with both male and female-headed<br />
households recording 35.0 and 34.1 percent <strong>of</strong> area<br />
planted to crops not being harvested, respectively.<br />
<strong>The</strong> remaining provinces recorded lower proportions<br />
<strong>of</strong> less than 25 percent each <strong>of</strong> the planted area not<br />
being harvested.<br />
Area Planted, Area Harvested and Area Lost by<br />
Province and Sex <strong>of</strong> Head<br />
Sex <strong>of</strong> Head<br />
Male<br />
Female<br />
Percentage<br />
Percentage<br />
Province Area<br />
Area<br />
Area Area %<br />
% Area<br />
planted Expected<br />
planted expected Area<br />
Lost<br />
(Ha) to be<br />
(Ha) to be Lost<br />
harvested<br />
harvested<br />
<strong>Central</strong> 170,148.5 82.2 17.8 38,058 80.9 19.1<br />
Copperbelt 70,143.9 86.1 13.9 12,819 77.0 23.0<br />
Eastern 297,064.2 90.6 9.4 85,714 87.6 12.4<br />
Luapula 38,694.2 92.4 7.6 6,128 92.6 7.4<br />
Lusaka 23,365.0 89.8 10.2 4,899 83.7 16.3<br />
Northen 159,847.1 93.4 6.6 25,691 85.4 14.6<br />
North<br />
Western<br />
53,045.7 93.2 6.8 11,035 93.5 6.5<br />
Southern 192,316.1 65.0 5.0 45,104 65.9 34.1<br />
Western 64,492.5 53.7 46.3 26,171 44.2 55.8<br />
Zambia 1,069,117.4 82.7 17.3 255,620 77.9 22.1<br />
Source: CSO, Crop Forecast Survey 2005/<strong>2006</strong><br />
Various reasons were cited as factors that would lead<br />
to loss <strong>of</strong> harvest. Of the total area <strong>of</strong> 235,128.2<br />
hectares that was expected not to be harvested, 30<br />
percent would be lost due to water logging, 27<br />
percent due to lack <strong>of</strong> fertilizers.<br />
Percentage Distribution <strong>of</strong> Area Lost to Various<br />
Causes<br />
Floods<br />
9%<br />
<strong>The</strong>ft<br />
0%<br />
Pests and<br />
diseases<br />
6%<br />
Field not<br />
weeded<br />
6%<br />
Animal/bird<br />
destruction<br />
5%<br />
Other<br />
11%<br />
Wilting due to<br />
drought<br />
6%<br />
Source: CSO, Crop Forecast Survey 2005/<strong>2006</strong><br />
Lack <strong>of</strong> fertilizer<br />
27%<br />
Water Logging<br />
30%<br />
Demography<br />
Acceptability <strong>of</strong> Unmarried<br />
Females to buy Condoms,<br />
Increase<br />
<strong>The</strong> 2005 Zambia Sexual Behaviour Survey (ZSBS)<br />
results reveal that 54.9 percent <strong>of</strong> young people<br />
aged 15-24 years in Zambia feel that it is acceptable<br />
for unmarried females to buy condoms. This<br />
represents an increase <strong>of</strong> over 4-percentage point<br />
from 50.2 percent that was recorded in 2003.<br />
<strong>Central</strong> <strong>Statistical</strong> <strong>Office</strong><br />
A general increase is also observed in the percentage<br />
<strong>of</strong> adolescents who feel that it is acceptable for<br />
females to purchase condoms. <strong>The</strong> highest<br />
percentage increase is observed among female<br />
adolescents from 39.8 percent in 2003 to 48.6<br />
percent in 2005. <strong>The</strong> percentage <strong>of</strong> male<br />
adolescents also increased from 51.0 percent in<br />
2003 to 55.0 percent in 2005<br />
Among young adults (20-24 years), the percentage<br />
<strong>of</strong> those who felt it was acceptable for females to<br />
purchase condoms increased among females from<br />
52.0 percent in 2003 to 56.0 percent 2005.<br />
However, the percentage <strong>of</strong> male respondents who<br />
felt it was acceptable for females to purchase<br />
condoms remained the same at 61.0 percent in the<br />
same period.<br />
Percent<br />
70<br />
60<br />
50<br />
40<br />
30<br />
20<br />
10<br />
0<br />
Percentage <strong>of</strong> Young People who felt condom<br />
purchase by unmarried Female is acceptable<br />
50.2<br />
61 61<br />
54.9 54.9<br />
56<br />
51<br />
52<br />
48.6<br />
39.8<br />
2003 2005<br />
Year<br />
Total 15-24 years Males 15-19 years Females 15-19 years<br />
Males 20 - 24 years Females 20 - 24 years<br />
Source: CSO, 2005 Zambia Sexual Behaviour Survey<br />
Feature Article<br />
Sixty-eight percent (69%) <strong>of</strong><br />
the Population in Southern<br />
Province is Poor!<br />
<strong>The</strong> incidence <strong>of</strong> poverty in Southern Province was<br />
recorded at 68 percent <strong>of</strong> an estimated population<br />
<strong>of</strong> 1,362,228, reveals the 2004 Living Conditions<br />
Monitoring Survey (LCMS IV).<br />
In terms <strong>of</strong> resources needed to eradicate poverty or<br />
to bring all the poor persons to the poverty line, the<br />
province would require about K639.3 billion on an<br />
annual basis.<br />
Southern Province is divided into eleven districts,<br />
namely: Choma, Gwembe, Itezhi-tezhi, Kalomo,<br />
Kazungula, Livingstone, Mazabuka, Monze,<br />
Namwala, Siavonga and Sinazongwe. In terms <strong>of</strong><br />
resource allocation at district level, Mazabuka<br />
District would need to get the largest share <strong>of</strong> 16<br />
percent <strong>of</strong> the total provincial resources followed by<br />
Kalomo, Monze and Choma districts with 15<br />
percent each. <strong>The</strong> least shares <strong>of</strong> the resources<br />
11
<strong>The</strong> <strong>Monthly</strong> – <strong>Vol</strong>ume <strong>41</strong><br />
would be allocated to Gwembe, Itezhi-tezhi and<br />
Livingstone districts, which would require 4 percent<br />
each.<br />
Resource Allocation for Poverty Eradication in<br />
Southern Province<br />
Siavonga<br />
6%<br />
Namwala<br />
8%<br />
Monze<br />
15%<br />
Sinazongwe<br />
6%<br />
Mazabuka<br />
16%<br />
Choma<br />
15%<br />
Kazungula<br />
7%<br />
Livingstone<br />
4%<br />
Source: CSO, Living Conditions Monitoring Survey IV 2004<br />
Gwembe<br />
4%<br />
Itezhi-tezhi<br />
4%<br />
Kalomo<br />
15%<br />
Female Headed Households<br />
poorer than Male-Headed<br />
Households!<br />
<strong>The</strong> survey reveals that poverty was higher in<br />
female-headed households at 76 percent than in<br />
male-headed households at 66 percent in 2004.<br />
<strong>The</strong> incidence <strong>of</strong> extreme poverty was also higher<br />
among female headed households (64 percent),<br />
than male headed households (51 percent)<br />
Poverty by Sex <strong>of</strong> Head <strong>of</strong> Household, Southern<br />
Province, 2004<br />
Poverty Status<br />
Sex <strong>of</strong> Head<br />
Total<br />
Poor<br />
Extremely<br />
Poor<br />
Moderately<br />
Poor<br />
Not<br />
Poor<br />
Population<br />
by sex <strong>of</strong><br />
household<br />
head<br />
All Province 68 54 14 32 1,362,228<br />
Male 66 51 15 33 1,107,628<br />
Female 76 64 12 24 254,600<br />
Source: CSO, Living Conditions Monitoring Survey IV 2004<br />
Education, Key to low Levels <strong>of</strong><br />
Poverty<br />
<strong>The</strong> incidence <strong>of</strong> poverty by education status <strong>of</strong> the<br />
head <strong>of</strong> the household show that the highest<br />
proportions <strong>of</strong> the poor were recorded in<br />
households where the head had no formal<br />
education or had low levels <strong>of</strong> education compared<br />
to households headed by persons with higher levels<br />
<strong>of</strong> education attainment.<br />
In 2004, the proportion <strong>of</strong> the poor in households<br />
where the head had no formal education was<br />
recorded at 85 percent. On the other hand, the<br />
proportion <strong>of</strong> the poor in households headed by<br />
persons with tertiary level <strong>of</strong> education were<br />
recorded at only 29 percent in 2004.<br />
<strong>Central</strong> <strong>Statistical</strong> <strong>Office</strong><br />
<strong>The</strong> incidence <strong>of</strong> extreme poverty was also highest<br />
among households headed by persons with no<br />
education, at 73 percent, and lowest among<br />
households headed by persons with tertiary<br />
education, at 19 percent.<br />
Poverty by Education Attainment <strong>of</strong> Head <strong>of</strong><br />
Household, Southern Province, 2004<br />
Poverty Status<br />
Educational<br />
Level<br />
Total Extremely Moderately Not<br />
Population<br />
Poor Poor Poor Poor<br />
All Province 68 54 14 32 1,362,228<br />
None 85 73 12 14 108,835<br />
Primary school 75 62 13 25 609,071<br />
Secondary 64 47 17 36 554,913<br />
Tertiary 29 19 10 72 89,409<br />
Source: CSO, Living Conditions Monitoring Survey IV 2004<br />
Poverty Levels lowest among<br />
Households with Heads in Wage<br />
(Paid) Employment<br />
<strong>The</strong> LCMS IV results reveal that poverty levels vary<br />
according to the type <strong>of</strong> economic activity that the<br />
head <strong>of</strong> household is engaged in. <strong>The</strong> results shows<br />
that in 2004, poverty was lowest among households<br />
whose heads were engaged in wage employment at<br />
47 percent and highest among households whose<br />
heads were engaged in farming/fishing/forestry at 81<br />
percent.<br />
<strong>The</strong> pattern is the same for extreme poverty, with<br />
households headed by persons engaged in wage<br />
employment having the lowest incidence and those<br />
in farming/fishing/forestry having the highest.<br />
Poverty by Economic Activity <strong>of</strong> Household Head,<br />
Southern Province, 2004<br />
Economic<br />
Poverty Status<br />
Activity <strong>of</strong> Total Extremely Moderately Not Population<br />
Head<br />
Poor Poor Poor Poor<br />
All Province 68 54 14 32 1,362,228<br />
In wage<br />
employment<br />
47 29 18 54 322,919<br />
Running a<br />
business<br />
53 36 17 47 185,420<br />
Farming/Fishing/<br />
Forestry<br />
81 68 13 20 800,317<br />
Not working 77 61 16 24 53,573<br />
Source: CSO, Living Conditions Monitoring Survey IV 2004<br />
Poverty Levels highest among<br />
Child Headed Households<br />
In Southern Province, poverty levels were highest<br />
among households headed by children (ages 12 to<br />
19 years) in 2004, at 90 percent. <strong>The</strong> population in<br />
child headed households was insignificant though at<br />
7,745 in 2004.<br />
<strong>The</strong> next highest poverty levels were recorded<br />
among households headed by the aged (60+ years)<br />
at 81 percent.<br />
12
<strong>The</strong> <strong>Monthly</strong> – <strong>Vol</strong>ume <strong>41</strong><br />
<strong>Central</strong> <strong>Statistical</strong> <strong>Office</strong><br />
<strong>The</strong> population living in households whose heads<br />
were in the most productive age groups <strong>of</strong> 20-29<br />
years and 30-59 years had the least poverty levels at<br />
66 percent each, respectively.<br />
<strong>The</strong> incidence <strong>of</strong> extreme poverty was highest<br />
among the aged (60+ years). Seventy one percent<br />
(71 percent) <strong>of</strong> the total population living in<br />
households whose heads were aged sixty years plus<br />
were extremely poor. <strong>The</strong> incidence <strong>of</strong> extreme<br />
poverty was lower with younger age groups.<br />
Poverty by Age <strong>of</strong> Household Head, Southern<br />
Province, 2004<br />
Age <strong>of</strong><br />
Head<br />
Total<br />
Poor<br />
Extremely<br />
Poor<br />
Poverty Status<br />
Moderately<br />
Poor<br />
Not Poor<br />
Population<br />
All<br />
1,362,228<br />
68 54 14 32<br />
Province<br />
12 – 19 90 12 78 10 7,745<br />
20 - 29 66 44 22 34 228,421<br />
30 – 59 66 53 13 34 919,319<br />
60 and above 81 71 10 19 206,743<br />
Source: CSO, Living Conditions Monitoring Survey IV 2004<br />
Poverty Levels highest in<br />
Namwala District!<br />
In Southern Province, the following seven districts<br />
had poverty levels <strong>of</strong> over 70 percent in 2004;<br />
Gwembe, Kalomo, Kazungula, Mazabuka, Monze,<br />
Namwala and Siavonga.<br />
Namwala District had the highest level <strong>of</strong> poverty in<br />
2004 at 82 percent and Livingstone District had the<br />
least at 42 percent.<br />
Gwembe District had the highest incidence <strong>of</strong><br />
extreme poverty in 2004. Sixty-six percent (66<br />
percent) <strong>of</strong> the total population <strong>of</strong> Gwembe District<br />
were extremely poor in 2004. Livingstone District<br />
had the lowest incidence <strong>of</strong> extreme poverty at only<br />
29 percent <strong>of</strong> its population.<br />
<strong>The</strong> Layman and<br />
Statistics<br />
Forced Sex: This is sex without the consent <strong>of</strong> ones<br />
partner<br />
Chronically ill: This is when a person has been sick<br />
for at least three or more months<br />
Adolescents: <strong>The</strong> development stage between<br />
childhood and adulthood (Young people aged 15-19)<br />
Poverty: Is when a household or households are not<br />
able to acquire a specific level <strong>of</strong> consumption. Levels<br />
<strong>of</strong> consumption <strong>of</strong>ten used are those covering food and<br />
other basic needs such as housing, water, sanitation,<br />
health and education<br />
Agricultural Season: This refers to the period<br />
starting1 st <strong>of</strong> October and ends on 30 th <strong>of</strong> September<br />
<strong>of</strong> the following year<br />
<strong>The</strong> incidence <strong>of</strong> extreme poverty was more than 50<br />
percent <strong>of</strong> the total population <strong>of</strong> all the districts <strong>of</strong><br />
Southern Province except Itezhi-tezhi, Livingstone<br />
and Sinazongwe whose incidence <strong>of</strong> extreme<br />
poverty were 45 percent, 29 percent and 44<br />
percent, respectively.<br />
Incidence <strong>of</strong> Poverty in the Districts <strong>of</strong> Southern<br />
Province, 2004<br />
Poverty Status<br />
Districts Total Extremely Moderately Not Population<br />
Poor Poor Poor Poor<br />
All Province 68 54 14 32 1,362,228<br />
Choma 67 53 14 33 222,766<br />
Gwembe 72 66 6 28 38,965<br />
Itezhi-tezhi 62 45 17 38 49,473<br />
Kalomo 73 60 13 27 193,861<br />
Kazungula 73 61 12 27 77,147<br />
Livingstone 42 29 13 59 111,852<br />
Mazabuka 72 54 18 28 229,884<br />
Monze 72 62 10 29 183,256<br />
Namwala 82 61 21 17 96,891<br />
Siavonga 77 62 15 22 64,568<br />
Sinazongwe 63 44 19 37 93,566<br />
Source: CSO, Living Conditions Monitoring Survey IV 2004<br />
13
<strong>The</strong> <strong>Monthly</strong> – <strong>Vol</strong>ume <strong>41</strong> <strong>Central</strong> <strong>Statistical</strong> <strong>Office</strong><br />
SOUTHERN PROVINCE<br />
Incidence <strong>of</strong> Poverty By District, 1998 and 2004<br />
Itezhi-Tezhi<br />
87<br />
62<br />
83<br />
82<br />
77<br />
72<br />
Namwala<br />
75<br />
72<br />
Mazabuka<br />
Monze<br />
80<br />
77<br />
88<br />
72<br />
Siavonga<br />
85<br />
73<br />
72<br />
73<br />
73<br />
67<br />
Choma<br />
Gwembe<br />
N<br />
Kazungula<br />
Kalomo<br />
Sinazongwe<br />
72<br />
63<br />
W<br />
S<br />
E<br />
61<br />
42<br />
Livingstone<br />
Scale<br />
Legend<br />
Total Poor 98<br />
Total Poor 04<br />
20 0 20 40 60 80 100 120 140 Kilometers<br />
14
<strong>The</strong> <strong>Monthly</strong> – <strong>Vol</strong>ume <strong>41</strong><br />
<strong>Central</strong> <strong>Statistical</strong> <strong>Office</strong><br />
.Now Available<br />
Living Conditions Monitoring Survey IV Report<br />
Poverty report<br />
Zambia Sexual Behaviour Survey, 2005<br />
Selected Socio-Economic Indicators, 2003 - 2004<br />
Zambia in Figures, 2003 - 2004<br />
<strong>The</strong> Non-Farm Informal Sector in Zambia 2002 – 2003<br />
Soon to be released!<br />
First Quarter <strong>2006</strong> External Trade Statistics Bulletin<br />
Employment and Earnings Inquiry Report, January <strong>2006</strong><br />
Subscribe for your free electronic copy <strong>of</strong> “<strong>The</strong> <strong>Monthly</strong>” online at www.zamstats.gov.zm<br />
<strong>The</strong> Editorial Team would like to thank all Media Institutions and Users <strong>of</strong><br />
“<strong>The</strong> <strong>Monthly</strong>”<br />
Thank you for supporting us<br />
Secretariat<br />
Ms. Efreda Chulu - Director<br />
John Kalumbi - Deputy Director<br />
Lee Chileshe - Acting Publications and Marketing Manager<br />
Cecilia Masheke - Librarian<br />
Petronella Kaputu - Press Liaison <strong>Office</strong>r<br />
Anthony Nkole - Desktop Publishing <strong>Office</strong>r<br />
Perry Musenge - Desktop Publishing <strong>Office</strong>r<br />
Editorial Team<br />
Ms. Efreda Chulu – Acting Director<br />
John Kalumbi - Deputy Director<br />
Batista Chilopa – Operations Manager<br />
Daniel Daka – Principal Statistician<br />
Lee Chileshe – Acting Publications and Marketing Manager<br />
Lovemore Zonde - Statistician<br />
Palver Sikanyiti – Statistician<br />
Gerson Banda – Statistician<br />
Josephine Chewe Banda - Statistician<br />
Shebo Nalishebo – Statistician<br />
Lubinda Mukata - Statistician<br />
Chisuwa Sandu – Assistant Field Co-ordinator<br />
Page Layout & Illustrations<br />
Anthony Nkole - Desktop Publishing <strong>Office</strong>r<br />
Perry Musenge - Desktop Publishing <strong>Office</strong>r<br />
15