Vol 50 2007 The Monthly May.pdf - Central Statistical Office of Zambia
Vol 50 2007 The Monthly May.pdf - Central Statistical Office of Zambia
Vol 50 2007 The Monthly May.pdf - Central Statistical Office of Zambia

You also want an ePaper? Increase the reach of your titles
YUMPU automatically turns print PDFs into web optimized ePapers that Google loves.
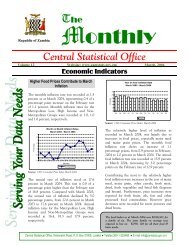
<strong>The</strong>Republic <strong>of</strong> <strong>Zambia</strong><strong>Vol</strong>ume <strong>50</strong> Website: www.zamstats.gov.zm <strong>May</strong>, <strong>2007</strong>Foreword<strong>Monthly</strong><strong>Central</strong> <strong>Statistical</strong> <strong>Office</strong>Welcome to the <strong>Monthly</strong> presentation organised by Dissemination Branch <strong>of</strong> the<strong>Central</strong> <strong>Statistical</strong> <strong>Office</strong> (CSO). <strong>The</strong> CSO embarks on vigorous information deliverystrategy to major stakeholders and the media institutions in order to increaseutilisation <strong>of</strong> statistical products and services. <strong>The</strong> <strong>of</strong>fice produces a number <strong>of</strong>statistical products in the Economic, Social, Agricultural and Environmental areas. <strong>The</strong>information collected in these areas may be used for various purposes includingpolicy formulation, planning, implementation, monitoring and evaluation <strong>of</strong>programmes and projects.This <strong>Monthly</strong> publication is an attempt to provide highlights <strong>of</strong> CSO’s work and howit can help media institutions and the general public to make use <strong>of</strong> data andinformation for sustainable national development and decision-making.I would like to urge our readers and users <strong>of</strong> statistical information to send to us anycomments that may enhance statistical production and contribute to theimprovement <strong>of</strong> this publication.Ms. Efreda ChuluActing Director <strong>of</strong> Census and Statistics31 st <strong>May</strong>, <strong>2007</strong>Food Basket<strong>The</strong> food basket as at <strong>May</strong><strong>2007</strong> was K710,031 for a family <strong>of</strong> six.<strong>The</strong> same family on average was expected to liveon K1,166,858 for all their food & basic needs.Inside this Issue• Another decline ininflation recordedin <strong>May</strong> <strong>2007</strong>• April <strong>2007</strong> RecordsTrade Surplus• 10 Percent <strong>of</strong> PaidChild LabourersContribute toHousehold Income• Child Labourers’Contribution toHousehold WelfareSignificant Revealsthe Child LabourSurvey• Dry Sex PracticedMore in RuralAreas• More MenPhysically Hurting<strong>The</strong>ir Spouses!!• Frequently AskedQuestions aboutthe EconomicCensus• Selected SocioeconomicIndicatorsServing YourData Needs<strong>Central</strong> <strong>Statistical</strong> <strong>Office</strong>, Nationalist Road, P.O. Box 31908, Lusaka ● Telefax: 260-1-253468 ● E-mail:info@zamstats.gov.zm
<strong>The</strong> <strong>Monthly</strong> – <strong>Vol</strong>ume <strong>50</strong>INFLATION<strong>Central</strong> <strong>Statistical</strong> <strong>Office</strong>Another decline in Inflation recorded in <strong>May</strong> <strong>2007</strong><strong>The</strong> annual rate <strong>of</strong> inflation, as measured by the allitems Consumer Price Index (CPI), was recorded at11.8 percent as at <strong>May</strong> <strong>2007</strong>. This rate is 0.6 <strong>of</strong> apercentage point lower than the April rate <strong>of</strong> 12.4percent. Compared with the same period last year,the annual rate <strong>of</strong> inflation increased by 3.2percentage points, from 8.6 percent in <strong>May</strong> 2006 to11.8 percent in <strong>May</strong> <strong>2007</strong>.<strong>The</strong> <strong>May</strong> <strong>2007</strong> inflation rate <strong>of</strong> 11.8 percent meansthat prices as measured by the all items ConsumerPrice Index (CPI) increased by an average <strong>of</strong> 11.8percent between <strong>May</strong> 2006 and <strong>May</strong> <strong>2007</strong>.Twelve Month Inflation Rate<strong>May</strong> 2006 - <strong>May</strong> <strong>2007</strong>(Percentage)14121086420<strong>May</strong>-06 Jun-06 Jul-06 Aug-06 Sept-06 Oct-06 Nov-06 Dec-06 Jan-07 Feb-07 Mar-07 Apr-07 <strong>May</strong>-07CompositeSource: Consumer Price Index (CPI), <strong>May</strong> <strong>2007</strong>Annual Inflation Rates for CPI Main GroupsBetween April <strong>2007</strong> and <strong>May</strong> <strong>2007</strong>, the annualinflation rates increased for food, beverages andtobacco, house rent and household energy anddeclined for clothing and footwear, furniture andhousehold goods, medical care, transport andcommunication, recreation and education, andother goods and services main groups.Annual Inflation Rate: CPI Main Groups (Per cent)Food Clothing Rent Furniture Transport Recreation OtherTotal And And Fuel and Medical and And GoodsBeverages Footwear & Household care comms Education AndLighting Goods ServicesJan 06 - Jan 05 12.2 12.8 15.6 20.4 18.2 10.2 -8.6 12.2 11.7Feb 06 – Feb 05 10.3 10.2 21.7 15.5 13.7 10.5 -9.9 12.7 11.6Mar 06 – Mar 05 10.7 10.9 23.0 17.2 12.4 11.5 -10.6 11.8 11.0April 06 - April 05 9.4 8.3 25.9 14.7 12.9 15.0 -10.9 11.7 13.9<strong>May</strong> 06 – <strong>May</strong> 05 8.6 5.6 29.2 14.1 14.7 16.9 -9.5 14.2 13.9Jun 06 – June 05 8.4 5.4 27.9 10.6 16.5 17.5 -6.5 12.0 13.7Jul 06 - July 05 8.7 4.3 29.2 12.2 16.3 17.4 -1.5 15.1 12.7Aug 06 – Aug 05 8.0 0.4 29.4 15.2 19.4 19.2 5.6 15.0 12.7Sep 06 – Sep 05 8.2 1.5 30.2 14.9 16.3 21.1 4.8 15.6 13.1Oct 06 – Oct 05 7.9 1.0 34.0 12.3 16.3 21.7 2.7 15.7 12.6Nov 06 – Nov 05 8.1 0.8 32.5 13.0 16.7 23.2 6.8 15.4 11.9Dec 06 – Dec 05 8.2 -0.2 33.4 13.0 17.3 25.1 15.2 15.5 11.1Jan 07 – Jan 06 9.8 1.0 34.9 15.1 16.5 24.9 22.8 15.9 11.4Feb 07 – Feb 06 12.6 4.2 28.3 18.3 20.4 23.7 33.9 15.0 10.4Mar 07 – Mar 06 12.7 4.9 26.9 15.8 21.6 22.1 33.5 14.9 11.0Apr 07 – Apr 06 12.4 5.5 23.7 15.7 20.0 18.8 32.4 14.8 7.7<strong>May</strong> 07 – <strong>May</strong> 06 11.8 5.7 18.8 17.1 19.2 16.5 28.2 10.4 7.02
<strong>The</strong> <strong>Monthly</strong> – <strong>Vol</strong>ume <strong>50</strong><strong>Central</strong> <strong>Statistical</strong> <strong>Office</strong>Contributions <strong>of</strong> different Items to overall inflation<strong>The</strong> decline <strong>of</strong> 0.6 <strong>of</strong> a percentage point in theannual inflation rate from 12.4 percent in April <strong>2007</strong>to 11.8 percent in <strong>May</strong> <strong>2007</strong> is mainly due to thedecline in the cost <strong>of</strong> non-food products.Of the total 11.8 percent annual inflation in <strong>May</strong><strong>2007</strong>, food products accounted for 2.9 percentagepoints while non-food products in the ConsumerPrice Index (CPI) accounted for a total <strong>of</strong> 8.9percentage points.ItemsPercentage Points Contributions <strong>of</strong> different items to overall inflationFood Beverages andTobaccoJun-06Jul-06Aug-06Sep-06Oct-06Nov-062.9 2.2 0.2 0.8 0.5 0.4 -0.1 0.5 2.2 2.6 2.9 2.9Clothing and Footwear 2.1 2.2 2.2 2.2 2.6 2.5 2.5 2.7 2.3 2.3 2.0 1.8Rent and householdenergyFurniture andHousehold Goods1.1 1.3 1.6 1.6 1.3 1.4 1.4 1.6 2.0 1.7 1.7 1.91.6 1.6 1.9 1.6 1.6 1.6 1.7 1.7 2.0 2.1 2.0 2.0Medical Care 0.1 0.1 0.2 0.2 0.2 0.2 0.2 0.2 0.2 0.2 0.2 0.1Transport (fuel, airfares,new motor vehicles)Recreation andEducationOther Goods andServices-0.6 -0.1 0.5 0.4 0.3 0.6 1.2 1.7 2.6 2.5 2.4 2.20.8 1.0 1.0 1.0 1.0 1.0 1.0 1.1 1.0 1.0 1.0 0.70.4 0.4 0.4 0.4 0.4 0.4 0.3 0.3 0.3 0.3 0.2 0.2All Items 8.5 8.7 8.0 8.2 7.9 8.1 8.2 9.8 12.6 12.7 12.4 11.8Dec-06Jan-07Feb-07Mar-07Apr-07<strong>May</strong>-07Food inflation<strong>The</strong> monthly change in the food CPI was recorded at–1.3 percent at <strong>May</strong> <strong>2007</strong>. Contributing most to thisdecline were decreases in the cost <strong>of</strong> Maize grain,maize meal, vegetables, fish, kapenta, beans, shelledgroundnuts, sweet potatoes, eggs, milk and milkproducts. Partially <strong>of</strong>fsetting these reductions wereincreases in the cost <strong>of</strong> meat, other cereals andcereal products, oils and fats, s<strong>of</strong>t drinks and otherprocessed food products.<strong>The</strong> annual change in the food CPI was registered at5.7 percent at <strong>May</strong> <strong>2007</strong> compared with 5.5 percentin April <strong>2007</strong>.Non-food inflation<strong>The</strong> monthly change in the non-food CPI wasrecorded at 0.8 percent at <strong>May</strong> <strong>2007</strong>, comparedwith 0.4 percent in April <strong>2007</strong>. <strong>The</strong> annual changein the non-food CPI was recorded at 18.2 percent at<strong>May</strong> <strong>2007</strong> compared with 20.1 percent in April<strong>2007</strong>. <strong>The</strong> decline in the annual non-food inflationrate was due to the decrease in the annual inflationrates for clothing and footwear, furniture andhousehold goods, medical care, transport andcommunication, recreation and education, andother goods and services main groups.3
<strong>The</strong> <strong>Monthly</strong> – <strong>Vol</strong>ume <strong>50</strong><strong>Central</strong> <strong>Statistical</strong> <strong>Office</strong>Month on Month Inflation Rates Food and Non-Food (Pecent)Period Total Food Non-FoodJan 06 - Dec 05 -0.1 -0.5 0.5Feb 06 – Jan 06 -0.2 -1.0 0.8Mar 06 – Feb 06 0.8 0.6 0.9Apr 06 – Mar 06 0.2 -1.1 0.5<strong>May</strong> 06 – Apr 06 0.4 -1.4 2.4Jun 06 – <strong>May</strong> 06 0.8 0.1 1.5Jul 06 – Jun 06 0.3 -1.1 1.8Aug 06 – Jul 06 0.8 -1.5 3.0Sep 06 – Aug 06 1.6 1.9 1.4Oct 06 – Sep 06 0.7 0.7 0.7Nov 06 – Oct 06 1.5 1.9 1.2Dec 06 – Nov 06 1.2 1.3 1.0Jan 07 – Dec 06 1.4 0.7 2.1Feb 07 – Jan 07 2.3 2.0 2.6Mar 07 – Feb 07 0.8 1.3 0.4Apr 07 – Mar 07 -0.1 -0.5 0.4<strong>May</strong> 07 – Apr 07 -0.2 -1.3 0.8Annual Inflation Rates: Food and Non foodPeriod Total Food Non-FoodJan 06 – Jan 05 12.2 12.8 11.5Feb 06 - Feb 05 10.3 10.2 10.3Mar 06 - Mar 05 10.7 10.9 10.4Apr 06 – Apr 05 9.4 8.3 10.6<strong>May</strong> 06 – <strong>May</strong> 05 8.6 5.6 12.0Jun 06 - Jun 05 8.5 5.4 11.8Jul 06 - Jul 05 8.7 4.3 13.6Aug 06 – Aug 05 8.0 0.4 16,4Sep 06 – Sep 05 8.2 1.5 15.7Oct 06 - Oct 05 7.9 1.0 15.4Nov 06 - Nov 05 8.1 0.8 16.2Dec06 – Dec 05 8.2 -0.2 18.1Jan 07 - Jan 06 9.8 1.0 20.0Feb 07 - Feb 06 12.6 4.2 22.1Mar 07 - Mar 06 12.7 4.9 21.5Apr 07 – Apr 06 12.4 5.5 20.1<strong>May</strong> 07 – <strong>May</strong> 06 11.8 5.7 18.2Maize grain prices continue to declineA comparison <strong>of</strong> retail prices between April <strong>2007</strong>and <strong>May</strong> <strong>2007</strong>, shows that the national averageprice <strong>of</strong> a 25 kg bag <strong>of</strong> roller meal declined by 3.0percent, from K27,934 to K27,101. <strong>The</strong> nationalaverage price <strong>of</strong> a 20 litre tin <strong>of</strong> maize grain declinedby 14.0 percent, from K14,640 to K12,595. <strong>The</strong>national average price <strong>of</strong> 1kg <strong>of</strong> dried fish (bream)declined by 11.3 percent, while the national averageprice <strong>of</strong> 1kg <strong>of</strong> tomatoes declined by 15.5 percent.4
<strong>The</strong> <strong>Monthly</strong> – <strong>Vol</strong>ume <strong>50</strong><strong>Central</strong> <strong>Statistical</strong> <strong>Office</strong>National Average prices for selected Products and MonthsProduct Description<strong>2007</strong>PercentageChangeJanuary February March March April <strong>May</strong> <strong>May</strong>/-07Apr-07White breakfast Meal 25Kg 36,335 37,108 37,381 37,381 37,733 37,446 -0.8White Roller Meal 25Kg 26,636 28,045 27,893 27,893 27,934 27,101 -3.0Samp 1 Kg 3,400 3,763 3,953 3,953 3,449 3,377 -2.1White Maize 20 litre tin 14,339 14,927 14,952 14,952 14,640 12,595 -14.0Rice Local 1 Kg 3,624 3,741 3,645 3,645 3,667 3,830 4.4Rice Imported 1 Kg 11,426 11,688 11,408 11,408 11,180 11,246 0.6Bread Regular loaf 2,729 2,689 2,733 2,733 2,744 2,725 -0.7Sorghum 5 litre tin 4,114 6,087 6,839 6,839 6,401 5,598 -12.5Fillet Steak 1 Kg 21,847 21,356 20,828 20,828 21,528 22,262 3.4Rump Steak 1 Kg 19,464 18,828 18,775 18,775 19,412 19,648 1.2Brisket 1 Kg 14,967 14,512 14,963 14,963 14,837 14,921 0.6Mince Meat 1 Kg 17,302 16,925 16,564 16,564 17,744 17,115 -3.5Mixed Cut 1 Kg 13,874 13,697 13,742 13,742 14,004 13,982 -0.2T-bone 1 Kg 17,543 17,325 17,290 17,290 17,825 18,349 2.9Beef Sausages 1 Kg 18,118 18,577 18,5<strong>50</strong> 18,5<strong>50</strong> 19,328 18,123 -6.2Ox-liver 1 Kg 16,048 15,596 15,854 15,854 15,691 15,811 0.8Offals 1 Kg 8,787 8,632 8,594 8,594 8,674 8,762 1.0Pork chops 1 Kg 18,938 19,006 19,663 19,663 19,643 18,978 -3.4Pork Sausages 1 Kg 19,237 19,391 19,578 19,578 19,462 19,521 0.3Dressed chicken 1 Kg 12,477 13,027 12,958 12,958 13,605 14,012 3.0Mutton 1 Kg 23,670 21,136 24,178 24,178 24,413 24,779 1.5Bream Fresh/Frozen 1 Kg 11,511 12,660 13,141 13,141 12,626 12,293 -2.6Dried Kapenta Mpulungu 1 Kg 32,056 34,210 36,197 36,197 35,745 35,131 -1.7Dried Kapenta Siavonga 1 Kg 29,125 32,525 32,902 32,902 32,652 31,957 -2.1Dried Kapenta Chisense 1 Kg 17,097 21,899 21,565 21,565 19,228 18,841 -2.0Dried bream 1 Kg 21,843 25,717 25,348 25,348 24,049 21,323 -11.3Eggs 1 Unit 5,773 5,927 5,974 5,974 5,980 5,854 -2.1Cooking oil Imported Any 7<strong>50</strong>mls 5,606 5,810 5,939 5,939 5,862 5,833 -0.5Cabbage 1kg 1,317 1,380 1,390 1,390 1,312 1,159 -11.7Onion 1kg 3,700 3,967 4,439 4,439 4,981 5,042 1.2Carrots 1kg 4,216 4,572 6,815 6,815 6,564 4,426 -32.6Tomatoes 1kg 2,566 2,940 3,364 3,364 2,879 2,432 -15.5Rape 1kg 1,864 2,034 1,889 1,889 1,769 1,666 -5.8Dried beans 1kg 6,062 6,002 6,123 6,123 5,858 5,663 -3.3Shelled groundnut 1kg 5,915 6,122 6,111 6,111 5,632 5,617 -0.3Sweet potatoes 1kg 1,560 1,408 1,328 1,328 1,055 904 -14.3Irish potatoes 1kg 2,842 2,900 2,858 2,858 2,606 2,545 -2.3Coke/Sprite/Fanta 300 mls 1,777 1,772 1,779 1,779 1,780 1,792 0.7Cement Portland <strong>50</strong> Kg 46,544 45,714 45,678 45,678 49,465 53,353 7.9Concrete Block 4 inch 2,341 2,284 2,799 2,799 2,897 3,030 4.6Paraffin 1 litre 4,253 4,658 4,491 4,491 4,475 4,696 4.9Petrol Premium 1 litre 5,820 6,4<strong>50</strong> 6,290 6,290 6,355 6,813 7.2Diesel 1 litre 5,351 5,715 5,579 5,579 5,657 5,965 5.4Air fare Lusaka/London British Airways 1 Way 4,217,420 42,46,640 4,266,120 4,266,120 4,168,720 4,131,720 -0.9Air Fare Lusaka/Ndola <strong>Zambia</strong>n Airways 1 way 614,860 619,120 621,960 621,960 607,760 587,880 -3.3Bed & continental Breakfast 3 to 5 star hotel 710,330 707,947 725,053 725,053 723,215 732,678 1.3Bed & Continental Breakfast 2 Star down to Motel 104,937 105,025 106,220 106,220 109,199 113,649 4.1Nshima with Beef relish Restaurants 7,943 8,015 8,045 8,045 8,044 8,183 1.75
<strong>The</strong> <strong>Monthly</strong> – <strong>Vol</strong>ume <strong>50</strong><strong>Central</strong> <strong>Statistical</strong> <strong>Office</strong>INTERNATIONAL MERCHANDIZE TRADEApril <strong>2007</strong> Records Trade Surplus!During the month <strong>of</strong> April <strong>2007</strong>, <strong>Zambia</strong> recorded aTrade Surplus valued at K279.0 billion. This meansthat the country exported more in April than itimported in value terms. Trade surpluses were alsorecorded in the months <strong>of</strong> February and March<strong>2007</strong>.MonthsTotal Exports, Imports & Trade Balance, January to April <strong>2007</strong>*, (K’ Millions)ImportsDomesticRe-ExportsTotal Exports(cif)Exports (fob)(fob)(fob)TradeBalanceJanuary 1,371,274 1,346,142 748 1,346,891 (24,383)February 971,732 1,022,122 117 1,022,238 <strong>50</strong>,<strong>50</strong>7March 1,162,999 1,300,675 807 1,301,482 138,484April 1,104,149 1,383,113 51 1,383,164 279,015TOTAL: 4,610,153 5,052,052 1,723 5,053,775 443,622Source: CSO, International Trade Statistics, <strong>2007</strong>,Note: (*) Preliminary and subject to revision up on receipt <strong>of</strong> additional data from customs and non-customs sources.Exports classified by Standard International Trade Classification(SITC) March and April <strong>2007</strong>*<strong>The</strong> total value <strong>of</strong> exports in April <strong>2007</strong> wasK1,383.2 billion compared to K1,301.5 billion inMarch <strong>2007</strong>. <strong>The</strong> most prominent exports weremanufactured goods classified chiefly by materialaccounting for 83.9 percent in April <strong>2007</strong> and 80.9percent in March <strong>2007</strong> <strong>of</strong> which refined copper wasthe most significant export item. Other importantexports were crude materials (excluding fuels) suchas copper ores and concentrates, cobalt ores andconcentrates, sulphur, cotton and salt, whichaccounted for 5.7 and 7.5 percent in April andMarch <strong>2007</strong> respectively.CODE DESCRIPTIONTotal Exports by (SITC) sections, March and April <strong>2007</strong>*, K’ MillionsMarch <strong>2007</strong> April <strong>2007</strong>Value (K'Million) % Share Value (K'Million) % Share0 Food and live animals 97,652 7.5 77,298 5.61 Beverages and tobacco 9,119 0.7 22,481 1.62 Crude materials, (excl fuels) 97,305 7.5 78,971 5.73 Mineral fuels, lubricants and related materials 4,629 0.4 4,443 0.34 Animal and vegetable oils, fats and waxes 554 0.0 193 0.05 Chemicals 6,760 0.5 6,221 0.46 Manufactured goods classified chiefly by material 1,053,003 80.9 1,160,696 83.9<strong>of</strong> Which:Refined copper 493,047 46.8 498,609 43.0Plates, sheets and strip, <strong>of</strong> refined copper, >0.15mm thick 349,892 33.2 390,970 33.7Cobalt, wrought, and articles <strong>of</strong> cobalt, nes 75,434 7.2 94,216 8.1Unrefined copper; copper anodes for electrolytic refining 42,878 4.1 53,084 4.6Wire <strong>of</strong> refined copper 42,619 4.0 52,419 4.5Copper powders and flakes 14,324 1.4 44,231 3.8Bed linen, not knitted nor crocheted, <strong>of</strong> cotton 9,584 0.9 3 0.0Precious (excl. diamonds) or semi-precious stones, unworked 7,696 0.7 2,893 0.2Cotton yarn (excl. sewing thread), with >=85% cotton, for retail sale 3,724 0.4 3,813 0.3Precious or semi-precious stones, worked but not set..., nes 1,786 0.2 10,137 0.9Portland cement 1,6<strong>50</strong> 0.2 1,787 0.2Other manufactured goods classified chiefly by material 10,370 1.0 8,534 0.77 Machinery and transport equipment 28,626 2.2 30,291 2.28 Miscellaneous manufactured articles 3,836 0.3 2,570 0.29 Commodities and transactions not classified elsewhere in the SITC 0 0.0 1 0.0TOTAL: 1,301,482 100.0 1,383,164 100.0Source: CSO, International Trade Statistics, <strong>2007</strong>; Note: (*) Provisional6
<strong>The</strong> <strong>Monthly</strong> – <strong>Vol</strong>ume <strong>50</strong><strong>Central</strong> <strong>Statistical</strong> <strong>Office</strong><strong>Zambia</strong>’s Major Exports Classified by Harmonized Coding System(HS), April <strong>2007</strong>*<strong>Zambia</strong>’s major export product in April <strong>2007</strong> wascopper and articles there<strong>of</strong> accounting for 75.3percent <strong>of</strong> <strong>Zambia</strong>’s total export earnings. Otherexport products worth noting, though on a smallerscale were: other base metals - such as cobalt whichare copper related (6.8 percent); ores, slags and ash(3.5 percent); and Cereals (2.9 percent). <strong>The</strong>se fourproduct categories accounted for 88.5 percent <strong>of</strong><strong>Zambia</strong>’s total export earnings.<strong>Zambia</strong>’s Major Exports by HS Chapter for April <strong>2007</strong>*, K’ MillionsChapter Code Description Value (K'Million) % Share74 Copper and articles there<strong>of</strong> 1,040,925 75.381 Other base metals; cermets; articles there<strong>of</strong> 94,216 6.826 Ores, slag and ash 47,992 3.510 Cereals 39,620 2.985 Electrical machinery equip parts there<strong>of</strong>; sound recorder etc 22,932 1.724 Tobacco and manufactured tobacco substitutes 21,845 1.652 Cotton 17,968 1.317 Sugars and sugar confectionery 17,435 1.371 Natural/cultured pearls, precious stones & metals, coin etc 13,030 0.906 Live tree & other plant; bulb, root; cut flowers etc 7,264 0.<strong>50</strong>7 Edible vegetables and certain roots and tubers 6,898 0.511 Products <strong>of</strong> milling industry; malt; starches; insulin; wheat gluten 6,217 0.4Other products 46,821 3.4Total: 1,383,164 100.0Source: CSO, International Trade Statistics, <strong>2007</strong>; Note: (*) Provisional<strong>Zambia</strong>’s Major Export Destinations in April <strong>2007</strong>*<strong>The</strong> four major destinations <strong>of</strong> <strong>Zambia</strong>’s exportsduring the month <strong>of</strong> April <strong>2007</strong> were the UnitedKingdom (27.9 percent), South Africa (25.4 percent),Switzerland (24.7 percent) and Tanzania (6.4percent) and these four countries collectivelyaccounted for 84.4 percent <strong>of</strong> <strong>Zambia</strong>’s totalexports. However, it should be noted that most <strong>of</strong>the export products to these countries are copper -related products and that these countries are mainlytrans-shipment points to other final destinations. <strong>The</strong>rest <strong>of</strong> the outlets for <strong>Zambia</strong>’s exports collectivelyaccounted for 15.6 percent <strong>of</strong> <strong>Zambia</strong>’s total value<strong>of</strong> exports in April <strong>2007</strong>.<strong>Zambia</strong>’s Major Export Destinations by Country, April <strong>2007</strong>*, K’ MillionsCOUNTRY Value (K'Million) % ShareUnited Kingdom 386,483 27.9South Africa 351,067 25.4Switzerland 341,026 24.7Tanzania 89,044 6.4Congo (DR) 41,280 3.0Zimbabwe 35,131 2.5Belgium 22,235 1.6Malawi 21,770 1.6United States <strong>of</strong> America 14,100 1.0India 13,552 1.0China 13,168 1.0Rest <strong>of</strong> the world 54,308 3.9TOTAL: 1,383,164 100.0Source: CSO, International Trade Statistics, <strong>2007</strong>; Note: (*) ProvisionalExport Market Shares by Regional Groupings<strong>The</strong> Southern African Development Communitygrouping <strong>of</strong> countries (SADC) was the largest marketfor <strong>Zambia</strong>’s exports accounting for 38 percent and36.8 percent <strong>of</strong> <strong>Zambia</strong>’s total exports in April andMarch <strong>2007</strong>, respectively. Within the SADC region,South Africa was the major market for <strong>Zambia</strong>’sexports accounting for 66.9 percent in April and62.3 percent in March <strong>2007</strong>.7
<strong>The</strong> <strong>Monthly</strong> – <strong>Vol</strong>ume <strong>50</strong><strong>The</strong> European Union (EU) was the second largestdestination <strong>of</strong> <strong>Zambia</strong>’s exports accounting for 31.1and 31.4 percent in April and March <strong>2007</strong>,respectively. Within the EU, the dominant marketwas the United Kingdom with market shares <strong>of</strong> 89.9and 88.1 percent in the respective months. Otherkey markets were Netherlands, Belgium, and France.<strong>The</strong> Common Market for Eastern and SouthernAfrica region (COMESA) was the third largestdestination <strong>of</strong> <strong>Zambia</strong>’s exports accounting for 7.9percent in April and 9.3 percent in March <strong>2007</strong>.Within COMESA, Congo (DR) and Zimbabwe werethe key destinations jointly accounting for 70.0<strong>Central</strong> <strong>Statistical</strong> <strong>Office</strong>percent in April and 86.9 percent in March <strong>2007</strong>.This was followed by Malawi and Kenya jointly with25.3 and 12.3 percent in April and March <strong>2007</strong>respectively.<strong>The</strong> Asian regional grouping was fourth accountingfor 3.1 and 4.2 percent <strong>of</strong> <strong>Zambia</strong>’s total exports inApril and March <strong>2007</strong> respectively. Within the Asianmarket, China, Japan and India dominatedcollectively accounting for 86.6 and 71.3 percent inApril and March <strong>2007</strong> respectively. Otherdestinations in March and April <strong>2007</strong> includedTaiwan, and Hong Kong.Export Market Shares by Regional Groupings, March and April <strong>2007</strong>*, (K’Millions)GROUPINGMARCH, <strong>2007</strong> APRIL, <strong>2007</strong>GROUPINGValue (K'Million) % ShareValue (K'Million) % ShareSADC 479,372 100 SADC 525,024 100South Africa 298,466 62.3 South Africa 351,067 66.9Tanzania, United 66,036 13.8 Tanzania, United 89,044 17.0Zimbabwe 53,122 11.1 Congo (DR) 41,280 7.9Congo (DR) 52,084 10.9 Zimbabwe 35,131 6.7Other SADC 9,663 2.00 Other SADC 8,<strong>50</strong>3 1.6% <strong>of</strong> Total March Exports: 36.8 % <strong>of</strong> Total April Exports: 38.0EUROPEAN UNION 408,090 100 EUROPEAN UNION 430,008 100United Kingdom 359,461 88.1 United Kingdom 386,483 89.9Netherlands 20,913 5.1 Belgium 22,235 5.2Belgium 14,703 3.6 Netherlands 12,862 3France 7,940 1.9 Portugal 3,405 0.8Other EU 5,073 1.2 Other EU 5,023 1.2% <strong>of</strong> Total March Exports: 31.4 % <strong>of</strong> Total April Exports: 31.1COMESA 121,081 100 COMESA 109,148 100Zimbabwe 53,122 43.9 CONGO (DR) 41,280 37.8Congo (DR) 52,084 43 Zimbabwe 35,131 32.2Malawi 10,100 8.3 Malawi 21,770 19.9Kenya 4,796 4 Kenya 5,8<strong>50</strong> 5.4Uganda 869 0.7 Swaziland 4,254 3.9Other COMESA 110 0.1 Other COMESA 862 0.8% <strong>of</strong> Total March Exports: 9.3 % <strong>of</strong> Total April Exports: 7.9ASIA 54,408 100 ASIA 42,909 100China 15,114 27.8 India 13,552 31.6Japan 14,622 26.9 China 13,168 30.7Taiwan 9,335 17.2 Japan 10,410 24.3India 9,046 16.6 Hong Kong 3,195 7.4Hong Kong 4,627 8.5 Singapore 1,912 4.5Other ASIA 1,665 3.1 Other ASIA 671 1.6% <strong>of</strong> Total March Exports: 4.2 % <strong>of</strong> Total April Exports: 3.1Total value <strong>of</strong> March Exports (fob) 1,301,482 Total value <strong>of</strong> April Exports (fob 1,383,164Source: CSO, International Trade Statistics, <strong>2007</strong>; Note: (*) ProvisionalImports classified by Standard International Trade Classification(SITC) for March and April <strong>2007</strong>*<strong>The</strong> total value <strong>of</strong> imports in April <strong>2007</strong> wasK1,104.1 billion compared to K1,163.0 billion inMarch <strong>2007</strong>. <strong>The</strong> most prominent imports weremachinery and transport equipment, whichaccounted for 43.4 and 37.8 percent in April andMarch <strong>2007</strong>, respectively. Other important importswere manufactured goods classified chiefly bymaterial, mineral fuels, lubricants and relatedmaterials and, chemicals; which collectivelyaccounted for 43.3 and 48.8 percent in April andMarch <strong>2007</strong> respectively.8
<strong>The</strong> <strong>Monthly</strong> – <strong>Vol</strong>ume <strong>50</strong><strong>Central</strong> <strong>Statistical</strong> <strong>Office</strong>Total Imports by Standard International Trade Classification (SITC) sections, March and April <strong>2007</strong>*, K ’MillionsCODE DESCRIPTIONMarch <strong>2007</strong> April <strong>2007</strong>Value (K'Million) % Share Value (K'Million) % Share0 Food and live animals 34,407 3.0 34,904 3.21 Beverages and tobacco 3,530 0.3 4,567 0.42 Crude materials, (excl fuels) 39,316 3.4 46,155 4.23 Mineral fuels, lubricants and related materials 187,527 16.1 156,061 14.14 Animal and vegetable oils, fats and waxes 17,291 1.5 13,826 1.35 Chemicals 168,201 14.5 154,386 14.06 Manufactured goods classified chiefly by material 211,154 18.2 168,016 15.27 Machinery and transport equipment 439,800 37.8 479,254 43.48 Miscellaneous manufactured articles 56,384 4.8 46,522 4.29 Commodities and transactions not classified elsewhere in the SITC 5,388 0.5 456 0.0TOTAL: 1,162,999 100.0 1,104,149 100.0Source: CSO, International Trade Statistics, <strong>2007</strong>; Note: (*) Provisional<strong>Zambia</strong>’s Major Imports by Harmonised coding System (HS) in April<strong>2007</strong><strong>Zambia</strong>’s major import products in April <strong>2007</strong> were accounted for 57.0 percent <strong>of</strong> the total value <strong>of</strong>boilers, machinery and mechanical appliances: imports for the month. Other important importMineral fuels, oils and products <strong>of</strong> their distillation; products were fertilizers, articles <strong>of</strong> iron and steel;electrical machinery equipment parts there<strong>of</strong>; and and iron and steel, accounting for 13.0 percent inVehicles. <strong>The</strong>se four product categories collectively April <strong>2007</strong>.<strong>Zambia</strong>’s Major Imports by HS Chapters for April <strong>2007</strong>*, K’ MillionsCHAPTERCODEDESCRIPTION Value (K'Million) % Share84 Nuclear Reactors, Boilers, Machinery & Mechanical Appliance; Parts 252,249 22.8Parts <strong>of</strong> machinery <strong>of</strong> 84.74 34,568 13.7Parts <strong>of</strong> machinery <strong>of</strong> 84.26, 84.29 and 84.30, nes 29,741 11.8Crushing or grinding machines for earth, stone, ores, etc 24,785 9.8Self-propelled front-end shovel loaders 19,990 7.9Parts <strong>of</strong> furnace burners for liquid/solid/gas fuel; mechanical grates... 6,933 2.7Lifting, handling, loading or unloading machinery, 5,074 2.0Pumps for liquids, nes 4,790 1.9Mixing or kneading machines for earth, stone, ores, etc 4,164 1.7Other products under Chapter 84 122,206 48.427 Mineral Fuels, Oils & Product Of <strong>The</strong>ir Distillation; Etc 156,219 14.185 Electrical Machinery Equip Parts <strong>The</strong>re<strong>of</strong>; Sound Recorder etc 128,057 11.687 Vehicles O/T Railway/Tramway Roll-Stock, Pts & Accessories 93,235 8.431 Fertilisers 56,329 5.173 Articles Of Iron And Steel <strong>50</strong>,249 4.672 Iron And Steel 37,100 3.439 Plastics And Articles <strong>The</strong>re<strong>of</strong> 30,886 2.840 Rubber And Articles <strong>The</strong>re<strong>of</strong> 25,456 2.326 Ores, Slag And Ash 23,056 2.125 Salt; Sulphur; Earth & Stone; Plastering Mat; Lime & Cement 20,001 1.838 Miscellaneous Chemical Products 17,896 1.630 Pharmaceutical Products 17,218 1.615 Animal/Vegetable Fats & Oil & <strong>The</strong>ir Cleavage Products; Etc 16,642 1.5Rest <strong>of</strong> Products 179,555 16.3Total: 1,104,149 100.0Source: CSO, International Trade Statistics, <strong>2007</strong>; Note: (*) Provisional9
<strong>The</strong> <strong>Monthly</strong> – <strong>Vol</strong>ume <strong>50</strong><strong>Central</strong> <strong>Statistical</strong> <strong>Office</strong><strong>Zambia</strong>’s Major Import Sources by Partner Country, April <strong>2007</strong><strong>The</strong> major source <strong>of</strong> <strong>Zambia</strong>’s imports in April <strong>2007</strong>was South Africa accounting for 45.2 percent <strong>of</strong> thetotal value <strong>of</strong> imports for the month. <strong>The</strong> majorimport products from South Africa were: parts <strong>of</strong>machinery; potassium chloride; parts andaccessories for vehicles; sulphuric acid-oleum inbulk; structures and parts <strong>of</strong> structures; vehicles; andgas oils (diesel).<strong>The</strong> second main source <strong>of</strong> <strong>Zambia</strong>’s imports wasthe United Arab Emirates (UAE) accounting for 12.7percent in April <strong>2007</strong>. <strong>The</strong> major import productsfrom the UAE were: crude petroleum oils and oilsobtained from bituminous minerals and sulphur <strong>of</strong>all kinds –excluding sublimed/precipitated sulphur.India was third with 5.1 percent and suppliedmainly transformer circuit breaking and insulatingoil; medicaments <strong>of</strong> mixed/unmixed products; andstructures/parts <strong>of</strong> structures. Other notable sources<strong>of</strong> <strong>Zambia</strong>’s imports were Germany, Finland, China,United Kingdom, Zimbabwe, Congo (DR) and Kenyacollectively accounting for 21.9 percent <strong>of</strong> <strong>Zambia</strong>’stotal imports in April <strong>2007</strong>.<strong>Zambia</strong>’s Major Import Sources by Partner Country, April <strong>2007</strong>, K’Millions,COUNTRY Value (K'Million) % ShareSouth Africa 498,5<strong>50</strong> 45.2United Arab Emirates 140,208 12.7India 56,165 5.1Germany 49,7<strong>50</strong> 4.5Finland 49,360 4.5China 42,147 3.8United Kingdom 31,177 2.8Zimbabwe 24,088 2.2Zaire (Dr Congo) 24,008 2.2Kenya 21,663 2.0United States Of America 19,728 1.8Japan 14,005 1.3Sweden 12,956 1.2Netherlands 12,405 1.1Denmark 11,427 1.0Other 96,511 8.7TOTAL: 1,104,149 100.0Source: CSO, International Trade Statistics, <strong>2007</strong>; Note: (*) ProvisionalImport Market Shares by Regional Groupings<strong>The</strong> Southern African Development Community(SADC) grouping <strong>of</strong> countries was the largest source<strong>of</strong> <strong>Zambia</strong>’s imports accounting for 51.1 and 53.8percent in April and March <strong>2007</strong> respectively.Within the SADC region, South Africa was the majorsource for <strong>Zambia</strong>’s imports accounting for 88.4percent in April and 85.5 percent in March <strong>2007</strong>.<strong>The</strong> Asian market was the second largest source <strong>of</strong><strong>Zambia</strong>’s imports accounting for 25.5 and 24.4percent in April and March <strong>2007</strong> respectively.Within the Asian market, the United Arab Emiratesdominated accounting for 49.8 percent in April and56 percent in March <strong>2007</strong>, while India and Chinawere second and third respectively in April <strong>2007</strong>with 19.9 and 15 percent. In March <strong>2007</strong>, India andChina accounted for 15.4 and 14.2 percentrespectively.the EU, the dominant source during the month <strong>of</strong>April <strong>2007</strong> was Germany with 26.1 percent followedby Finland with 25.9. In March <strong>2007</strong>, the UnitedKingdom was the dominant source with 29.6percent followed by Germany with 17.4 percent.Other key markets were Sweden, Denmark andNetherlands.<strong>The</strong> Common Market for Eastern and SouthernAfrica region (COMESA) was the fourth largestsource accounting for 7.2 percent in April <strong>2007</strong> and8.1 percent in March <strong>2007</strong>. Within COMESA,Zimbabwe was the main source accounting for 30.3and 35.1 percent in April and March <strong>2007</strong>respectively, followed by Kenya with 27.9 percent inMarch <strong>2007</strong>and Congo (DR) with 30.2 percent inApril <strong>2007</strong>. Other notable sources were Egypt,Malawi and Mauritius.<strong>The</strong> European Union (EU) was the third largestsource <strong>of</strong> <strong>Zambia</strong>’s imports with 17.3 percent inApril <strong>2007</strong> and 14.5 percent in March <strong>2007</strong>. Within10
<strong>The</strong> <strong>Monthly</strong> – <strong>Vol</strong>ume <strong>50</strong><strong>Central</strong> <strong>Statistical</strong> <strong>Office</strong>Import Market shares by major Regional groupings, March and April <strong>2007</strong>*GROUPINGMARCH, <strong>2007</strong> GROUPINGAPRIL, <strong>2007</strong>Value (K'Million)% ShareValue (K'Million)SADC 626,162 100 SADC 564,215 100South Africa 535,628 85.5 South Africa 498,5<strong>50</strong> 88.4Zimbabwe 33,100 5.3 Zimbabwe 24,088 4.3Congo (DR) 24,383 3.9 Congo (DR) 24,008 4.3Botswana 9,100 1.5 Mauritius 4,494 0.8Other SADC 23,951 3.8 Other SADC 13,075 2.3% <strong>of</strong> Total March Imports: 53.8 % <strong>of</strong> Total April Imports: 51.1ASIA 284,040 100 ASIA 281,769 100United Arab Emirates 159,113 56 United Arab Emirates 140,208 49.8India 43,752 15.4 India 56,165 19.9China 40,296 14.2 China 42,147 15Japan 14,651 5.2 Japan 14,005 5Korea, Republic Of 6,949 2.4 Indonesia 8,420 3Other ASIA 19,279 6.8 Other ASIA 20,824 7.4% <strong>of</strong> Total March Imports: 24.4 % <strong>of</strong> Total April Imports: 25.5EUROPEAN UNION 168,192 100 EUROPEAN UNION 190,638 100United Kingdom 49,795 29.6 Germany 49,7<strong>50</strong> 26.1Germany 29,228 17.4 Finland 49,360 25.9Netherlands 19,308 11.5 United Kingdom 31,177 16.4Sweden 17,770 10.6 Sweden 12,956 6.8Denmark 11,175 6.6 Netherlands 12,405 6.5Finland 8,158 4.9 Denmark 11,427 6Other EU 32,757 19.5 Other EU 23,562 12.4% <strong>of</strong> Total March Imports: 14.5 % <strong>of</strong> Total April Imports: 17.3COMESA 94,226 100 COMESA 79,591 100Zimbabwe 33,100 35.1 Zimbabwe 24,088 30.3% ShareKenya 26,2<strong>50</strong> 27.9 Congo (DR) 24,008 30..2Congo (DR) 24,383 25.9 Kenya 21,663 27.2Egypt 3,008 3.2 Mauritius 4,494 5.6Malawi 2,798 3 Malawi 2,234 2.8Other COMESA 4,687 5 Other COMESA 3,104 3.9% <strong>of</strong> Total March Imports: 8.1 % <strong>of</strong> Total April Imports: 7.2Total value <strong>of</strong> March Imports (cif) 1,162,999 Total value <strong>of</strong> April Imports (cif) 1,104,149Source: CSO, International Trade Statistics, <strong>2007</strong>;Note: (*) ProvisionalNote: Some countries are members <strong>of</strong> both SADC and COMESA11
<strong>The</strong> <strong>Monthly</strong> – <strong>Vol</strong>ume <strong>50</strong>CHILD LABOUR<strong>Central</strong> <strong>Statistical</strong> <strong>Office</strong>10 Percent <strong>of</strong> Paid Child Labourers Contribute toHousehold Income<strong>The</strong> 2005 Child Labour Module <strong>of</strong> the Labour ForceSurvey results show that out <strong>of</strong> an estimated241,648 paid child labourers, 25,268 (10 percent)contribute to the total household income. <strong>The</strong>results also show that more boys (54 percent)contribute to household income than girls (46percent).Contribution <strong>of</strong> Children to Household Income by Sex, 2005Contribution Boys Percent Girls Percent Number <strong>of</strong>paid childrenTotal 133,226 55 108,422 45 241,648Contributes to Household Income 13,595 54 11,673 46 25,268Source: 2005 Child Labour ReportAnalysis by residence indicates a higher proportion<strong>of</strong> paid child labourers who contribute to the totalhousehold income in the urban areas than in therural areas. Twenty two percent <strong>of</strong> paid childlabourers in the urban areas contribute to the totalhousehold income compared to 9 percent <strong>of</strong> paidchild labourers in the rural areas.ProvinceContribution <strong>of</strong> Children to Household Income by residence and Province, 2005Contributes to household income(Percent)Does not contribute to householdincome (Percent)Number <strong>of</strong> paid childrenTotal 10 90 241,648Rural 9 91 219,730Urban 22 78 21,918Source: 2005 Child Labour Report<strong>The</strong> results further show that the proportion <strong>of</strong> paidchild labourers who contribute to the totalhousehold income is higher among older paid childlabourers. Of the total number <strong>of</strong> paid childlabourers who contributed to household income,about 84 percent <strong>of</strong> them either aged 10-14 or 15-17 years.Contribution <strong>of</strong> Children to Household Income by Age Group, 2005Contribution 5-9 Percent 10-14 Percent 15-17 PercentNumber <strong>of</strong>paid childrenTotal 40,563 17 128,371 53 72,714 30 241,648Contributes tohousehold income4,184 17 11,020 44 10,064 40 25,268Does not contributeto household income36,379 17 117,351 54 62,6<strong>50</strong> 29 216,380Source: 2005 Child Labour SurveyChild Labourers’ Contribution to Household Welfare Significant Revealsthe Child Labour Report<strong>The</strong> 2005 Child Labour Module <strong>of</strong> the Labour ForceSurvey results has revealed that child labourers playa significant role in the welfare <strong>of</strong> their families. <strong>The</strong>results show that two in every five child labourerswould have their households’ livingstandards/survival affected if they were to stopworking. <strong>The</strong> results also indicate that 55 percent <strong>of</strong>the labourers reported that their household incomewould not be affected even if they were to stopwork.<strong>The</strong> level <strong>of</strong> dependence was higher for girl childlabourers than boy child labourers. While 43percent <strong>of</strong> the girl child labourers said theirhouseholds’ living standards would decline if theystopped working, only 37 percent <strong>of</strong> the boysreported that their households’ living standardswould decline.12
<strong>The</strong> <strong>Monthly</strong> – <strong>Vol</strong>ume <strong>50</strong><strong>Central</strong> <strong>Statistical</strong> <strong>Office</strong>SexChild labourers by reported effect on households if they were to stop working, 2005Households livingstandards woulddeclineHouseholds can’tafford to surviveHouseholds can’toperate fullyNothing willchangeOtherTotalNumber <strong>of</strong>paid childrenAll <strong>Zambia</strong> 16 8 16 55 5 100 241,648Male 12 7 18 57 5 100 133,226Female 20 9 14 53 5 100 108,422Source: 2005 Child labour ReportAnalysis by age shows that a higher proportion (43percent) <strong>of</strong> child labourers’ in the age category 10-14 years reported that their households’ welfarewould be affected if they were to stop work. <strong>The</strong>results further show that 42 percent <strong>of</strong> those aged15-19 percent also felt that their households’livelihood would be affected should they stopworking.Percentage <strong>of</strong> child labourers whose households would be affected if they were to stop working by agegroup, 2005AgeHouseholds livingstandards woulddeclineHouseholds can’tafford to surviveHouseholds can’toperate fullyNothing willchangeOtherTotalNumber <strong>of</strong>paid childrenAll<strong>Zambia</strong> 16 8 16 55 5100 241,6485-9 12 5 9 71 3 100 40,56310-14 17 10 16 53 5 100 128,37115-17 15 6 21 51 7 100 72,714Source: 2005 Child Labour ReportGENDER BASED VIOLENCEDry Sex Practiced More in Rural Areas<strong>The</strong> 2006 Gender Based Violence (GBV) Surveyresults reveal that 29 percent <strong>of</strong> the respondentshad/practiced dry sex. Dry sex is where a womanused medicines /certain substances to dry out ortighten the vagina before sex in the twelve monthsperiod prior to the survey. Thirty one percent <strong>of</strong>females reported having practiced dry sex, while to25 percent <strong>of</strong> males reported having sex with awoman who practiced dry sex.Rural/urban analysis indicates a higher percentage <strong>of</strong>both male and female respondents in rural areas thathad/practiced dry sex. Thirty two percent <strong>of</strong>respondents in rural areas reported havinghad/practiced dry sex compared to 18 percent <strong>of</strong>those in urban areas. More female respondents (37percent) in rural areas reported having practiced drysex than those in urban areas (18 percent). Twentyseven percent <strong>of</strong> male respondents in rural areasreported having had sex with a woman whopracticed dry sex compared to 19 percent <strong>of</strong> malerespondents in the urban areas.Percentage <strong>of</strong> Respondents by Sex who Practiced Dry Sex, 2006Practiced dry sexwithin the 12<strong>Zambia</strong> Rural Urbanmonths prior tothe survey TotalMale Female Total Male Female Total Male FemaleYes had dry sex 29 25 31 32 27 37 18 19 18No did not havedry sex67 67 68 63 64 62 80 78 81Don’t know 4 8 1 5 9 1 2 3 1Total 100 100 100 100 100 100 100 100 1002006 Gender Based Violence SurveyAt national level, 76 percent <strong>of</strong> respondents whoreported having had/practiced dry sex perceivedtheir last act <strong>of</strong> dry sex as more enjoyable. Moremale respondents (80 percent) than female13
<strong>The</strong> <strong>Monthly</strong> – <strong>Vol</strong>ume <strong>50</strong>respondents (74 percent) reported that the sex wasmore enjoyableIn rural areas, more male respondents with 82percent reported to have enjoyed the last act <strong>of</strong> drysex compared to female respondents with 78percent. Similarly, in urban areas, more male<strong>Central</strong> <strong>Statistical</strong> <strong>Office</strong>respondents (67 percent) reported enjoying dry sexthan female respondents (58 percent). Only 6percent <strong>of</strong> respondents who had had/practiced drysex reported that it was less enjoyable.Percentage <strong>of</strong> Respondents Aged 15-49 by Perception <strong>of</strong> Last Act <strong>of</strong> “Dry Sex”, 2006<strong>Zambia</strong> Rural UrbanPerception <strong>of</strong> lastact <strong>of</strong> dry sexTotal Male Female Total Male Female Total Male FemaleIt was more76 80 74 79 82 78 61 67 58enjoyableIt was less6 6 4 3 4 2 15 15 15enjoyableIt was normal 1822 18 14 20 24 18 2714Total 100 100 100 100 100 100 100 100 1002006 Gender Based Violence SurveyMore Men Physically Hurting <strong>The</strong>ir Spouses!!<strong>The</strong> 2006 Gender Based Violence (GBV) Surveyresults reveal that more males (20 percent) reportedever having physically hurt their spouses/partnersthan females (12 percent). Overall, 16 percent <strong>of</strong> allthe respondents reported physically hurting theirspouse or partner.Comparison by residence shows a similar pattern,with more males than females reporting everphysically hurting their spouse/partner. In rural areas,20 percent <strong>of</strong> males reported ever physically hurtingtheir spouse/partner compared to 11 percent <strong>of</strong>females, while in urban areas 22 percent <strong>of</strong> males,compared to 17 percent <strong>of</strong> females reported everphysically hurting their spouse/partner.Percent distribution <strong>of</strong> persons who have ever slapped, kicked or physically hurt their spouse or partner<strong>Zambia</strong> Rural UrbanHas slapped , kicked or physically hurt theirspouse or partnerNever slapped, hit or physically hurtspouse/partnerBothsexesMale Female BothsexesMale Female Bothsexes16 20 12 15 20 11 19 22 1784 79 88 85 80 89 81 78 83Total 100 100 100 100 100 100 100 100 100Source: 2006 Gender- Based Violence SurveyMaleFemale<strong>The</strong> survey also collected information on the type <strong>of</strong>abuse from those who reported ever having beenphysically abused. <strong>The</strong> most common physical abusereported was slapping. More females (28 percent)than males (15 percent) reported being slapped. <strong>The</strong>other common abuse reported was being pushedand shaken with 20 percent reporting that thishappened to them. Females reported experiencingthis more than the males (22 percent versus 16percent). For all types <strong>of</strong> physical violence, femaleswere more likely to experience them than the males.Percent Distribution <strong>of</strong> Persons who reported ever been physically abused in the last 12 months, by type <strong>of</strong>abuse.Does your spouse or partner do the following to you?DoesNot At AllBoth Sexes Male Female Both Sexes Male FemalePush, shake or throw something at you 20 16 22 81 84 78Slap you 21 15 28 78 84 73Twist or pull your hair 12 8 15 88 91 85Punch or hit you with something that could hurt you 12 10 15 87 90 85Kick, drag or beat you 11 7 14 89 93 86Try to choke or burn you on purpose 7 7 7 93 93 93Threaten to attack you with a knife or weapon 8 7 9 92 93 91Physical force to have sexual intercourse with him even whenyou did not want10 7 14 89 93 87Force you to perform any sexual acts you did not want to 10 8 14 89 92 8714
<strong>The</strong> <strong>Monthly</strong> – <strong>Vol</strong>ume <strong>50</strong><strong>Central</strong> <strong>Statistical</strong> <strong>Office</strong>Source: 2006 Gender Based Violence Survey.15
<strong>The</strong> <strong>Monthly</strong> – <strong>Vol</strong>ume <strong>50</strong><strong>Central</strong> <strong>Statistical</strong> <strong>Office</strong>ECONOMIC CENSUSFrequently Asked Questions about the Economic Census<strong>The</strong> <strong>Central</strong> <strong>Statistical</strong> <strong>Office</strong> (CSO) has launched the Economic Census. <strong>The</strong> Economic Census, which is beingcarried out for the first time in <strong>Zambia</strong>, will provide a detailed portrait <strong>of</strong> the nation’s economy, from the nationalto the local level. <strong>The</strong> CSO intends to carry out the Economic Census every five years.To help you understand what the Economic Census is all about, we answer some <strong>of</strong> the frequently askedquestions about this important national undertaking.What is the Economic Census?An Economic Census is a total process <strong>of</strong> collecting, compiling, evaluating, analysing, and publishing economicdata pertaining, at a specific time or times, from all business and social establishments in a designated area orcountry. It is the primary source <strong>of</strong> information about an economy’s activities. <strong>The</strong> Economic Census ultimatelyforms a basis for all economic surveys in an economy.What is our mandate?<strong>The</strong> Economic Census is being carried out under the provisions <strong>of</strong> the Census and Statistics Act Chapter 127 <strong>of</strong> theLaws <strong>of</strong> <strong>Zambia</strong>. <strong>The</strong> law requires firms to respond and specifies penalties for firms that fail to report. <strong>The</strong> law alsorequires the CSO to maintain confidentiality. No data are published that could reveal the identity or activity <strong>of</strong> anyindividual or business. <strong>The</strong> data so collected will be used for statistical purposes only and no other use.Why the Economic Census?In the early 1990’s, <strong>Zambia</strong> embarked on a vigorous restructuring exercise <strong>of</strong> its economy that brought aboutstructural changes in almost all the sectors <strong>of</strong> the economy. In order to measure the impact <strong>of</strong> the changes in theeconomy, there is need for a set <strong>of</strong> macro-economic indicators that are produced regularly and on a timely basisand using the most recent internationally accepted methodologies. <strong>The</strong> current set <strong>of</strong> economic indicatorsproduced by the Economic Statistics Division <strong>of</strong> the CSO may not fully reflect the current dynamic structure <strong>of</strong> theeconomy as there have not been any major baseline economic surveys or censuses conducted in recent years.What will it achieve?<strong>The</strong> Economic Census will provide benchmark statistics that will serve as a major source <strong>of</strong> facts about thestructure and functions <strong>of</strong> the <strong>Zambia</strong>n economy, and benchmark data for other economic indicators.<strong>The</strong> specific objectives <strong>of</strong> the Economic Census include:a. To measure the full value added (GDP) <strong>of</strong> the <strong>Zambia</strong>n economyb. To provide data which will enable the CSO compile a full set <strong>of</strong> national accounts (input-output tables,Gross Fixed Capital formation, Investment, etc)c. To measure the true extent <strong>of</strong> investment in <strong>Zambia</strong>; both foreign and domestic.d. To provide a basis for setting up Balance <strong>of</strong> Payments statistics.e. To provide a basis for the production <strong>of</strong> different kinds <strong>of</strong> Economic Statistics (Producer Price Index,Index <strong>of</strong> Industrial Production, etc.)f. To provide a comprehensive frame <strong>of</strong> establishments for all economic surveys.16
<strong>The</strong> <strong>Monthly</strong> – <strong>Vol</strong>ume <strong>50</strong><strong>Central</strong> <strong>Statistical</strong> <strong>Office</strong><strong>The</strong> <strong>2007</strong> Economic Census will include many “firsts”, such as the comprehensive measurement <strong>of</strong> the output <strong>of</strong>“new” industries that include mobile phone and internet service providers; computer and other business services;market stalls and other small-scale business owners in the informal sector.Who is to be covered?<strong>Zambia</strong>, administratively, is demarcated into 9 provinces, 72 districts, 1<strong>50</strong> constituencies and 1, 422 wards. Forthe purposes <strong>of</strong> the Economic Census, the CSO has divided wards into Census Supervisory Areas (CSA) whichhave further been subdivided into Standard Enumeration Areas (SEA). An enumerator will be expected toenumerate all the establishments within an SEA.<strong>The</strong> Economic Census will cover all sectors <strong>of</strong> the economy including Agriculture; Mining; Manufacturing;Construction; Trading; Tourism; Real Estate; Financial Intermediaries (Banks & non-banks); Education; Health;Religious institutions and Non-Governmental Organizations (NGOs); and the public sector (Local Government,<strong>Central</strong> Government, and parastatals).Economic Census statistics shall be collected primarily from establishments and published by aggregation <strong>of</strong>establishments. All establishments (large, medium, small, micro; formal and informal) in <strong>Zambia</strong> will beenumerated. An establishment is defined as any entity where a good or service is produced or provided. It can bean individual person, a group <strong>of</strong> persons or a firm/company/institution/organization.<strong>The</strong> Economic Census is not a household survey; it is an establishment-based undertaking. However, householdswill be approached to identify economic activities being carried out by household members such as; running taxis/minibuses, walker business and other economic activities.How will it be done?<strong>The</strong> Economic Census will be done in two phases:1. Listing <strong>of</strong> all establishments in <strong>Zambia</strong> (Large, medium, small, micro, formal and informal).2. Enumeration <strong>of</strong> the listed establishmentsIn the first phase <strong>of</strong> the Economic Census, a List (frame) <strong>of</strong> all establishments, whether formal or informal, largescale, medium scale, small scale or micro businesses in <strong>Zambia</strong> will be compiled. <strong>The</strong> listing exercise will, amongother uses, provide a comprehensive new Register <strong>of</strong> Establishments for <strong>Zambia</strong>; provide detailed information forfollow-up surveys.After the listing phase, industry-specific and detailed questionnaires will be administered to all establishments(large, medium, small, micro; formal and informal) according to the type <strong>of</strong> establishment (mining, manufacturing,trading, etc.).What are we going to ask?Several key data will be collected from all industries to be covered in the Economic Census. <strong>The</strong>se include:- Nature <strong>of</strong> operation or main activity- Type <strong>of</strong> ownership- Number <strong>of</strong> persons employed- Turnover, sales, receipts, revenue- Labour costs and other expenses- Assets, capital expenditures, stocks, etc.What is expected <strong>of</strong> you?We urge all owners and operators <strong>of</strong> the various establishments in <strong>Zambia</strong> to co-operate with us and provideaccurate information to the listers and enumerators who will soon visit your establishment to collect information.Your input is vital for the accurate measurement <strong>of</strong> the performance <strong>of</strong> the <strong>Zambia</strong>n economy. Commonly usedeconomic indicators – such as the GDP – will depend on the data you provide for accuracy.17
<strong>The</strong> <strong>Monthly</strong> – <strong>Vol</strong>ume <strong>50</strong> <strong>Central</strong> <strong>Statistical</strong> <strong>Office</strong>Total G.D.P. AtCurrentPrices(K’ billion)Total G.D.P. AtConstant (1994)Prices(K’ billion)SELECTED SOCIO-ECONOMIC INDICATORSGross Domestic Product (GDP)1994 1995 1996 1997 1998 1999 2000 2001 2002 2003 2004 2005 2006*G.D.P. Per CapitaAt Current Prices(Kwacha)G.D.P. Per CapitaAt Constant(1994) Prices(Kwacha)G.D.P.GrowthRate At Constant(1994) Prices*Revised estimatesSource: C.S.O., National Accounts Statistics<strong>Zambia</strong> Surfacearea2,240.1 3,005.1 3,9<strong>50</strong>.2 5,140.2 6,027.9 7,477.7 10,071.9 13,132.7 16,260.4 20,479.2 25,997.4 32,456.3 38,676.52,240.1 2,176.9 2,328.1 2,404.9 2,360.2 2,412.7 2,499.0 2,621.3 2,707.9 2,846.5 2,999.2 3,155.9 3,343.3264,205 346,017 444,059 564,127 645,869 782,201 1,028,5871,301,621 1,562,085 1,906,038 2,344,290 2,836,723 3,278,034264,205 2<strong>50</strong>,659 261,707 263,935 252,886 252,384 255,213 259,806 260,138 264,930 270,4<strong>50</strong> 275,830 283,365752,612/square km-2.8 6.9 3.3 -1.9 2.2 3.6 4.9 3.3 5.1 5.4 5.2 5.9Projected Population, 2000-<strong>2007</strong>2000 2001 2002 2003 2004 2005 2006 <strong>2007</strong>POPULATION 9,885,591 10,089,492 10,409,441 10,744,380 11,089,691 11,441,461 11,798,678 12,160,516POPULATIONGROWTH RATE2.5 3.1 3.1 3.1 3.1 3.1 3 3LIFEEXPECTANCY ATBIRTH<strong>50</strong>.0 51.8 51.9 52.4 52.4 52.6 51.9 51.4Source: C.S.O., Population Projections ReportNote: 2000 figures are from the 2000 Census <strong>of</strong> Population and Housing while the 2001 to <strong>2007</strong> figures are the Population Projections ReportPoverty Trends 1991-20041991 1993 1996 1998 2004<strong>Zambia</strong> Total 70 74 69 73 68Rural/UrbanRural 88 92 82 83 78Urban 49 45 46 56 53Source: LCMS IV (2004)18
<strong>The</strong> <strong>Monthly</strong> – <strong>Vol</strong>ume <strong>50</strong>LAYMAN & STATISTICSTrade Surplus: this is a situation were a country is exporting more than it is importing.<strong>Central</strong> <strong>Statistical</strong> <strong>Office</strong>SITC: Stands for Standard International Trade Classification. It is a trade statistical nomentriture mainly used intrade statistical analysis.Child Labour: Is any activity, economic or non-economic, performed by a child, that is either too dangerous orhazardous or for which the child is too small to perform and that has the potential to negatively affect his or herhealth, education, moral and normal development would constitute child labour.Hazard: anything that can cause harm, while risk is chance, whether big or small, <strong>of</strong> a harm actually occurring dueto a hazard.Hazardous work: Is defined as work that is undertaken at height or extreme temperatures or involving machineryor chemicals.Household: is defined as a group <strong>of</strong> persons (may comprise several members or one) who normally eat and livetogether. <strong>The</strong>se people may or may not be related by blood, but make common provision for food and otheressentials for living.Household monthly income: this is the monthly earnings <strong>of</strong> a household from engaging in economic activitiessuch as the production <strong>of</strong> goods and services, and the ownership <strong>of</strong> assets. Household monthly income is the sum<strong>of</strong> all incomes <strong>of</strong> household members.Economic shocks: Are defined as events that cause disruptions in the normal functioning <strong>of</strong> the household suchas death, crop failure and loss <strong>of</strong> employment.A Child: Any person aged 15 years and below is considered as a child.19
<strong>The</strong> <strong>Monthly</strong> – <strong>Vol</strong>ume <strong>50</strong><strong>Central</strong> <strong>Statistical</strong> <strong>Office</strong>Surveys being undertaken<strong>2007</strong> <strong>Zambia</strong> Demographic & Health Survey<strong>2007</strong> Economic Census2010 Cartographic MappingNow Available <strong>Zambia</strong> Sexual Behaviour Survey, 2005 Employment and Earnings Inquiry Report, January 2006 National Accounts Statistics Bulletin No.9 2005 Selected Socio-Economic Indicators, 2004 - 2005 Labour-Force Survey Report, 2005Soon to be released! Financial Statistics Report, 2005 Commercial Sexual Exploitation <strong>of</strong> Children in <strong>Zambia</strong> (CSEC), 2005 Gender Based Violence, 2005 Child Labour Report, 2005Subscribe for your free electronic copy <strong>of</strong> “<strong>The</strong> <strong>Monthly</strong>” online at www.zamstats.gov.zm<strong>The</strong> Editorial Team would like to thank all Media Institutions and Users <strong>of</strong>“<strong>The</strong> <strong>Monthly</strong>”Thank you for supporting usSecretariatMs. Efreda Chulu - Acting DirectorJohn Kalumbi - Deputy DirectorLee Chileshe - Acting Publications and Marketing <strong>Office</strong>rLinda N. Chonya - DemographerCecilia M. Munjita - LibrarianEtambuyu Lukonga - DocumentalistPetronella Kaputu - Press Liaison <strong>Office</strong>rHumphrey Zimba – Dissemination <strong>Office</strong>rAnthony Nkole - Desktop Publishing <strong>Office</strong>rPerry Musenge - Assistant Desktop Publishing <strong>Office</strong>rEditorial TeamMr Modesto Banda - Deputy DirectorJohn Kalumbi - Deputy DirectorBatista Chilopa - Operations ManagerDaniel Daka - Principal StatisticianLee Chileshe - Acting Publications and Marketing <strong>Office</strong>rPalver Sikanyiti - StatisticianGerson Banda - StatisticianJosephine Chewe Banda - StatisticianChisuwa Sandu - Assistant Field Co-ordinatorShebo Nalishebo- Statistician20