Vol 112 2012 The Monthly July - Central Statistical Office of Zambia
Vol 112 2012 The Monthly July - Central Statistical Office of Zambia
Vol 112 2012 The Monthly July - Central Statistical Office of Zambia

Create successful ePaper yourself
Turn your PDF publications into a flip-book with our unique Google optimized e-Paper software.
Republic <strong>of</strong> <strong>Zambia</strong><br />
<strong>Vol</strong>ume 111 Website: www.zamstats.gov.zm <strong>July</strong>, <strong>2012</strong><br />
Foreword<br />
<strong>The</strong><br />
<strong>Monthly</strong><br />
<strong>Central</strong> <strong>Statistical</strong> <strong>Office</strong><br />
Welcome to the <strong>Monthly</strong> presentation organised by the<br />
Dissemination Branch <strong>of</strong> the <strong>Central</strong> <strong>Statistical</strong> <strong>Office</strong> (CSO). <strong>The</strong><br />
CSO embarks on vigorous information delivery strategy to major<br />
stakeholders and the media institutions in order to increase<br />
utilisation <strong>of</strong> statistical products and services. <strong>The</strong> <strong>of</strong>fice produces<br />
a number <strong>of</strong> statistical products in the Economic, Social,<br />
Agricultural and Environmental areas. <strong>The</strong> information collected<br />
in these areas may be used for various purposes including policy<br />
formulation, planning, implementation, monitoring and<br />
evaluation <strong>of</strong> programmes and projects.<br />
This <strong>Monthly</strong> publication is an attempt to provide highlights <strong>of</strong><br />
CSO’s work and how it can help media institutions and the<br />
general public to make use <strong>of</strong> data and information for<br />
sustainable national development and decision-making.<br />
I would like to urge our readers and users <strong>of</strong> statistical information<br />
to send to us any comments that may enhance statistical<br />
production and contribute to the improvement <strong>of</strong> this bulletin.<br />
Inside this<br />
Issue<br />
<strong>July</strong> Inflation<br />
reduces to 6.2<br />
percent<br />
June <strong>2012</strong><br />
records<br />
Trade<br />
Surplus<br />
● 2010 Census <strong>of</strong><br />
Population and<br />
Housing<br />
John Kalumbi<br />
Director <strong>of</strong> Census and Statistics<br />
26th <strong>July</strong>, <strong>2012</strong><br />
Selected<br />
Socio -<br />
Economic<br />
Indicators<br />
<strong>Central</strong> <strong>Statistical</strong> <strong>Office</strong>, Nationalist Road, P.O. Box 31908, Lusaka ● Telefax: 260-1-253468 ● E-mail: info@zamstats.gov.zm 1 | P a g e
(Percentage)<br />
INFLATION<br />
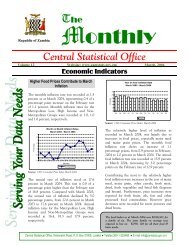
<strong>July</strong> Inflation reduces to 6.2 percent<br />
<strong>The</strong> annual rate <strong>of</strong> inflation, as measured by<br />
the all items Consumer Price Index (CPI),<br />
reduced to 6.2 percent in <strong>July</strong> <strong>2012</strong>, from 6.7<br />
Source: CSO, Prices Statistics, <strong>2012</strong><br />
percent in June <strong>2012</strong>. <strong>The</strong> decrease is<br />
attributed to the reduction in prices <strong>of</strong> some<br />
food and non food items.<br />
Annual Inflation Rate<br />
<strong>July</strong> 2011 - <strong>July</strong> <strong>2012</strong><br />
8<br />
7<br />
6<br />
5<br />
4<br />
3<br />
2<br />
1<br />
0<br />
Jul Aug Sept Oct Nov Dec Jan Feb Mar Apr May Jun Jul<br />
Composite 6.9 6.5 6.6 6.7 6.4 6 6.4 6 6.4 6.5 6.6 6.7 6.2<br />
Composite<br />
Movements in annual inflation rates for CPI Main Groups<br />
Between June <strong>2012</strong> and <strong>July</strong> <strong>2012</strong>, the annual<br />
rate <strong>of</strong> inflation decreased for Food and nonalcoholic<br />
beverages; Furnishings, household<br />
equipment, routine house maintenance;<br />
Housing, water, electricity, gas, and other<br />
fuels; Transport; Recreation and culture, while<br />
it increased for Alcoholic beverages and<br />
tobacco; Clothing and footwear; Health;<br />
Communication; Education; and Restaurant<br />
and hotel.<br />
2 | P a g e
All Items<br />
Food & Non-alcoholic<br />
beverages<br />
Alcoholic beverages<br />
& Tobacco<br />
Clothing & footwear<br />
Housing, Water,<br />
Electricity, Gas &<br />
Other fuels<br />
Furnishings,<br />
Household Equip..,<br />
Routine Hse Mtc<br />
Health<br />
Transport<br />
Communication<br />
Recreation & Culture<br />
Education<br />
Restaurant & Hotel<br />
Miscellaneous Goods<br />
& Services<br />
Annual Inflation Rate: CPI Main Groups<br />
1000 534.9 15.2 80.8 114.1 82.4 8.2 58.1 12.9 13.8 26.6 3.4 49.7<br />
Jan '11 - Jan '10 6.3 4.2 1.4 4.4 17.2 7.0 6.4 8.0 -0.1 3.5 6.0 8.2 6.3<br />
Feb '11 - Feb '10 6.5 4.3 2.6 5.9 18.2 7.5 7.7 5.4 0.6 4.2 7.4 8.3 6.4<br />
Mar '11 - Mar '10 6.6 4.1 2.1 7.6 18.3 6.9 6.5 5.9 0.2 2.8 9.3 9.5 6.5<br />
Apr '11 - Apr '10 6.3 3.7 2.9 9.5 16.1 6.0 6.7 7.5 0.4 3.0 8.1 8.5 6.3<br />
May '11 - May'10 6.3 3.5 5.0 9.4 18.3 6.3 7.2 5.6 0.4 5.2 7.4 7.4 5.8<br />
Jun '11 - Jun '10 6.1 3.8 5.3 9.6 16.0 6.2 7.1 2.9 0.5 4.4 9.2 8.4 4.8<br />
Jul '11 - Jul '10 6.9 5.0 4.8 10.0 15.3 7.4 6.3 3.4 0.4 6.8 8.2 5.5 5.5<br />
Aug '11 - Aug '10 6.5 5.8 3.6 10.6 7.2 7.8 4.5 7.2 0.3 7.4 7.2 8.4 5.1<br />
Sep '11 - Sep '10 6.6 6.1 3.8 9.0 7.7 8.9 5.2 6.4 0.0 7.0 8.2 6.3 4.5<br />
Oct '11 - Oct '10 6.7 6.3 4.6 8.5 6.2 9.7 3.2 8.4 0.4 7.8 8.4 5.5 4.8<br />
Nov '11 - Nov '10 6.4 6.0 4.0 8.7 6.4 8.5 6.1 6.7 0.6 7.8 9.4 6.4 3.0<br />
Dec '11 - Dec '10 6.0 5.3 2.0 8.2 6.1 6.2 5.6 9.2 0.5 7.7 9.0 3.9 4.8<br />
Jan '12 - Jan '11 6.4 6.1 2.4 9.3 6.1 7.0 8.1 8.5 1.1 8.0 8.6 5.2 3.1<br />
Feb '12 - Feb '11 6.0 5.5 2.9 8.1 4.8 7.7 7.4 8.9 1.3 7.7 9.6 5.2 3.8<br />
Mar '12 - Mar '11 6.4 6.4 3.5 7.9 4.9 7.7 7.4 7.8 1.2 8.1 7.9 3.0 4.7<br />
Apr '12 - Apr '11 6.5 6.4 2.4 6.4 5.7 8.9 6.2 7.2 1.2 8.0 8.2 3.3 5.6<br />
May '12 - May'11 6.6 6.8 3.3 6.0 5.3 8.6 5.6 6.6 1.1 7.1 9.3 3.2 6.3<br />
Jun '12 - Jun '11 6.7 7.1 3.6 5.4 5.4 7.9 4.5 7.3 1.0 8.1 8.5 2.1 6.6<br />
Jul '12 - Jul '11 6.2 6.3 5.2 5.6 5.3 6.9 5.4 5.9 1.7 7.2 9.6 4.6 6.8<br />
Source: CSO, Prices Statistics, <strong>2012</strong><br />
Contributions <strong>of</strong> different Items to overall inflation<br />
Of the total 6.2 percent annual inflation<br />
recorded in <strong>July</strong> <strong>2012</strong>, food products<br />
accounted for 3.3 percentage points, while<br />
non-food products in the Consumer Price<br />
Index (CPI) accounted for a total <strong>of</strong> 2.9<br />
percentage points.<br />
Percentage Points Contributions <strong>of</strong> different items to overall inflation<br />
ITEMS June <strong>2012</strong> <strong>July</strong> <strong>2012</strong><br />
Food and Non-alcoholic beverages 3.6 3.3<br />
Alcoholic beverages and Tobacco 0.1 0.1<br />
Clothing and footwear 0.5 0.5<br />
Housing, Water, Electricity, Gas and Other fuels 0.7 0.7<br />
Furnishings, Household Equipment, Routine house maintenance 0.7 0.6<br />
Health 0.1 0.0<br />
Transport 0.4 0.3<br />
Communication 0.0 0.0<br />
Recreation and Culture 0.1 0.1<br />
Education 0.2 0.3<br />
Restaurant and Hotel 0.0 0.0<br />
Miscellaneous Goods and Services 0.3 0.3<br />
All items 6.7 6.2<br />
Source: CSO, Prices Statistics, <strong>2012</strong><br />
3 | P a g e
<strong>The</strong> annual food and Non- food Inflation Rate<br />
<strong>The</strong> annual food inflation rate was recorded<br />
at 6.3 percent in <strong>July</strong> <strong>2012</strong> compared to 7.1<br />
percent recorded in June <strong>2012</strong>. This implies<br />
that there was a 0.8 percentage point<br />
decrease in annual food inflation. <strong>The</strong> annual<br />
non- food inflation rate was recorded at 6.0<br />
percent in <strong>July</strong> <strong>2012</strong> from the 6.2 percent<br />
recorded in June <strong>2012</strong> which implies that the<br />
annual non-food inflation rate decreased by<br />
0.2 percentage points over the previous<br />
month.<br />
Annual Inflation Rates: Food and Non Food Items 2009 = 100<br />
Period Total Food Non-Food<br />
Weight 1 000.00 534.85 465.15<br />
2011<br />
Jan '11 - Jan '10 6.3 4.2 8.6<br />
<strong>2012</strong><br />
Feb '11 - Feb '10 6.5 4.3 9.1<br />
Mar '11 - Mar '10 6.6 4.1 9.4<br />
Apr '11 - Apr '10 6.3 3.7 9.2<br />
May '11 - May '10 6.3 3.5 9.5<br />
Jun '11 - Jun '10 6.1 3.8 8.7<br />
Jul '11 - Jul '10 6.9 5.0 8.9<br />
Aug '11 - Aug '10 6.5 5.8 7.3<br />
Sep '11 - Sep '10 6.6 6.1 7.3<br />
Oct '11 - Oct '10 6.7 6.3 7.2<br />
Nov '11 - Nov '10 6.4 6.0 6.8<br />
Dec '11 - Dec '10 6.0 5.3 6.6<br />
Jan '12 - Jan '11 6.4 6.1 6.8<br />
Feb '12 - Feb '11 6.0 5.5 6.5<br />
Mar '12 - Mar '11 6.4 6.4 6.4<br />
Apr '12 - Apr '11 6.5 6.4 6.5<br />
May '12 - May '11 6.6 6.8 6.3<br />
Jun '12 - Jun '11 6.7 7.1 6.2<br />
Jul '12 - Jul '11 6.2 6.3 6.0<br />
Source: CSO, Prices Statistics, <strong>2012</strong><br />
<strong>The</strong> Month on Month food and Non- food Inflation Rate<br />
<strong>The</strong> month on month food inflation rate was<br />
recorded at 0.8 percent in <strong>July</strong> <strong>2012</strong><br />
compared to the -0.4 percent recorded in<br />
June <strong>2012</strong>. This implies that the month on<br />
month food and non food inflation rate<br />
increased in <strong>July</strong> <strong>2012</strong> by 1.2 and 0.2<br />
percentage points, respectively.<br />
Month on month Inflation Rates: Food and Non Food Items2009 = 100<br />
Period Total Food Non-Food<br />
Weight 1000.0 534.9 465.2<br />
2010 Jan '10 - Dec '09 5.0 4.4 5.7<br />
Feb '10 - Jan '10 0.4 0.4 0.5<br />
Mar '10 - Feb '10 1.0 1.2 0.8<br />
Apr '10 - Mar '10 0.9 0.9 0.8<br />
May '10 - Apr '10 0.2 0.1 0.4<br />
Jun '10 - May '10 0.2 -0.9 1.4<br />
4 | P a g e
Month on month Inflation Rates: Food and Non Food Items2009 = 100<br />
Period Total Food Non-Food<br />
Weight 1000.0 534.9 465.2<br />
Jul '10 - Jun '10 0.5 0.3 0.7<br />
Aug '10 - Jul '10 0.9 -0.6 2.5<br />
Sep '10 - Aug '10 0.2 0.1 0.4<br />
Oct '10 - Sep '10 -0.3 -0.4 -0.1<br />
Nov '10 - Oct '10 0.4 0.7 0.1<br />
Dec '10 - Nov '10 0.9 1.2 0.5<br />
2011 Jan '11 - Dec '10 0.7 1.1 0.2<br />
Feb '11 - Jan '11 0.7 0.5 0.9<br />
Mar '11 - Feb '11 1.1 1.0 1.1<br />
Apr '11 - Mar '11 0.6 0.6 0.6<br />
May '11 - Apr '11 0.3 -0.1 0.7<br />
Jun '11 - May '11 0.0 -0.6 0.6<br />
Jul '11 - Jun '11 1.2 1.5 0.9<br />
Aug '11 - Jul '11 0.6 0.1 1.1<br />
Sep '11 - Aug '11 0.4 0.3 0.4<br />
Oct '11 - Sep '11 -0.2 -0.2 -0.1<br />
Nov '11 - Oct '11 0.1 0.4 -0.2<br />
Dec '11 - Nov '11 0.5 0.6 0.3<br />
<strong>2012</strong> Jan '12 - Dec '11 1.1 1.8 0.3<br />
Feb '12 - Jan '12 0.3 -0.1 0.6<br />
Mar '12 - Feb '12 1.5 1.9 1.0<br />
Apr '12 - Mar '12 0.7 0.5 0.8<br />
May '12 - Apr '12 0.4 0.3 0.5<br />
Jun '12 - May '12 0.0 -0.4 0.5<br />
Jul '12 - Jun '12 0.7 0.8 0.7<br />
Source: CSO, Prices Statistics, <strong>2012</strong><br />
Provincial Contribution to overall Inflation<br />
<strong>The</strong> largest provincial contribution to the<br />
annual inflation <strong>of</strong> 6.2 percent recorded in<br />
<strong>July</strong> <strong>2012</strong> was from the Copperbelt Province<br />
with 1.5 percentage points. This was followed<br />
by Lusaka Province with a contribution <strong>of</strong> 1.1<br />
percentage points and the lowest provincial<br />
contribution to the annual inflation was from<br />
Northern/Muchinga and North western<br />
provinces accounting for 0.2 percentage<br />
points each.<br />
Province June <strong>2012</strong> <strong>July</strong> <strong>2012</strong><br />
<strong>Central</strong> 0.5 0.7<br />
Copperbelt 1.8 1.5<br />
Eastern 0.9 0.9<br />
Luapula 0.4 0.5<br />
Lusaka 1.5 1.1<br />
Northern/ Muchinga 0.2 0.2<br />
North Western 0.2 0.2<br />
Southern 0.9 0.8<br />
Western 0.3 0.3<br />
All items 6.7 6.2<br />
Source: CSO, Prices Statistics, <strong>2012</strong><br />
5 | P a g e
Changes in Inflation Rates for Provinces<br />
Annual rate <strong>of</strong> inflation increased for <strong>Central</strong>,<br />
Luapula, Northern/Muchinga, North-western<br />
and Western provinces between June and<br />
<strong>July</strong> <strong>2012</strong> while it decreased for Copperbelt,<br />
Eastern, Lusaka and Southern provinces.<br />
Eastern Province had the highest annual rate<br />
<strong>of</strong> inflation at 10.1 percent. This high rate was<br />
mainly driven by increases in Food and nonalcoholic<br />
beverages; Alcoholic beverages;<br />
Furnishings, household equipment, routine<br />
house maintenance; and Recreation and<br />
culture.<br />
<strong>The</strong> Northern/Muchinga province had the<br />
lowest annual rate <strong>of</strong> inflation at 3.0 percent.<br />
This is attributed to the decreases in the Food<br />
and non-alcoholic beverages; Health;<br />
Transport; Restaurant and hotel; and<br />
Miscellaneous goods and services.<br />
Provincial Price Indices and inflation Rates<br />
Index (2009 = 100) Percentage change over Percentage change over 12<br />
one month<br />
months<br />
Weights<br />
May June <strong>July</strong> May June <strong>July</strong> May June <strong>July</strong><br />
Province<br />
1000 122.1 122.2 123.1 0.4 0.0 0.7 6.6 6.7 6.2<br />
<strong>Central</strong> 107.19 120.7 120.9 122.2 -0.5 0.1 1.1 5.4 4.6 6.8<br />
Copperbelt 219.68 121.8 122.8 122.9 1.0 0.8 0.1 7.9 8.5 7.0<br />
Eastern 88.98 125.7 124.9 126.7 1.0 -0.7 1.5 10.7 10.8 10.1<br />
Luapula 50.60 122.6 122.3 123.7 -1.0 -0.3 1.1 7.9 7.2 9.0<br />
Lusaka 283.89 121.9 121.9 122.5 0.1 0.0 0.5 5.7 5.3 3.8<br />
Northern/<br />
Muchinga 65.72 120.0 121.0 122.9 -0.6 0.9 1.5 1.9 2.8 3.0<br />
North western 32.33 120.4 119.6 121.7 -0.7 -0.7 1.7 5.2 6.4 7.6<br />
Southern 109.19 124.3 123.7 124.8 1.6 -0.4 0.9 7.0 7.7 7.3<br />
Western 42.42 119.4 117.5 117.8 1.3 -1.5 0.3 6.1 6.2 6.5<br />
Source: CSO, Prices Statistics, <strong>2012</strong><br />
National Average Prices <strong>of</strong> Selected Products<br />
A comparison <strong>of</strong> retail prices between June<br />
<strong>2012</strong> and <strong>July</strong> <strong>2012</strong> shows that the national<br />
average price <strong>of</strong> a 25 kg bag <strong>of</strong> white roller<br />
mealie meal increased by 0.6 percent from<br />
K31, 369.00 to K31, 560.00. <strong>The</strong> national<br />
average prices for maize grain also increased<br />
by 1.2 percent from K17, 305.00 to K17, 507.00.<br />
<strong>The</strong> national average price <strong>of</strong> 1kg <strong>of</strong> dried<br />
Kapenta (Mpulungu) decreased by 5.4<br />
percent from K79, 633.00 to K75, 370.00. <strong>The</strong><br />
average price <strong>of</strong> 1kg <strong>of</strong> dried Kapenta<br />
(Chisense) also decreased by 11.5 percent<br />
from K58, 209.00 to K51, 515.00. <strong>The</strong> national<br />
average price <strong>of</strong> 1kg <strong>of</strong> tomatoes decreased<br />
by 17.0 percent from K4, 453.00 to K 3, 694.00<br />
and the average price <strong>of</strong> 1kg <strong>of</strong> cabbage<br />
(vegetable) decreased by 10.7 percent from<br />
K1, 985.00 to K1,772.00.<br />
6 | P a g e
National Average Prices for selected Products and Months<br />
Description<br />
<strong>2012</strong><br />
Mar '12 Apr '12 May '12 Jun '12 <strong>July</strong>’12<br />
%<br />
Change<br />
Breakfast Mealie Meal 44 388.00 42 413.00 42 103.00 42 052.00 42 046.00 0.0<br />
Roller Mealie Meal 32 858.00 32 733.00 31 619.00 31 369.00 31 560.00 0.6<br />
Maize grain 19 487.00 18 618.00 17 888.00 17 305.00 17 507.00 1.2<br />
Samp 5 654.00 5 415.00 5 908.00 5 210.00 5 434.00 4.3<br />
Fillet Steak 37 461.00 36 018.00 38 906.00 36 289.00 36 974.00 1.9<br />
Rump Steak 34 136.00 33 993.00 35 677.00 33 918.00 34 627.00 2.1<br />
Brisket 26 624.00 26 997.00 27 635.00 26 920.00 27 036.00 0.4<br />
Mixed Cut 25 233.00 24 649.00 25 302.00 25 739.00 24 924.00 -3.2<br />
Beef Sausages 31 204.00 29 636.00 30 357.00 32 220.00 32 164.00 -0.2<br />
Mince Meat 31 223.00 31 869.00 32 243.00 31 572.00 32 635.00 3.4<br />
Offals (Beef) 13 982.00 14 726.00 14 119.00 14 334.00 14 836.00 3.5<br />
Pork Sausages 32 640.00 33 286.00 30 383.00 33 606.00 32 662.00 -2.8<br />
Pork Chops 24 972.00 25 044.00 23 732.00 24 783.00 23 555.00 -5.0<br />
Goat Meat 15 627.00 17 058.00 16 251.00 17 731.00 18 539.00 4.6<br />
Mutton 48 615.00 50 423.00 51 121.00 49 620.00 60 005.00 20.9<br />
Chicken Frozen 17 206.00 17 466.00 18 001.00 18 175.00 18 647.00 2.6<br />
Chicken Live 14 775.00 14 986.00 15 214.00 14 789.00 15 753.00 6.5<br />
Fresh Kapenta 7 008.00 7 362.00 7 961.00 7 815.00 8 493.00 8.7<br />
Dried Bream 48 715.00 47 714.00 45 693.00 41 016.00 46 635.00 13.7<br />
Dried Kapenta Mpulungu 63 333.00 71 534.00 75 987.00 79 633.00 75 370.00 -5.4<br />
Dried Kapenta Siavonga 72 500.00 68 971.00 72 565.00 66 096.00 71 543.00 8.2<br />
Dried Kapenta Chisense 42 963.00 49 890.00 59 157.00 58 209.00 51 515.00 -11.5<br />
Groundnuts 10 172.00 10 322.00 9 408.00 9 507.00 9 204.00 -3.2<br />
Rape 3 404.00 3 261.00 3 226.00 3 045.00 2 663.00 -12.5<br />
Cassava Leaves 2 243.00 2 525.00 2 565.00 2 813.00 2 693.00 -4.3<br />
Okra 5 312.00 5 304.00 5 794.00 6 449.00 8 586.00 33.1<br />
Cabbage 1 980.00 1 994.00 2 132.00 1 985.00 1 772.00 -10.7<br />
Tomatoes 5 153.00 5 363.00 4 933.00 4 453.00 3 694.00 -17.0<br />
Green Beans 9 482.00 8 052.00 11 176.00 10 156.00 9 970.00 -1.8<br />
Green pepper 5 838.00 7 228.00 8 053.00 8 286.00 7 055.00 -14.9<br />
Onion 6 388.00 7 219.00 7 388.00 7 690.00 7 163.00 -6.9<br />
Toyota hilux 262 815 004.00 261 428 640.00 256 130 749.00 274 202 994.00 274 202 994.00 0.0<br />
Toyota corolla 219 438 028.00 218 280 480.00 213 856 821.00 228 946 458.00 228 946 458.00 0.0<br />
Nissan sunny 147 837 020.00 147 244 175.00 143 771 175.00 151 135 820.00 153 241 220.00 1.4<br />
Nissan Pick Up 132 272 680.00 131 770 964.00 128 461 850.00 135 224 100.00 137 431 523.00 1.6<br />
Air fare Lusaka/London 5 324 400.00 5 304 680.00 6 784 000.00 6 912 000.00 6 070 000.00 -12.2<br />
Source: CSO, Prices Statistics, <strong>2012</strong><br />
7 | P a g e
<strong>2012</strong><br />
2011<br />
All Items<br />
Food &<br />
Nonalcoholic<br />
beverages<br />
Alcoholic<br />
beverages<br />
&<br />
Tobacco<br />
ALL ITEMS CONSUMER PRICE INDEX (CPI) AND ANNUAL INFLATION RATES<br />
Clothing<br />
&<br />
footwear<br />
Housing,<br />
Water,<br />
Electricity,<br />
Gas &<br />
Other fuels<br />
Consumer Price Index (2009 = 100)<br />
Furnishings,<br />
Household<br />
Equip..,<br />
Routine Hse<br />
Mtc Health Transport Communication<br />
Recreation<br />
& Culture<br />
Education<br />
Restaurant<br />
& Hotel<br />
Miscellaneous<br />
Goods &<br />
Services<br />
Inflation<br />
Rate (%)<br />
<strong>Monthly</strong><br />
Inflation<br />
Rate<br />
(%)<br />
Annual<br />
Weight 1 000.00 534.85 15.21 80.78 114.11 82.36 8.15 58.08 12.94 13.84 26.62 3.37 49.69<br />
January 111.61 108.85 106.60 111.87 126.48 111.21 <strong>112</strong>.63 111.78 102.64 109.21 111.60 <strong>112</strong>.10 111.53 0.7 6.3<br />
February <strong>112</strong>.36 109.37 107.29 113.49 128.59 111.40 114.40 <strong>112</strong>.43 102.66 109.58 <strong>112</strong>.12 <strong>112</strong>.15 111.62 0.7 6.5<br />
March 113.56 110.50 107.05 115.33 129.95 <strong>112</strong>.03 114.96 114.86 102.80 109.85 114.20 115.35 <strong>112</strong>.21 1.1 6.6<br />
April 114.24 111.11 108.95 118.31 129.76 111.94 116.98 116.07 102.89 110.46 114.15 115.79 <strong>112</strong>.40 0.6 6.3<br />
May 114.56 110.97 108.33 119.16 130.95 113.37 117.78 117.03 102.87 113.12 113.23 116.37 <strong>112</strong>.46 0.3 6.3<br />
June 114.52 110.31 108.49 119.96 131.68 114.42 118.29 117.06 102.91 <strong>112</strong>.67 115.03 118.32 113.09 0.0 6.1<br />
<strong>July</strong> 115.89 111.93 108.52 120.70 132.16 116.40 118.40 119.38 102.89 114.12 116.22 115.46 114.02 1.2 6.9<br />
August 116.60 <strong>112</strong>.09 108.32 122.38 134.66 117.00 119.03 121.49 102.90 115.67 115.81 117.33 114.13 0.6 6.5<br />
September 117.01 <strong>112</strong>.48 108.09 121.39 135.65 119.01 119.87 121.66 102.64 115.44 116.87 116.62 113.67 0.4 6.6<br />
October 116.80 <strong>112</strong>.21 109.74 121.18 134.22 119.98 118.32 121.19 102.65 116.27 117.10 116.59 114.31 -0.2 6.7<br />
November 116.94 <strong>112</strong>.71 109.33 121.08 133.87 119.61 120.33 119.16 102.79 117.52 118.15 118.61 114.36 0.1 6.4<br />
December 117.47 113.39 109.15 121.69 134.61 118.56 120.12 120.78 102.71 116.84 118.36 116.97 115.29 0.5 6.0<br />
January 118.77 115.48 109.11 122.24 134.20 119.04 121.79 121.27 103.76 117.93 121.18 117.96 115.01 1.1 6.4<br />
February 119.09 115.41 110.41 122.74 134.71 119.96 122.84 122.46 104.05 118.03 122.87 117.95 115.86 0.3 6.0<br />
March 120.84 117.59 110.77 124.43 136.32 120.67 123.52 123.83 104.05 118.70 123.27 118.86 117.53 1.5 6.4<br />
April 121.63 118.22 111.61 125.91 137.21 121.89 124.26 124.47 104.12 119.31 123.56 119.57 118.67 0.7 6.5<br />
May 122.11 118.56 111.92 126.32 137.95 123.06 124.42 124.74 104.02 121.15 123.79 120.13 119.50 0.4 6.6<br />
June 122.16 118.11 <strong>112</strong>.38 126.48 138.81 123.47 123.63 125.64 103.92 121.77 124.75 120.77 120.58 0.0 6.7<br />
<strong>July</strong> 123.06 119.00 114.16 127.43 139.17 124.38 124.80 126.47 104.61 122.33 127.37 120.77 121.79 0.7 6.0<br />
Source: CSO, Prices Statistics, <strong>2012</strong><br />
8 | P a g e
Consumer Index Numbers <strong>of</strong> Consumer Prices - Food and Non-Food (National) 2009 = 100<br />
Period Total Food CPI Non-Food CPI<br />
Weight 1000.0 534.9 465.2<br />
2010 January 105.01 104.43 105.67<br />
February 105.47 104.87 106.15<br />
March 106.55 106.13 107.03<br />
April 107.48 107.11 107.90<br />
May 107.74 107.23 108.34<br />
June 107.93 106.26 109.85<br />
<strong>July</strong> 108.45 106.57 110.62<br />
August 109.45 105.97 113.44<br />
September 109.72 106.05 113.93<br />
October 109.44 105.60 113.86<br />
November 109.92 106.36 114.02<br />
December 110.86 107.65 114.56<br />
December 110.86 107.65 114.56<br />
2011 January 111.61 108.85 114.78<br />
February <strong>112</strong>.36 109.37 115.80<br />
March 113.56 110.50 117.09<br />
April 114.24 111.11 117.83<br />
May 114.56 110.97 118.67<br />
June 114.52 110.31 119.37<br />
<strong>July</strong> 115.89 111.93 120.45<br />
August 116.60 <strong>112</strong>.09 121.78<br />
September 117.01 <strong>112</strong>.48 122.22<br />
October 116.80 <strong>112</strong>.21 122.08<br />
November 116.94 <strong>112</strong>.71 121.80<br />
December 117.47 113.39 122.17<br />
<strong>2012</strong> January 118.77 115.48 122.54<br />
February 119.09 115.41 123.33<br />
March 120.84 117.59 124.56<br />
April 121.63 118.22 125.54<br />
May 122.11 118.56 126.20<br />
June 122.16 118.11 126.82<br />
<strong>July</strong> 123.06 119.00 127.73<br />
Source: CSO, Prices Statistics, <strong>2012</strong><br />
9 | P a g e
INTERNATIONAL MERCHANDIZE TRADE<br />
June <strong>2012</strong> records Trade Surplus<br />
<strong>Zambia</strong> recorded a trade surplus valued<br />
at K113.6 Billion in June <strong>2012</strong> from K 278.3<br />
Billion recorded in May <strong>2012</strong>, representing<br />
a decline <strong>of</strong> 59.2 percent. This means that<br />
the country exported more in June <strong>2012</strong><br />
than it imported in nominal terms, despite<br />
the decline in the trade surplus.<br />
Since January <strong>2012</strong> the country has had<br />
monthly trade surpluses with the highest<br />
valued at K351.2 Billion recorded in<br />
January <strong>2012</strong>, followed by K278.3 Billion in<br />
May <strong>2012</strong> and the lowest in February <strong>2012</strong>,<br />
valued at K47.4 Billion.<br />
Total Exports (fob) and Imports (cif), January to June <strong>2012</strong>*, (K’ Millions)<br />
Months Imports(cif) Domestic Exports(fob) Re-Exports(fob) Total Exports(fob) Trade Balance<br />
January 4,004,039 4,240,009 115,272 4,355,280 351,242<br />
February 3,573,649 3,564,055 56,947 3,621,001 47,352<br />
March 3,509,458 3,501,714 87,354 3,589,068 79,611<br />
Quarter 1 11,087,146 11,305,777 259,572 11,565,350 478,204<br />
April 3,332,865 3,405,026 57,443 3,462,470 129,605<br />
May® 3,690,939 3,862,551 106,664 3,969,215 278,276<br />
June* 3,370,603 3,187,923 296,309 3,484,232 113,629<br />
Quarter 2 10,394,407 10,455,500 460,416 10,915,917 521,510<br />
Total (Q1+Q2) 21,481,552 21,761,278 719,989 22,481,266 999,714<br />
Source: CSO, International Trade Statistics, <strong>2012</strong><br />
<strong>The</strong>se trade data are compiled based on the General Trade System<br />
Note: (*) Provisional<br />
(®) Rev<br />
Exports by Major Product Categories, June and May <strong>2012</strong><br />
<strong>Zambia</strong>’s major export products in June<br />
<strong>2012</strong> were from the Intermediate goods<br />
category (mainly comprising copper<br />
cathodes and sections <strong>of</strong> refined<br />
copper) accounting for about 78.9<br />
percent. Other exports were from the<br />
Capital goods, Consumer goods and<br />
Raw materials categories; which<br />
collectively accounted for 21.1 percent<br />
<strong>of</strong> total exports in June <strong>2012</strong>. This implies<br />
that between June and May <strong>2012</strong>, the<br />
country has been a net exporter <strong>of</strong><br />
Intermediate goods, mainly metals and<br />
their articles, accounting for an average<br />
<strong>of</strong> 78.5 percent <strong>of</strong> the total exports for the<br />
two months.<br />
Exports by Major Product Categories June and May <strong>2012</strong><br />
Description<br />
June <strong>2012</strong>* May <strong>2012</strong>®<br />
Value (k'million) % Share Value (k'million) % Share<br />
Consumer Goods 477,774 13.7 364,750 9.2<br />
Raw Materials 140,398 4.0 136,300 3.4<br />
Intermediate Goods 2,747,841 78.9 3,102,778 78.2<br />
Capital Goods 118,218 3.4 365,388 9.2<br />
Total: 3,484,232 100.0 3,969,215 100.0<br />
Source: CSO, International Trade Statistics, <strong>2012</strong><br />
Note: (*) Provisional<br />
(®) Revised<br />
10 | P a g e
<strong>Zambia</strong>’s Metal Exports and Non-Traditional Exports (NTEs) June and May<br />
<strong>2012</strong><br />
<strong>The</strong>re has been a decrease in the total<br />
value <strong>of</strong> exports from K3, 969.2 Billion in<br />
May <strong>2012</strong> to K3, 484.2 Billion in June <strong>2012</strong>.<br />
<strong>The</strong> overall contribution <strong>of</strong> Metals and<br />
their products to the total export earnings<br />
in June and May <strong>2012</strong> averaged about<br />
69.5 percent. <strong>The</strong> share <strong>of</strong> NTEs recorded<br />
an average <strong>of</strong> about 30.5 percent in<br />
revenue earnings between June and<br />
May <strong>2012</strong>.<br />
<strong>Zambia</strong>’s Metal Exports and Non-Traditional Exports (NTEs) May and April <strong>2012</strong><br />
June <strong>2012</strong>* May <strong>2012</strong><br />
GROUP<br />
Value (k'million) % Share Value (k'million) % Share<br />
Traditional Exports (mainly Metals) 2,448,769 70.3 2,725,563 68.7<br />
Non-Traditional Exports 1,035,463 29.7 1,243,652 31.3<br />
Total Exports 3,484,232 100.0 3,969,215 100.0<br />
Source: CSO, International Trade Statistics, <strong>2012</strong><br />
Note: (*) Provisional<br />
(®) Revised<br />
<strong>Zambia</strong>’s Major Export Destinations by Commodity in June <strong>2012</strong><br />
<strong>Zambia</strong>’s major export destination in<br />
June <strong>2012</strong> was Switzerland, which<br />
accounted for 33.2 percent. <strong>The</strong> major<br />
export products were Cathodes &<br />
Sections <strong>of</strong> Cathodes <strong>of</strong> refined Copper<br />
accounting for 82.1 percent.<br />
China was the second major destination<br />
<strong>of</strong> <strong>Zambia</strong>’s exports accounting for 19.3<br />
percent <strong>of</strong> the total export earnings. <strong>The</strong><br />
major export product was copper blister<br />
(92.9 percent).<br />
South Africa was the third major export<br />
destination accounting for 8.6 percent.<br />
<strong>The</strong> main export products were Cathodes<br />
& Sections <strong>of</strong> Cathodes <strong>of</strong> refined<br />
Copper which contributed 26.1 percent<br />
to the Country’s total exports.<br />
<strong>The</strong> fourth major destination was Congo<br />
(DR), accounting for 5.4 percent. <strong>The</strong><br />
main export product was Sulphuric Acid<br />
(18.4 percent).<br />
<strong>The</strong> fifth major export destination was the<br />
United Kingdom, accounting for 5.0<br />
percent. <strong>The</strong> major export products were<br />
Cathodes & Sections <strong>of</strong> Cathodes <strong>of</strong><br />
refined Copper, which accounted for<br />
98.3 percent.<br />
<strong>The</strong>se five countries collectively<br />
accounted for 71.5 percent <strong>of</strong> <strong>Zambia</strong>’s<br />
total export earnings in June <strong>2012</strong>.<br />
11 | P a g e
<strong>Zambia</strong>'s Five Major Export Destinations by Product for June <strong>2012</strong>*<br />
Country / Hs-<br />
Code<br />
12 | P a g e<br />
Description<br />
June <strong>2012</strong><br />
Value<br />
(K'Million)<br />
%<br />
Share<br />
SWITZERLAND 1,155,501 100.0<br />
74031100 Cathodes and sections <strong>of</strong> cathodes <strong>of</strong> refined copper 949,099 82.1<br />
74031910 Copper Blister 103,381 8.9<br />
74091900 Plates, sheets and strip, <strong>of</strong> refined copper, uncoiled, >0.15mm thick 96,362 8.3<br />
14042000 Cotton linters 4,066 0.4<br />
52010000 Cotton, not carded or combed 2,541 0.2<br />
26020000 Manganese ores/concentrates(inc.ferruginous), with manganese cont.<strong>of</strong>=>20% 53 0.0<br />
% <strong>of</strong> Total June Exports 33.2<br />
CHINA 673,051 100.0<br />
74031910 Copper blister 625,100 92.9<br />
74031100 Cathodes and sections <strong>of</strong> cathodes <strong>of</strong> refined copper 38,485 5.7<br />
26020000 Manganese ores/concentrates(inc.ferruginous), with manganese cont.<strong>of</strong>=>20% 4,598 0.7<br />
26030000 Copper ores and concentrates 1,674 0.2<br />
74032900 Copper (excl. master) alloys, nes, unwrought 1,400 0.2<br />
44079900 Wood, nes sawn or chipped lengthwise, sliced or peeled, >6mm thick 1,209 0.2<br />
25309000 Other mineral substances, nes 181 0.0<br />
03019900 Other live fish 132 0.0<br />
44071000 Coniferous wood sawn or chipped lengthwise, sliced or peeled, >6mm thick 106 0.0<br />
71031000 Precious (excl. diamonds) or semi-precious stones, unworked 102 0.0<br />
Other Products 65 0.0<br />
% <strong>of</strong> Total June Exports 19.3<br />
SOUTH AFRICA 299,950 100.0<br />
74031100 Cathodes and sections <strong>of</strong> cathodes <strong>of</strong> refined copper 78,395 26.1<br />
81059000 Other: Articles <strong>of</strong> cobalt, nes 63,100 21.0<br />
74081100 Wire <strong>of</strong> refined copper, maximum cross-sectional dimension >6mm 59,696 19.9<br />
71081300 Semi-manufactured gold (incl. gold plated with platinum), non-monetary 31,129 10.4<br />
85444900 Electric conductors, nes, for a voltage
Country / Hs-<br />
Code<br />
Description<br />
June <strong>2012</strong><br />
Value<br />
(K'Million)<br />
% <strong>of</strong> Total June Exports 5.4<br />
%<br />
Share<br />
UNITED KINGDOM 175,130 100.0<br />
74031100 Cathodes and sections <strong>of</strong> cathodes <strong>of</strong> refined copper 172,184 98.3<br />
06031100 Fresh cut Roses and buds 1,410 0.8<br />
07109000 Mixtures <strong>of</strong> vegetables, frozen 1,000 0.6<br />
04090000 Natural honey 230 0.1<br />
41139000 Leather further prepared after tanning or crusting...Other 199 0.1<br />
90328900 Automatic regulating or controlling instruments and apparatus, nes 55 0.0<br />
New stamps; stamp-impressed paper; cheque forms; banknotes, etc -<br />
49070010<br />
postage,revenue stamp 22 0.0<br />
97050000 Collections and collector's pieces <strong>of</strong> zoological... interest 14 0.0<br />
99030000 Single consignment non commercial goods 7 0.0<br />
63090000 Worn clothing and other worn articles 4 0.0<br />
Other Products 6 0.0<br />
% <strong>of</strong> Total June Exports 5.0<br />
Other Destination 991,877 28.5<br />
Total Value <strong>of</strong> June Exports 3,484,232<br />
Source: CSO, International Trade Statistics, <strong>2012</strong><br />
Note: (*) Provisional<br />
(R) Revised figures<br />
Export Market Shares by Regional Groupings, June and May <strong>2012</strong><br />
<strong>The</strong> Southern African Development<br />
Community (SADC) regional grouping<br />
was the largest market for <strong>Zambia</strong>’s total<br />
exports, accounting for 26.0 percent in<br />
June <strong>2012</strong>. Within SADC, South Africa was<br />
the dominant market in June <strong>2012</strong> with<br />
33.1 percent. Other notable markets in<br />
SADC were Congo (DR), Tanzania<br />
Zimbabwe and Mauritius.<br />
Asia was the second largest market for<br />
<strong>Zambia</strong>’s total exports accounting for<br />
23.3 percent in June <strong>2012</strong>. Within Asia,<br />
China was the dominant market with 82.9<br />
percent in June <strong>2012</strong>. Other notable<br />
markets in Asia were United Arab<br />
Emirates, Hong Kong, India and<br />
Singapore.<br />
<strong>The</strong> Common Market for Eastern and<br />
Southern Africa (COMESA) was the third<br />
largest market for <strong>Zambia</strong>’s total exports,<br />
accounting for 13.1 percent in June <strong>2012</strong>.<br />
Within COMESA, Congo (DR) was the<br />
dominant market with 41.4 percent.<br />
Other notable markets in COMESA were<br />
Zimbabwe, Mauritius and Malawi<br />
<strong>The</strong> European Union (EU) was the fourth<br />
largest market for <strong>Zambia</strong>’s total exports<br />
accounting for 6.3 percent in June <strong>2012</strong>.<br />
Within the EU, the United Kingdom was<br />
the dominant market with 79.9 percent in<br />
June <strong>2012</strong>. Other notable markets were<br />
Belgium, Luxembourg and Netherlands.<br />
13 | P a g e<br />
Export Market Shares by Regional Groupings, June and May <strong>2012</strong> (K’ Millions)<br />
June <strong>2012</strong><br />
May <strong>2012</strong><br />
GROUPING<br />
Value %<br />
GROUPING<br />
Value %<br />
(K'Million) Share<br />
(K'Million) Share<br />
SADC 907,121 100.0 SADC 1,243,793 100.0<br />
SOUTH AFRICA 299,950 33.1 SOUTH AFRICA 540,351 43.4<br />
CONGO DR 188,722 20.8 CONGO DR 234,730 18.9<br />
TANZANIA, UNITED 181,469 20.0 ZIMBABWE 151,103 12.1<br />
ZIMBABWE 150,979 16.6 TANZANIA, UNITED 125,071 10.1<br />
MAURITIUS 39,917 4.4 MAURITIUS 45,932 3.7
June <strong>2012</strong><br />
May <strong>2012</strong><br />
GROUPING<br />
Value %<br />
GROUPING<br />
Value %<br />
(K'Million) Share<br />
(K'Million) Share<br />
Other SADC 46,083 5.1 Other SADC 146,607 11.8<br />
% <strong>of</strong> Total June Exports 26.0 % <strong>of</strong> Total May Exports 31.3<br />
ASIA 812,330 100.0 ASIA 660,697 100.0<br />
CHINA 673,051 82.9 CHINA 496,644 75.2<br />
UNITED ARAB EMIRATES 95,534 11.8 UNITED ARAB EMIRATES 99,263 15.0<br />
HONG KONG 24,013 3.0 INDIA 62,721 9.5<br />
INDIA 10,669 1.3 ISRAEL 662 0.1<br />
SINGAPORE 8,229 1.0 HONG KONG 572 0.1<br />
Other ASIA 834 0.1 Other ASIA 835 0.1<br />
% <strong>of</strong> Total June Exports 23.3 % <strong>of</strong> Total May Exports 16.6<br />
COMESA 456,138 100.0 COMESA 613,611 100.0<br />
CONGO DR 188,722 41.4 CONGO DR 234,730 38.3<br />
ZIMBABWE 150,979 33.1 ZIMBABWE 151,103 24.6<br />
MAURITIUS 39,917 8.8 KENYA 107,036 17.4<br />
MALAWI 36,109 7.9 MAURITIUS 45,932 7.5<br />
KENYA 14,789 3.2 ANGOLA 41,703 6.8<br />
Other COMESA 25622 5.6 Other COMESA 33108 5.4<br />
% <strong>of</strong> Total June Exports 13.1 % <strong>of</strong> Total May Exports 15.5<br />
EUROPEAN UNION 219,099 100.0 EUROPEAN UNION 243,347 100.0<br />
UNITED KINGDOM 175,130 79.9 UNITED KINGDOM 199,739 82.1<br />
BELGIUM 19,857 9.1 BELGIUM 24,143 9.9<br />
LUXEMBOURG 9,772 4.5 GERMANY 7,005 2.9<br />
NETHERLANDS 7,206 3.3 SWEDEN 6,170 2.5<br />
GERMANY 4,192 1.9 NETHERLANDS 5,917 2.4<br />
Other EU 2,943 1.3 Other EU 373 0.2<br />
% <strong>of</strong> Total June Exports 6.3 % <strong>of</strong> Total May Exports 6.1<br />
Total Value <strong>of</strong> June Exports<br />
(fob) 3,484,232<br />
Total Value <strong>of</strong> May Exports<br />
(fob) 3,969,215<br />
Source: CSO, International Trade Statistics, <strong>2012</strong><br />
Note: (*) Provisional<br />
(R) Revised figures<br />
Imports by Major Product Categories, June and May <strong>2012</strong><br />
<strong>Zambia</strong>’s major import products by<br />
category in June <strong>2012</strong> were Capital<br />
goods, accounting for 43.7 percent. <strong>The</strong><br />
Intermediate goods category was<br />
second with 30.6 percent, followed by<br />
Consumer goods with 16.4 percent. Raw<br />
materials were fourth with 9.2 percent. In<br />
June and May <strong>2012</strong>, the country has<br />
been a net importer <strong>of</strong> Capital goods,<br />
contributing an average <strong>of</strong> 41.4 percent<br />
to total imports in both months.<br />
Imports (cif) by Major Product Categories June and May <strong>2012</strong>, (K’ Millions)<br />
Description June <strong>2012</strong>* May <strong>2012</strong>(R)<br />
Value (k'million) % Share Value (k'million) % Share<br />
Consumer Goods 552,748 16.4 826,268 22.4<br />
Raw Materials 311,468 9.2 357,198 9.7<br />
Intermediate Goods 1,032,256 30.6 1,063,412 28.8<br />
Capital Goods 1,474,131 43.7 1,444,062 39.1<br />
Total: 3,370,603 100.0 3,690,939 100.0<br />
Source: CSO, International Trade Statistics, 2011 and <strong>2012</strong><br />
Note: (*) Provisional<br />
(R) Revised figures<br />
14 | P a g e
<strong>Zambia</strong>’s Major Import Sources by Commodity, June <strong>2012</strong><br />
<strong>The</strong> major source <strong>of</strong> <strong>Zambia</strong>’s imports in<br />
June <strong>2012</strong> was South Africa, accounting<br />
for 36.0 percent. <strong>The</strong> major import<br />
products were Dumpers <strong>of</strong> <strong>of</strong>f Highway<br />
use, contributing 5.2 percent to total<br />
imports.<br />
<strong>The</strong> second main source <strong>of</strong> <strong>Zambia</strong>’s<br />
imports in June <strong>2012</strong> was Congo (DR),<br />
accounting for 16.3 percent <strong>of</strong> the total<br />
value <strong>of</strong> imports. <strong>The</strong> major import<br />
products were Cobalt ores and<br />
Concentrates, accounting for 50.7<br />
percent.<br />
Other major sources <strong>of</strong> <strong>Zambia</strong>’s imports<br />
were China, Japan and <strong>The</strong> United States<br />
<strong>of</strong> America; jointly accounting for 16.3<br />
percent.<br />
<strong>The</strong>se five countries collectively<br />
accounted for 68.6 percent <strong>of</strong> <strong>Zambia</strong>’s<br />
total imports in June <strong>2012</strong>.<br />
Country /<br />
Hs-Code<br />
15 | P a g e<br />
<strong>Zambia</strong>’s Major Import Sources by Products, June <strong>2012</strong>* (K’ Millions)<br />
Description<br />
Value (K'Million)<br />
June <strong>2012</strong><br />
% Share<br />
SOUTH AFRICA 1,212,401 100.0<br />
87041000 Dumpers for <strong>of</strong>f-highway use 62,592 5.2<br />
84749000 Parts <strong>of</strong> machinery <strong>of</strong> 84.74 35,645 2.9<br />
28020010 Sulphur, sublimed or precipitated; colloidal sulphur - In bulk 30,840 2.5<br />
84295900 Self-propelled bulldozers, excavators..., nes 27,497 2.3<br />
Diesel Dual purpose vehicles for both persons & goods (twin cab,<br />
87042110 pickup) upto 5 tonnes 21,798 1.8<br />
87059000 Special purpose motor vehicles, nes (eg breakdown lorries, etc) 21,518 1.8<br />
84314900 Parts <strong>of</strong> machinery <strong>of</strong> 84.26, 84.29 and 84.30, nes 16,609 1.4<br />
Mineral or chemical fertilizers with nitrogen, phosphorus and<br />
31052000 potassium 15,980 1.3<br />
87012000 Road tractors for semi-trailers 15,254 1.3<br />
27101950 Cutting oil,grease cutting oils,cleaning oils etc. 14,487 1.2<br />
Other Products 950,180 78.4<br />
% <strong>of</strong> Total June Imports 36.0<br />
CONGO DR 548,678 100.0<br />
26050000 Cobalt ores and concentrates 278,302 50.7<br />
26030000 Copper ores and concentrates 110,778 20.2<br />
28220010 Cobalt oxides and hydroxides; commercial cobalt oxides in bulk 142,804 26.0<br />
87164000 Trailers and semi-trailers, nes 6,161 1.1<br />
28369910 Other carbonates; peroxocarbonates in bulk 4,027 0.7<br />
84314900 Parts <strong>of</strong> machinery <strong>of</strong> 84.26, 84.29 and 84.30, nes 1,990 0.4<br />
84128090 Engines and motors, nes - Other 1,634 0.3<br />
84295900 Self-propelled bulldozers, excavators..., nes 799 0.1<br />
2815<strong>112</strong>0 Sodium hydroxide (caustic soda), solid not in bulk 677 0.1<br />
84138100 Pumps for liquids, nes 178 0.0<br />
Other Products 1,327 0.2<br />
% <strong>of</strong> Total June Imports 16.3<br />
CHINA 307,036 100.0<br />
68091900 Boards..., <strong>of</strong> plaster or compositions based on plaster, nes 12,897 4.2<br />
84431300 Other <strong>of</strong>fset printing machinery 11,165 3.6<br />
73043100 Seamless iron/steel tubes/pipes/pr<strong>of</strong>iles, circular, cold-drawn... 7,895 2.6<br />
28399020 Other silicates (excl. <strong>of</strong> sodium and potassium) - NOT IN BULK 6,882 2.2<br />
84304100 Self-propelled boring or sinking machinery 6,645 2.2<br />
73158100 Stud-link <strong>of</strong> iron or steel 6,513 2.1
Country /<br />
Hs-Code<br />
87032390<br />
June <strong>2012</strong><br />
Description<br />
Value (K'Million) % Share<br />
Vehicles with engine capacity exceeding 1500cc but not exceeding<br />
3000cc - OTHER. 6,488 2.1<br />
73170090 Nails, tacks, drawing pins, corrugated nails... <strong>of</strong> iron or steel - Other 5,876 1.9<br />
84803000 Moulding patterns 5,868 1.9<br />
44109000 Other boards <strong>of</strong> wood, nes 5,658 1.8<br />
Other Products 231,150 75.3<br />
% <strong>of</strong> Total June Imports 9.1<br />
JAPAN 121,440 100.0<br />
87032390<br />
Vehicles with engine capacity exceeding 1500cc but not exceeding<br />
3000cc - OTHER. 39,158 32.2<br />
84295200 Self-propelled bulldozers... with a 360ø revolving superstructure 18,121 14.9<br />
87033390 Vehicles with diesel... engine <strong>of</strong> cylinder capacity >=2500cc - OTHER 17,167 14.1<br />
87032290<br />
Vehicles with engine capacity exceeding 1000cc but not exceeding<br />
1500cc:OTHER 16,542 13.6<br />
87042190<br />
Diesel Non dual purpose vehicles for either persons or goods upto 5<br />
tonnes 15,513 12.8<br />
87021090<br />
Motor vehicles for transport <strong>of</strong> persons sitting capacity more than 14<br />
(Diesel) 5,995 4.9<br />
40<strong>112</strong>000 New pneumatic tyres <strong>of</strong> rubber, <strong>of</strong> a kind used on buses or lorries 1,204 1.0<br />
87042300 Goods vehicles, with diesel or semi-diesel engines, gvw >20tonnes 1,046 0.9<br />
Tyres used on construction/industrial handling vehicles & machines<br />
40119400 with rim =< 61cm 1,027 0.8<br />
87032190 Other: Vehicles with spark-ignition engine <strong>of</strong> cylinder capacity
Congo (DR) was the dominant source <strong>of</strong><br />
<strong>Zambia</strong>’s imports, accounting for 72.9<br />
percent. Other sources were Kenya,<br />
Egypt, and Zimbabwe.<br />
Asia was the third largest source <strong>of</strong><br />
<strong>Zambia</strong>’s imports accounting for 22.0<br />
percent in June <strong>2012</strong>. Within Asia, China<br />
was the dominant source <strong>of</strong> <strong>Zambia</strong>’s<br />
imports with 41.4 percent in June <strong>2012</strong>.<br />
.<br />
Other notable markets were Japan<br />
United Arab Emirates and India.<br />
<strong>The</strong> European Union (EU) was the fourth<br />
largest source <strong>of</strong> <strong>Zambia</strong>’s imports<br />
accounting for 11.6 percent in June <strong>2012</strong>.<br />
Within the EU, the United Kingdom was<br />
the dominant source <strong>of</strong> <strong>Zambia</strong>’s imports<br />
accounting for 29.5 percent in June <strong>2012</strong>.<br />
Other notable markets were Sweden,<br />
Germany and Ireland<br />
Import Market shares by Major Regional Groupings, June and May <strong>2012</strong> (K’ Millions)<br />
GROUPING<br />
June <strong>2012</strong>*<br />
May <strong>2012</strong><br />
GROUPING<br />
Value (K'Million) % Share Value (K'Million) % Share<br />
SADC 1,882,077 100.0 SADC 1,965,834 100.0<br />
SOUTH AFRICA 1,212,401 64.4 SOUTH AFRICA 1,349,507 68.6<br />
CONGO (DR) 548,678 29.2 CONGO (DR) 494,767 25.2<br />
ZIMBABWE 42,947 2.3 ZIMBABWE 42,464 2.2<br />
MAURITIUS 17,863 0.9 MAURITIUS 15,316 0.8<br />
MALAWI 12,540 0.7 BOTSWANA 12,757 0.6<br />
Other SADC 47,647 2.5 Other SADC 51,024 2.6<br />
% <strong>of</strong> Total June Imports 55.8 % <strong>of</strong> Total May Imports 53.3<br />
COMESA 752,879 100.0 ASIA 1,108,814 100.0<br />
CONGO (DR) 548,678 72.9 KUWAIT 354,340 32.0<br />
KENYA 66,642 8.9 CHINA 267,405 24.1<br />
EGYPT 50,602 6.7 INDIA 148,469 13.4<br />
ZIMBABWE 42,947 5.7 UNITED ARAB EMIRATES 98,742 8.9<br />
MAURITIUS 17,863 2.4 JAPAN 77,797 7.0<br />
Other COMESA 26,145 3.5 Other ASIA 162,061 14.6<br />
% <strong>of</strong> Total June Imports 22.3 % <strong>of</strong> Total May Imports 30.0<br />
ASIA 741,468 100.0 COMESA 642,932 100.0<br />
CHINA 307,036 41.4 CONGO (DR) 494,767 77.0<br />
JAPAN 121,440 16.4 ZIMBABWE 42,464 6.6<br />
UNITED ARAB EMIRATES 113,757 15.3 EGYPT 37,749 5.9<br />
INDIA 93,522 12.6 KENYA 31,619 4.9<br />
INDONESIA 25,202 3.4 MAURITIUS 15,316 2.4<br />
Other ASIA 80,510 10.9 Other COMESA 21,016 3.3<br />
% <strong>of</strong> Total June Imports 22.0 % <strong>of</strong> Total May Imports 17.4<br />
EUROPEAN UNION 389,582 100.0 EUROPEAN UNION 310,885 100.0<br />
UNITED KINGDOM 114,830 29.5 UNITED KINGDOM 75,789 24.4<br />
SWEDEN 60,254 15.5 GERMANY 50,570 16.3<br />
GERMANY 50,427 12.9 SWEDEN 47,871 15.4<br />
IRELAND 47,383 12.2 FRANCE 36,485 11.7<br />
FRANCE 20,434 5.2 IRELAND 26,839 8.6<br />
Other EU 96,253 24.7 Other EU 73,332 23.6<br />
% <strong>of</strong> Total June Imports 11.6 % <strong>of</strong> Total May Imports 8.4<br />
Total Value <strong>of</strong> June Imports (cif) 3,370,603 Total Value <strong>of</strong> May Imports (cif) 3,690,939<br />
Source: CSO, International Trade Statistics, 2011and <strong>2012</strong><br />
Note: (*) Provisional<br />
(R) Revised figures<br />
17 | P a g e
2010 CENSUS OF POPULATION AND HOUSING<br />
<strong>Zambia</strong>’s young population, potential for continued future growth<br />
<strong>Zambia</strong> has a very young population that<br />
will ensure continued growth into the<br />
future, even when fertility levels have<br />
been reduced. Final population results<br />
show that 45.4 percent <strong>of</strong> the population<br />
is aged 0-14 years. <strong>The</strong> population aged<br />
0-14 years make up 48.6 percent <strong>of</strong> the<br />
total rural population and 40.5 percent <strong>of</strong><br />
the total urban population.<br />
At province level, the province with the<br />
highest percentage <strong>of</strong> its total population<br />
in the age group 0-14 is North Western<br />
Province at 48.8 percent, followed by<br />
Northern Province at 48.7 percent and<br />
Muchinga Province at 48.6 percent.<br />
Lusaka Province at 40.4 percent has the<br />
lowest percentage <strong>of</strong> its total population<br />
in the age group 0-4 years.<br />
Percentage <strong>of</strong> the total population that is aged 0-14 years by Region and Province,<br />
<strong>Zambia</strong> 2010<br />
Total<br />
Rural<br />
Urban<br />
40.5<br />
45.4<br />
48.6<br />
North Western<br />
Northern<br />
Muchinga<br />
Luapula<br />
Southern<br />
Eastern<br />
<strong>Central</strong><br />
Western<br />
Copperbelt<br />
Lusaka<br />
40.9<br />
40.4<br />
48.8<br />
48.7<br />
48.6<br />
47.9<br />
47.5<br />
47.3<br />
46.6<br />
46.5<br />
Source: <strong>Zambia</strong> 2010 Census <strong>of</strong> Population and Housing<br />
This high percentage <strong>of</strong> the total<br />
population that is aged 0-14 is a result <strong>of</strong><br />
high birth rates, which have continued to<br />
contribute to the high population growth<br />
rates experienced by <strong>Zambia</strong> over time.<br />
Future population growth and trends will<br />
be highly influenced by this young<br />
Trends in <strong>Zambia</strong>’s total population, 1969-2010<br />
population. <strong>The</strong> theme for this year’s<br />
World Population Day commemoration,<br />
“universal access to reproductive health<br />
services” resonates well with <strong>Zambia</strong>’s<br />
current and future demographic trends,<br />
as well as the need for the country to<br />
attain sustainable population growth.<br />
18 | P a g e
SELECTED SOCIO-ECONOMIC INDICATORS<br />
POPULATION 2000 to 2010<br />
2000 2001 2002 2003 2004 2005 2006 2007 2008 2009 2010<br />
Total Population 9,885,591 10,089,492 10,409,441 10,744,380 11,089,691 11,441,461 11,798,678 12,160,516 12,525,791 12,896,830 13,092,666<br />
Population Growth<br />
Rate<br />
2.5 3.1 3.1 3.1 3.1 3.1 3 3 2.9 2.9 2.8<br />
Life Expectancy at<br />
Birth<br />
50 51.8 51.9 52.4 52.4 52.6 51.9 51.4 51.3 51.2 -<br />
POPULATION BY PROVINCE<br />
<strong>Central</strong> 1,012,257 1,032,574 1,066,992 1,103,387 1,141,256 1,180,124 1,219,980 1,260,491 1,301,776 1,343,835 1,307,111<br />
Copperbelt 1,581,221 1,611,569 1,662,155 1,714,225 1,767,165 1,820,443 1,874,081 1,927,576 1,980,824 2034012 1,972,317<br />
Eastern** 1,231,283 1,348,070 1,391,690 1,436,120 1,482,290 1,530,118 1,579,960 1,631,890 1,684,910 1,740,180 1,592,661<br />
Luapula 775,353 791,067 817,326 845,076 873,969 903,746 934,317 965,605 997,579 1,030,572 991,927<br />
Lusaka 1,391,329 1,413,010 1,453,690 1,495,730 1,538,000 1,579,769 1,620,730 1,660,070 1,697,730 1,733,830 2,191,225<br />
Muchinga* 524,186 - - - - - - - - - 711,657<br />
Northern** 809,400 1,277,250 1,315,650 1,357,540 1,401,340 1,445,730 1,490,330 1,534,170 1,577,310 1,619,980 1,105,824<br />
North-western 583,350 596,010 616,496 638,004 660,322 683,367 707,074 731,351 756,261 781,800 727,044<br />
Southern 1,212,124 1,235,134 1,275,470 1,318,161 1,362,382 1,407,433 1,453,324 1,499,462 1,545,880 1,592,864 1,589,926<br />
Western 765,088 774,929 795,247 816,983 839,757 863294 887,540 912,226 937,419 963,107 902,974<br />
Source:<br />
Note:<br />
CSO, Population Projections Report<br />
2000 figures are from the 2000 Census <strong>of</strong> Population and Housing while the 2001 to 2009 figures are Population Projections from the Projections Report. <strong>The</strong> 2010 figures are final 2010 Census <strong>of</strong><br />
Population and Housing figures.<br />
*Muchinga was created in 2011<br />
**2000 Census figures were adjusted following the new provincial demarcations<br />
19 | P a g e
20 | P a g e<br />
PERCENTAGE CHANGES IN G.D.P. BY KIND OF ECONOMIC ACTIVITY - CONSTANT 1994 PRICES<br />
KIND OF ECONOMIC ACTIVITY 2000 2001 2002 2003 2004 2005 2006 2007 2008 2009 2010 2011*<br />
Agriculture, Forestry and Fishing 1.6 (2.6) (1.7) 5.0 4.3 (0.6) 2.2 0.4 2.6 7.2 6.6 7.7<br />
Agriculture 1.0 (6.0) (6.3) 8.0 6.1 (4.0) 3.0 (2.7) 1.9 12.4 13.6 13.3<br />
Forestry 4.0 4.3 4.3 4.3 4.3 3.6 1.4 3.7 3.7 3.7 3.7 3.7<br />
Fishing (1.0) (5.0) (0.7) (0.7) (0.7) 0.5 1.8 1.8 1.8 1.8 (7.0) (2.0)<br />
Mining and Quarrying 0.1 14.0 16.4 3.4 13.9 7.9 7.3 3.6 2.5 20.3 15.2 (5.2)<br />
Metal Mining (0.3) 15.0 17.1 3.3 13.5 7.1 9.0 4.4 2.5 19.7 16.0 (5.3)<br />
Other mining and quarrying 13.3 (15.0) (13.0) 10.7 35.8 42.9 (45.8) (45.5) (3.5) 99.6 (48.8) 7.4<br />
PRIMARY SECTOR 1.1 1.9 3.8 4.5 7.5 2.5 4.1 1.7 2.5 12.4 10.2 2.0<br />
Manufacturing 3.6 4.2 5.7 7.6 4.7 2.9 5.7 3.0 1.8 2.2 4.2 7.7<br />
Food, Beverages and Tobacco 0.6 5.3 5.4 8.6 5.8 3.6 8.9 7.6 3.0 4.9 7.4 9.0<br />
Textile, and leather industries 2.2 2.3 6.2 3.2 (1.9) (2.9) (1.3) (19.5) (23.6) (20.0) (56.8) (58.1)<br />
Wood and wood products (0.3) 5.7 7.5 11.4 4.2 3.6 0.7 3.7 12.1 2.6 13.4 6.5<br />
Paper and Paper products (1.3) 3.8 2.2 8.2 2.5 10.6 0.3 0.7 29.3 6.2 22.7 17.5<br />
Chemicals, rubber and plastic products 41.2 4.3 10.0 4.9 8.5 3.2 4.6 4.2 5.2 (0.3) 2.7 6.8<br />
Non-metallic mineral products 4.5 3.5 1.7 14.9 14.4 7.4 (5.2) 2.3 5.0 11.7 13.0 23.1<br />
Basic metal products 4.3 (18.0) 4.3 15.1 3.1 (2.0) 1.9 (4.8) 23.0 (4.8) (2.0) (1.4)<br />
Fabricated metal products 11.3 (8.0) (4.0) 5.3 4.8 7.4 5.0 7.8 (2.5) (3.4) 12.8 18.9<br />
Electricity, Gas and Water 1.2 12.6 (5.2) 0.4 (1.7) 5.4 10.5 1.0 (1.2) 6.8 7.4 8.2<br />
Construction 6.5 11.5 17.4 21.6 20.5 21.2 14.4 20.0 8.7 9.5 8.1 8.5<br />
SECONDARY SECTOR 4.0 7.5 7.2 10.8 9.1 10.0 9.8 10.0 4.7 6.2 6.5 8.2<br />
Wholesale and Retail Trade 2.3 5.4 5.0 6.1 5.0 2.4 2.0 2.4 2.7 2.3 4.2 7.2<br />
Restaurants, Bars and Hotels 12.3 24.4 4.9 6.9 6.4 11.7 16.1 9.6 5.0 (13.4) 10.2 7.8<br />
Transport, Storage and Communications 2.4 2.8 1.8 4.8 6.4 11.0 22.1 19.2 15.8 7.6 14.9 12.9<br />
Rail Transport 3.6 7.6 6.0 (8.1) (1.8) (11.6) (2.6) (18.7) (20.2) (23.8) 13.1 (17.8)<br />
Road Transport 1.9 0.5 1.9 3.9 4.2 6.3 6.4 6.4 13.2 13.3 6.3 9.3<br />
Air Transport 6.3 10.6 (8.4) 3.9 18.1 10.8 33.5 24.1 13.7 (23.4) 19.1 12.8<br />
Communications 0.6 0.6 7.9 10.0 5.0 23.2 40.5 33.6 21.1 19.4 20.0 16.0<br />
Financial Institutions and Insurance (0.6) 0.1 3.5 3.5 3.5 3.3 4.0 4.1 8.7 5.2 6.0 4.9<br />
Real Estate and Business services 17.0 3.5 4.4 4.0 4.0 3.2 3.2 3.1 3.0 2.8 3.0 2.9<br />
Community, Social and Personal Services (0.5) 5.8 1.6 1.6 0.6 11.4 9.0 12.5 11.7 8.6 5.3 8.4<br />
Public Administration & Defence/Public sanitary services (0.7) 1.0 (1.0) 0.2 0.2 6.2 (8.7) 14.8 2.2 0.4 (3.1) 10.6<br />
Education (0.7) 13.5 7.0 3.0 0.3 22.2 35.3 13.6 19.6 15.2 11.8 7.5<br />
Health (0.7) 16.5 1.0 2.5 (0.8) (2.2) 5.2 1.0 18.3 7.7 7.2 13.3<br />
Recreation, Religious, Culture (0.7) 10.0 (2.0) 4.5 4.3 34.1 22.8 9.3 26.7 17.7 5.0 2.8<br />
Personal Services 3.5 3.5 3.5 3.5 3.5 3.5 3.5 3.5 3.5 3.5 3.5 3.5<br />
TERTIARY SECTOR 4.1 4.7 3.8 4.5 4.2 5.4 6.7 7.1 7.2 3.9 6.6 7.6<br />
Less: FISIM 2.5 2.5 2.5 2.5 2.5 2.5 2.5 2.5 2.5 3.3 2.3 2.3<br />
TOTAL GROSS VALUE ADDED 3.4 4.6 4.6 6.0 6.2 5.8 7.0 6.7 5.7 6.4 7.6 6.6<br />
Taxes less subsidies on Products 4.6 7.0 (6.7) (2.7) (2.7) (0.1) (3.1) (0.3) 5.7 6.4 7.6 6.6<br />
TOTAL G.D.P. AT MARKET PRICES 3.5 4.9 3.3 5.1 5.4 5.3 6.2 6.2 5.7 6.4 7.6 6.6<br />
Source: CSO; National Accounts<br />
*Revised Estimates
GDP BY KIND OF ECONOMIC ACTIVITY AT CURRENT PRICES (K' BILLION)<br />
KIND OF ECONOMIC ACTIVITY 2000 2001 2002 2003 2004 2005 2006 2007 2008 2009 2010 2011<br />
Agriculture, Forestry and Fishing 2,002.2 2,582.0 3,247.4 4,244.6 5,568.2 6,723.6 7,800.2 9,139.5 10,863.8 13,461.4 15,642.3 18,072.4<br />
Agriculture 561.1 627.3 749.8 1,008.2 1,249.5 1,421.7 1,537.0 1,575.1 1,826.4 2,344.3 2,801.4 3,329.4<br />
Forestry 1,285.0 1,778.5 2,274.3 2,960.3 3,998.5 4,920.3 5,855.7 7,127.7 8,531.6 10,528.8 12,265.5 14,151.6<br />
Fishing 156.1 176.3 223.3 276.1 320.2 381.6 407.5 436.7 505.8 588.2 575.3 591.5<br />
Mining and Quarrying 416.1 518.9 575.1 564.8 809.6 1,030.9 1,612.5 2,037.2 1,998.9 1,682.1 2,837.8 3,346.3<br />
Metal Mining 407.9 511.3 568.8 558.2 798.3 1,011.7 1,597.5 2,027.2 1,989.8 1,669.3 2,828.1 3,333.4<br />
Other Mining and Quarrying 8.2 7.6 6.3 6.6 11.3 19.1 15.0 9.9 9.2 12.9 9.6 12.8<br />
PRIMARY SECTOR 2,418.4 3,101.0 3,822.5 4,809.4 6,377.7 7,754.5 9,412.8 11,176.7 12,862.7 15,143.5 18,480.0 21,418.7<br />
Manufacturing 1,024.6 1,293.1 1,693.6 2,241.0 2,827.7 3,430.2 4,015.7 4,487.4 5,149.6 6,016.9 6,770.8 7,769.1<br />
Food, Beverages and Tobacco 613.9 768.4 1,033.4 1,397.2 1,726.6 2,121.0 2,423.5 2,745.1 3,218.4 3,859.0 4,358.0 4,982.6<br />
Textile, and Leather Industries 180.4 224.2 284.5 352.9 450.7 500.4 630.8 611.4 506.7 445.2 214.5 98.7<br />
Wood and Wood Products 64.1 89.9 118.4 164.7 222.2 273.4 323.2 393.5 509.2 621.6 791.9 937.7<br />
Paper and Paper products 40.0 55.1 69.0 93.1 123.6 162.4 191.3 226.1 337.3 426.4 587.7 768.2<br />
Chemicals, rubber and plastic products 85.8 111.3 142.6 178.9 231.7 281.2 331.2 372.4 432.6 519.1 613.2 700.5<br />
Non-metallic mineral products 14.3 18.5 21.9 30.0 41.0 51.8 55.3 61.1 70.8 95.1 123.7 162.8<br />
Basic metal products 3.2 2.9 2.8 3.1 4.0 4.7 6.9 8.0 9.4 6.2 8.9 11.0<br />
Fabricated metal products 22.9 23.0 21.0 21.0 27.7 35.2 53.6 69.9 65.2 44.2 72.8 107.7<br />
Electricity, Gas and Water 328.0 445.3 488.3 595.1 694.7 922.7 1,165.9 1,345.0 1,512.4 1,779.8 2,201.8 2,910.4<br />
Construction 500.5 728.6 1,067.7 1,590.0 2,321.5 3,216.4 4,703.7 6,692.7 8,811.4 11,819.5 15,703.6 20,737.3<br />
SECONDARY SECTOR 1,853.1 2,466.9 3,249.6 4,426.1 5,843.9 7,569.2 9,885.3 12,525.1 15,473.4 19,616.2 24,676.1 31,416.8<br />
Wholesale and Retail trade 1,879.8 2,340.5 3,004.1 3,873.8 4,843.7 5,868.9 6,524.7 7,395.5 8,539.1 9,908.2 11,204.2 13,056.3<br />
Restaurants, Bars and Hotels 207.0 315.9 406.8 527.7 670.9 894.0 1,120.1 1,354.2 1,610.8 1,545.2 1,838.6 2,141.2<br />
Transport, Storage and Communications 635.7 852.6 1,055.9 1,058.2 1,252.3 1,395.6 1,629.2 1,984.4 2,248.9 2,355.2 3,076.5 3,553.0<br />
Rail Transport 54.9 72.7 82.7 89.5 100.8 93.8 94.7 91.9 79.0 66.2 105.9 96.6<br />
Road Transport 255.2 311.3 334.3 393.9 464.0 543.0 640.4 755.7 891.8 1,052.6 1,242.6 1,467.9<br />
Air Transport 99.0 133.7 129.7 152.7 203.0 243.8 356.0 488.6 573.4 453.6 611.0 737.8<br />
Communications 226.6 334.9 509.1 422.1 484.6 515.0 538.2 648.3 704.8 782.7 1,117.0 1,250.6<br />
Financial Intermediaries and Insurance 982.2 1,238.8 1,493.1 1,847.7 2,282.7 2,771.5 3,246.9 3,647.2 4,373.6 5,534.6 6,745.1 7,568.8<br />
Real Estate and Business services 660.6 832.8 1,041.2 1,341.2 1,691.8 1,979.4 2,296.4 2,678.2 3,138.4 3,671.6 4,306.1 5,326.3<br />
Community, Social and Personal Services 951.3 1,297.1 1,478.4 1,828.9 2,122.8 2,806.9 3,462.2 4,324.1 5,465.5 6,649.0 8,148.6 9,695.3<br />
Public Administration and Defence/Public Sanitary Services 500.1 610.2 646.8 752.2 797.3 1,002.2 983.0 1,258.3 1,446.1 1,647.3 1,732.7 2,082.4<br />
Education 256.1 394.3 496.9 688.6 867.7 1,254.2 1,842.6 2,335.3 3,092.8 3,890.8 4,694.2 5,542.0<br />
Health 107.0 175.5 203.6 252.4 292.8 338.8 389.9 445.2 576.9 690.9 1,246.2 1,522.9<br />
Recreation, Religious, Culture 36.4 52.7 48.5 29.1 31.7 50.3 67.1 81.8 114.7 147.4 167.1 188.6<br />
Personal services 51.7 64.4 82.7 106.6 133.3 161.5 179.6 203.5 235.0 272.7 308.3 359.3<br />
TERTIARY SECTOR 5,316.6 6,877.8 8,479.5 10,477.5 12,864.2 15,716.4 18,279.4 21,383.6 25,376.4 29,663.9 35,319.1 41,340.9<br />
Less: FISIM (564.4) (711.9) (858.1) (1,061.8) (1,311.8) (1,592.8) (1,865.9) (2,096.0) (2,513.4) (2,922.4) (3,876.3) (4,349.6)<br />
TOTAL GROSS VALUE ADDED 9,023.6 11,733.7 14,693.6 18,651.2 23,774.0 29,447.4 35,711.6 42,989.4 51,199.1 61,501.2 74,599.0 89,826.7<br />
Taxes less subsidies on Products 1,097.7 1,460.0 1,630.8 1,899.9 2,219.1 2,594.2 2,849.2 3,205.4 3,640.4 3,114.3 3,067.6 3,527.5<br />
TOTAL G.D.P. AT MARKET PRICES 10,121.3 13,193.7 16,324.4 20,551.1 25,993.1 32,041.510 38,560.8 46,194.8 54,839.4 64,615.6 77,666.6 93,354.2<br />
21 | P a g e
PERIOD<br />
TOTAL<br />
INDEX<br />
TOTAL<br />
MINING<br />
Coal<br />
MINING<br />
Nonferrous<br />
Ore<br />
Stone<br />
Quarrying<br />
2011 4TH QUARTER INDEX OF INDUSTRIAL PRODUCTION - ZAMBIA<br />
TOTAL<br />
MANUFACTURING<br />
Food,<br />
Beverages &<br />
Tobacco<br />
Textile,<br />
Clothing &<br />
Leather<br />
Wood &<br />
Wood<br />
Products<br />
MANUFACTURING<br />
Paper &<br />
Paper<br />
Products<br />
Chemicals,<br />
Rubbers &<br />
Plastics<br />
Nonmetallic<br />
Mineral<br />
Products<br />
Basic<br />
Metal<br />
Industries<br />
Fabricated<br />
Metal<br />
Products<br />
TOTAL<br />
ELECTRICITY<br />
WEIGHT 1.000 0.350 0.005 0.242 0.103 0.511 0.235 0.060 0.006 0.017 0.059 0.025 0.009 0.100 0.139<br />
2010 Q1 180.1 287.0 0.0 272.7 333.4 117.2 146.0 26.3 248.2 136.4 136.9 150.8 80.3 75.8 142.4<br />
2010 Q2 186.9 273.4 0.0 261.7 312.9 138.5 193.6 22.8 261.2 171.5 98.6 189.8 84.8 80.6 147.2<br />
2010 Q3 190.1 272.4 0.0 261.9 308.9 146.7 204.6 3.5 177.9 120.2 87.5 199.6 78.4 126.7 142.5<br />
2010 Q4 193.1 260.6 0.0 248.3 301.0 160.2 230.3 3.6 183.4 159.9 90.8 211.1 55.4 125.4 144.2<br />
2010 187.5 273.3 0.0 261.1 314.1 140.6 193.6 14.0 217.7 147.0 103.5 187.8 74.7 102.1 144.1<br />
2011 Q1 193.9 307.0 0.0 297.0 343.9 125.1 153.0 14.1 261.7 169.3 154.5 178.8 79.0 83.5 162.4<br />
2011 Q2 197.8 279.8 0.0 264.5 328.1 152.0 212.4 4.5 275.3 184.1 99.0 233.1 83.6 101.9 159.9<br />
2011 Q3 198.3 260.7 0.0 226.1 353.6 166.3 227.5 3.4 194.8 149.5 91.5 253.0 77.3 151.2 159.0<br />
2011 Q4 202.0 255.4 0.0 227.3 332.6 178.8 253.2 3.4 192.3 193.5 98.7 274.1 56.2 139.9 152.9<br />
Average<br />
2010<br />
Average<br />
2011<br />
187.5 273.3 0.0 261.1 314.1 140.6 193.6 14.0 217.7 147.0 103.5 187.8 74.7 102.1 144.1<br />
198.0 275.7 0.0 253.7 339.5 155.6 211.5 6.4 231.0 174.1 110.9 234.7 74.0 119.1 158.6<br />
YEAR-ON-YEAR PERCENTAGE CHANGES e.g. (Q2 2005/Q2 2004-1)*100<br />
2010 Q1 6.6 7.8 (100.0) 8.5 6.6 5.0 6.6 (42.2) 13.1 21.2 (0.1) 10.3 (2.1) 14.1 5.6<br />
2010 Q2 10.0 10.6 (100.0) 14.2 5.3 9.1 9.2 (21.9) 13.4 29.8 (0.3) 14.0 (0.2) 14.2 10.8<br />
2010 Q3 11.4 6.1 (100.0) 25.7 4.2 5.7 4.0 (77.2) 9.7 24.4 1.8 11.6 1.8 16.2 7.2<br />
2010 Q4 10.7 14.2 (100.0) 19.4 5.2 6.8 9.4 (91.0) 17.4 15.8 12.4 15.4 (9.3) 8.1 12.1<br />
2010 9.7 12.3 (100.0) 16.5 5.3 6.7 7.4 (56.8) 13.4 22.7 2.8 13.0 (2.0) 12.8 8.9<br />
2011 Q1 7.7 6.9 (100.0) 8.9 3.2 6.7 4.8 (46.6) 5.4 24.1 12.8 18.6 (1.6) 10.2 14.0<br />
2011 Q2 5.8 2.4 (100.0) 1.1 4.9 9.7 9.7 (80.1) 5.4 7.4 0.5 22.8 (1.4) 26.4 8.7<br />
2011 Q3 4.3 (4.3) (100.0) (13.7) 14.5 13.4 11.2 (0.7) 9.5 24.3 4.5 26.7 (1.3) 19.3 11.6<br />
2011 Q4 4.6 (2.0) (100.0) (8.4) 10.5 11.6 10.0 (5.6) 4.8 21.1 8.6 29.8 1.5 11.6 6.1<br />
2011 5.6 0.9 (100.0) (2.8) 8.1 10.6 9.3 (54.7) 6.1 18.4 7.2 25.0 (0.9) 16.6 10.1<br />
22 | P a g e
<strong>2012</strong><br />
2011<br />
ALL ITEMS CONSUMER PRICE INDEX (CPI) AND ANNUAL INFLATION RATES<br />
Consumer Price Index (2009 = 100)<br />
All Items<br />
Food &<br />
Nonalcoholic<br />
beverages<br />
Alcoholic<br />
beverages<br />
&<br />
Tobacco<br />
Clothing<br />
&<br />
footwear<br />
Housing,<br />
Water,<br />
Electricity,<br />
Gas & Other<br />
fuels<br />
Furnishings,<br />
Household<br />
Equip..,<br />
Routine Hse<br />
Mtc<br />
Health Transport Communication<br />
Recreation<br />
& Culture<br />
Education<br />
Restaurant<br />
& Hotel<br />
Miscellaneous<br />
Goods &<br />
Services<br />
Inflation<br />
Rate (%)<br />
<strong>Monthly</strong><br />
Inflation<br />
Rate (%)<br />
Annual<br />
Weight 1 000.00 534.85 15.21 80.78 114.11 82.36 8.15 58.08 12.94 13.84 26.62 3.37 49.69<br />
January 111.61 108.85 106.60 111.87 126.48 111.21 <strong>112</strong>.63 111.78 102.64 109.21 111.60 <strong>112</strong>.10 111.53 0.7 6.3<br />
February <strong>112</strong>.36 109.37 107.29 113.49 128.59 111.40 114.40 <strong>112</strong>.43 102.66 109.58 <strong>112</strong>.12 <strong>112</strong>.15 111.62 0.7 6.5<br />
March 113.56 110.50 107.05 115.33 129.95 <strong>112</strong>.03 114.96 114.86 102.80 109.85 114.20 115.35 <strong>112</strong>.21 1.1 6.6<br />
April 114.24 111.11 108.95 118.31 129.76 111.94 116.98 116.07 102.89 110.46 114.15 115.79 <strong>112</strong>.40 0.6 6.3<br />
May 114.56 110.97 108.33 119.16 130.95 113.37 117.78 117.03 102.87 113.12 113.23 116.37 <strong>112</strong>.46 0.3 6.3<br />
June 114.52 110.31 108.49 119.96 131.68 114.42 118.29 117.06 102.91 <strong>112</strong>.67 115.03 118.32 113.09 0.0 6.1<br />
<strong>July</strong> 115.89 111.93 108.52 120.70 132.16 116.40 118.40 119.38 102.89 114.12 116.22 115.46 114.02 1.2 6.9<br />
August 116.60 <strong>112</strong>.09 108.32 122.38 134.66 117.00 119.03 121.49 102.90 115.67 115.81 117.33 114.13 0.6 6.5<br />
September 117.01 <strong>112</strong>.48 108.09 121.39 135.65 119.01 119.87 121.66 102.64 115.44 116.87 116.62 113.67 0.4 6.6<br />
October 116.80 <strong>112</strong>.21 109.74 121.18 134.22 119.98 118.32 121.19 102.65 116.27 117.10 116.59 114.31 -0.2 6.7<br />
November 116.94 <strong>112</strong>.71 109.33 121.08 133.87 119.61 120.33 119.16 102.79 117.52 118.15 118.61 114.36 0.1 6.4<br />
December 117.47 113.39 109.15 121.69 134.61 118.56 120.12 120.78 102.71 116.84 118.36 116.97 115.29 0.5 6.0<br />
January 118.77 115.48 109.11 122.24 134.20 119.04 121.79 121.27 103.76 117.93 121.18 117.96 115.01 1.1 6.4<br />
February 119.09 115.41 110.41 122.74 134.71 119.96 122.84 122.46 104.05 118.03 122.87 117.95 115.86 0.3 6.0<br />
March 120.84 117.59 110.77 124.43 136.32 120.67 123.52 123.83 104.05 118.70 123.27 118.86 117.53 1.5 6.4<br />
April 121.63 118.22 111.61 125.91 137.21 121.89 124.26 124.47 104.12 119.31 123.56 119.57 118.67 0.7 6.5<br />
May 122.11 118.56 111.92 126.32 137.95 123.06 124.42 124.74 104.02 121.15 123.79 120.13 119.50 0.4 6.6<br />
June 122.16 118.11 <strong>112</strong>.38 126.48 138.81 123.47 123.63 125.64 103.92 121.77 124.75 120.77 120.58 0.0 6.7<br />
Source: CSO, Prices Statistics, <strong>2012</strong><br />
23 | P a g e
Consumer Index Numbers <strong>of</strong> Consumer Prices - Food and Non-Food (National)<br />
Period Total Food CPI Non-Food CPI<br />
Weight 1000.0 534.9 465.2<br />
2010 January 105.01 104.43 105.67<br />
February 105.47 104.87 106.15<br />
March 106.55 106.13 107.03<br />
April 107.48 107.11 107.9<br />
May 107.74 107.23 108.34<br />
June 107.93 106.26 109.85<br />
<strong>July</strong> 108.45 106.57 110.62<br />
August 109.45 105.97 113.44<br />
September 109.72 106.05 113.93<br />
October 109.44 105.6 113.86<br />
November 109.92 106.36 114.02<br />
December 110.86 107.65 114.56<br />
December 110.86 107.65 114.56<br />
2011 January 111.61 108.85 114.78<br />
February <strong>112</strong>.36 109.37 115.8<br />
March 113.56 110.5 117.09<br />
April 114.24 111.11 117.83<br />
May 114.56 110.97 118.67<br />
June 114.52 110.31 119.37<br />
<strong>July</strong> 115.89 111.93 120.45<br />
August 116.6 <strong>112</strong>.09 121.78<br />
September 117.01 <strong>112</strong>.48 122.22<br />
October 116.8 <strong>112</strong>.21 122.08<br />
November 116.94 <strong>112</strong>.71 121.8<br />
December 117.47 113.39 122.17<br />
<strong>2012</strong> January 118.77 115.48 122.54<br />
February 119.09 115.41 123.33<br />
March 120.84 117.59 124.56<br />
April 121.63 118.22 125.54<br />
May 122.11 118.56 126.2<br />
June 122.16 118.11 126.82<br />
Source: CSO, Prices Statistics, <strong>2012</strong><br />
2009 = 100<br />
24 | P a g e
ZAMBIA'S TRADE FLOWS IN ABSOLUTE ZAMBIAN KWACHA (2000 TO 2011)<br />
Flow Year Imports(cif) Domestic Exports(fob) Re-Exports(fob) Total Exports(fob) Trade Balance<br />
2000 2,751,563,199,592 2,680,166,733,376 36,390,914,760 2,716,557,648,136 -35,005,551,456<br />
2001 3,900,496,869,495 3,523,388,830,726 13,818,082,693 3,537,206,913,419 -363,289,956,076<br />
2002 4,734,304,934,590 4,046,573,003,139 24,035,820,066 4,070,608,823,205 -663,696,111,385<br />
2003 7,444,669,756,553 4,614,154,833,843 27,918,721,735 4,642,073,555,578 -2,802,596,200,975<br />
2004 10,325,503,347,652 7,486,745,995,064 59,170,839,070 7,545,916,834,134 -2,779,586,513,518<br />
2005 11,444,687,982,620 9,556,350,699,041 55,238,218,023 9,611,588,917,064 -1,833,099,065,556<br />
2006 11,063,138,110,907 13,388,355,650,002 22,808,958,125 13,411,164,608,127 2,348,026,497,220<br />
2007 15,945,376,837,943 18,301,362,191,730 97,855,426,894 18,399,217,618,625 2,453,840,780,682<br />
2008 18,479,642,802,328 17,951,791,468,707 701,848,350,726 18,653,639,819,433 173,997,017,105<br />
2009 19,123,920,627,951 20,324,345,158,885 1,052,545,471,859 21,376,890,630,744 2,252,970,002,793<br />
2010 25,507,487,313,137 32,876,095,550,370 1,623,955,907,893 34,500,051,458,263 8,992,564,145,126<br />
2011 34,952,221,308,124 42,035,955,496,346 1,796,262,816,977 43,832,218,313,322 8,879,997,005,198<br />
Total: 165,673,013,090,892 176,785,285,611,229 5,511,849,528,821 182,297,135,140,050 16,624,122,049,158<br />
ZAMBIA'S TRADE FLOWS IN ABSOLUTE US DOLLAR (2000 TO 2011)<br />
Flow Year Imports(cif) Domestic Exports(fob) Re-Exports(fob) Total Exports(fob) Trade Balance<br />
2000 871,386,492 857,162,791 12,322,625 869,485,416.00 -1,901,076<br />
2001 1,079,955,769 974,976,195 3,812,082 978,788,277.00 -101,167,492<br />
2002 1,103,420,711 938,812,212 5,704,981 944,517,193.00 -158,903,518<br />
2003 1,574,300,779 973,386,279 5,919,576 979,305,855.00 -594,994,924<br />
2004 2,161,774,011 1,569,772,851 12,463,536 1,582,236,387.00 -579,537,624<br />
2005 2,574,917,607 2,164,120,186 12,212,327 2,176,332,513.00 -398,585,094<br />
2006 3,027,310,787 3,674,763,391 6,824,871 3,681,588,262.00 654,277,475<br />
2007 4,006,998,096 4,591,793,327 25,682,698 4,617,476,025.00 610,477,929<br />
2008 5,061,390,791 4,909,524,577 189,326,707 5,098,851,284 37,460,493<br />
2009 3,831,581,658 4,102,130,891 212,500,100 4,314,630,991 483,049,333<br />
2010 5,321,002,628 6,863,323,917 337,627,232 7,200,951,149 1,879,948,521<br />
2011 7,177,669,615 8,643,678,779 371,709,764 9,015,388,543 1,837,718,928<br />
Total: 37,791,708,944 40,263,445,396 1,196,106,499 41,459,551,895 3,667,842,951<br />
25 | P a g e
Surveys/Activities being undertaken<br />
<br />
<br />
<br />
<br />
2010 Census <strong>of</strong> Population and Housing Data Analysis and Report writing<br />
Economic Census Phase II Data Collection<br />
Sample Vital Registration with Verbal Autopsy (SAVVY) Report writing<br />
Maternal Mortality Survey Data Collection<br />
Available<br />
2010 Census Population Summary Report<br />
2006 & 2010 Living Conditions Monitoring Survey Report<br />
2010/2011 Crop Forecasting Survey<br />
2009 <strong>Zambia</strong> Sexual Behaviour Survey (ZSBS)<br />
Employment and Earnings Inquiry Report, 2009<br />
National Accounts Statistics Bulletin No.9 2005<br />
Labour-Force Survey Report, 2008<br />
2007 <strong>Zambia</strong> Demographic and Health Survey (ZDHS)<br />
2010 Census <strong>of</strong> population and Housing Preliminary Report (both Hard and s<strong>of</strong>t copy)<br />
2010 Selected Socio-Economic Indicators Report<br />
2010 <strong>Zambia</strong> In Figures<br />
Subscribe for your free electronic copy <strong>of</strong> “<strong>The</strong> <strong>Monthly</strong>” online at www.zamstats.gov.zm<br />
<strong>The</strong> Editorial Team would like to thank all Media Institutions and Users <strong>of</strong>…..<br />
“<strong>The</strong> <strong>Monthly</strong> Bulletin”<br />
Thank you for supporting us<br />
Secretariat<br />
John Kalumbi - Director<br />
Peter Mukuka - Deputy Director<br />
Richard Banda - Research and Marketing Manager<br />
Linda N. Chonya - Senior Research <strong>Office</strong>r<br />
Anthony Nkole - Desktop Publishing <strong>Office</strong>r<br />
Perry Musenge - Assistant Desktop Publishing <strong>Office</strong>r<br />
Petronella Kaputu - Press Liaison <strong>Office</strong>r<br />
Chisuwa S. Nalishuwa - Assistant Field Co-ordinator<br />
Daniel Chipaila - Statistician<br />
George Mhango - Sales <strong>Office</strong>r<br />
Editorial Team<br />
26 | P a g e<br />
John Kalumbi<br />
Peter Mukuka<br />
Goodson Sinyenga<br />
Daniel Daka<br />
Iven Sikanyiti<br />
Shebo Nalishebo<br />
Josephine Chewe<br />
Gerson Banda<br />
Palver Sikanyiti<br />
Cecilia M. Munjita<br />
Linda Nyasulu<br />
Charles Mugala<br />
- Director<br />
- Deputy Director (IRD)<br />
- Deputy Director (ECON)<br />
- A/Deputy Director (AGRIC)<br />
- A/Deputy Director (SOC)<br />
- Statistician<br />
- Statistician<br />
- Statistician<br />
- Statistician<br />
- A/Senior Gender Analyst<br />
- Gender Analyst<br />
- Field Coordinator