Vol 121 2013 The Monthly May Final.pdf - Central Statistical Office of ...
Vol 121 2013 The Monthly May Final.pdf - Central Statistical Office of ...
Vol 121 2013 The Monthly May Final.pdf - Central Statistical Office of ...

You also want an ePaper? Increase the reach of your titles
YUMPU automatically turns print PDFs into web optimized ePapers that Google loves.
Republic <strong>of</strong> Zambia<strong>The</strong><strong>Monthly</strong><strong>Central</strong> <strong>Statistical</strong> <strong>Office</strong><strong>Vol</strong>ume <strong>121</strong> Website: www.zamstats.gov.zm <strong>May</strong>, <strong>2013</strong>ForewordWelcome to the <strong>Monthly</strong> presentation organised by theDissemination Branch <strong>of</strong> the <strong>Central</strong> <strong>Statistical</strong> <strong>Office</strong> (CSO). <strong>The</strong>CSO embarks on vigorous information delivery strategy to majorstakeholders and the media institutions in order to increaseutilisation <strong>of</strong> statistical products and services. <strong>The</strong> <strong>of</strong>fice producesa number <strong>of</strong> statistical products in the Economic, Social,Agricultural and Environmental areas. <strong>The</strong> information collectedin these areas may be used for various purposes including policyformulation, planning, implementation, monitoring andevaluation <strong>of</strong> programmes and projects.This <strong>Monthly</strong> publication is an attempt to provide highlights <strong>of</strong>CSO’s work and how it can help media institutions and thegeneral public to make use <strong>of</strong> data and information forsustainable national development and decision-making.I would like to urge our readers and users <strong>of</strong> statistical informationto send to us any comments that may enhance statisticalproduction and contribute to the improvement <strong>of</strong> this bulletin.Goodson SinyengaACTING DIRECTOR OF CENSUS AND STATISTICS30 th <strong>May</strong>, <strong>2013</strong>Inside thisIssue <strong>May</strong> Inflationgoes up by 0.5percent April <strong>2013</strong>records TradeSurplus <strong>The</strong> NationalFood BalanceSheet for the<strong>2013</strong>/2014AgriculturalMarketingSeason MaizeProductionexpected todecrease Selected Socio- EconomicIndicators<strong>Central</strong> <strong>Statistical</strong> <strong>Office</strong>, Nationalist Road, P.O. Box 31908, Lusaka ● Telefax: 260-1-253468 ● E-mail: info@zamstats.gov.zm 1 | Page
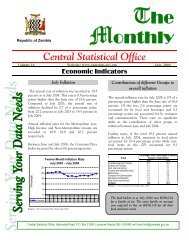
INFLATION<strong>May</strong> Inflation goes up by 0.5 percent<strong>The</strong> annual rate <strong>of</strong> inflation, as measured bythe all items Consumer Price Index (CPI),increased by 0.5 percentage points, from 6.5percent in April <strong>2013</strong> to 7.0 percent in <strong>May</strong><strong>2013</strong>. This means that on average, pricesincreased by 7.0 percent between <strong>May</strong> 2012and <strong>May</strong> <strong>2013</strong>. <strong>The</strong> increase in annual inflationis attributed mainly to increases in prices <strong>of</strong>non-food and some food items.Annual Inflation Rate<strong>May</strong> 2012 - <strong>May</strong> <strong>2013</strong>876(Percentage)543210<strong>May</strong> Jun Jul Aug Sept Oct Nov Dec Jan Feb Mar Apr <strong>May</strong>Composite 6.6 6.7 6.2 6.4 6.6 6.8 6.9 7.3 7.0 6.9 6.6 6.5 7Source: CSO, Prices Statistics, <strong>2013</strong>Movements in Annual Inflation Rates for CPI Main GroupsBetween <strong>May</strong> 2012 and <strong>May</strong> <strong>2013</strong>, the annualrate <strong>of</strong> inflation increased for Food and nonalcoholicbeverages; Alcoholic beveragesand tobacco; Clothing and footwear;Housing, water, electricity, gas and other fuels;Health; Transport; Education; andCommunication.Meanwhile, the annual rate <strong>of</strong> inflationdecreased for Furnishings, householdequipment and routine house maintenance;Recreation and Culture; Restaurant and hotel;and Miscellaneous Goods and Services.2 | P age
Annual Inflation Rate: CPI Main GroupsAll ItemsFood & NonalcoholicbeveragesAlcoholicbeverages &TobaccoClothing &footwearHousing, Water,Electricity, Gas &Other fuelsFurnishings,Household Equip..,Routine Hse MtcHealthTransportCommunicationRecreation &CultureEducationRestaurant & HotelMiscellaneousGoods & Services1000 534.9 15.2 80.8 114.1 82.4 8.2 58.1 12.9 13.8 26.6 3.4 49.7Jan '11 - Jan '10 6.3 4.2 1.4 4.4 17.2 7.0 6.4 8.0 -0.1 3.5 6.0 8.2 6.3Feb '11 - Feb '10 6.5 4.3 2.6 5.9 18.2 7.5 7.7 5.4 0.6 4.2 7.4 8.3 6.4Mar '11 - Mar '10 6.6 4.1 2.1 7.6 18.3 6.9 6.5 5.9 0.2 2.8 9.3 9.5 6.5Apr '11 - Apr '10 6.3 3.7 2.9 9.5 16.1 6.0 6.7 7.5 0.4 3.0 8.1 8.5 6.3<strong>May</strong> '11 - <strong>May</strong>'10 6.3 3.5 5.0 9.4 18.3 6.3 7.2 5.6 0.4 5.2 7.4 7.4 5.8Jun '11 - Jun '10 6.1 3.8 5.3 9.6 16.0 6.2 7.1 2.9 0.5 4.4 9.2 8.4 4.8Jul '11 - Jul '10 6.9 5.0 4.8 10.0 15.3 7.4 6.3 3.4 0.4 6.8 8.2 5.5 5.5Aug '11 - Aug'10 6.5 5.8 3.6 10.6 7.2 7.8 4.5 7.2 0.3 7.4 7.2 8.4 5.1Sep '11 - Sep '10 6.6 6.1 3.8 9.0 7.7 8.9 5.2 6.4 0.0 7.0 8.2 6.3 4.5Oct '11 - Oct '10 6.7 6.3 4.6 8.5 6.2 9.7 3.2 8.4 0.4 7.8 8.4 5.5 4.8Nov '11 - Nov '10 6.4 6.0 4.0 8.7 6.4 8.5 6.1 6.7 0.6 7.8 9.4 6.4 3.0Dec '11 - Dec'10 6.0 5.3 2.0 8.2 6.1 6.2 5.6 9.2 0.5 7.7 9.0 3.9 4.8Jan '12 - Jan '11 6.4 6.1 2.4 9.3 6.1 7.0 8.1 8.5 1.1 8.0 8.6 5.2 3.1Feb '12 - Feb '11 6.0 5.5 2.9 8.1 4.8 7.7 7.4 8.9 1.3 7.7 9.6 5.2 3.8Mar '12 - Mar '11 6.4 6.4 3.5 7.9 4.9 7.7 7.4 7.8 1.2 8.1 7.9 3.0 4.7Apr '12 - Apr '11 6.5 6.4 2.4 6.4 5.7 8.9 6.2 7.2 1.2 8.0 8.2 3.3 5.6<strong>May</strong> '12 - <strong>May</strong>'11 6.6 6.8 3.3 6.0 5.3 8.6 5.6 6.6 1.1 7.1 9.3 3.2 6.3Jun '12 - Jun '11 6.7 7.1 3.6 5.4 5.4 7.9 4.5 7.3 1.0 8.1 8.5 2.1 6.6Jul '12 - Jul '11 6.2 6.3 5.2 5.6 5.3 6.9 5.4 5.9 1.7 7.2 9.6 4.6 6.8Aug'12 - Aug'11 6.4 7.3 5.0 5.0 4.5 7.7 6.2 3.4 1.7 5.2 9.8 2.6 7.2Sep '12 - Sep '11 6.6 7.5 5.9 5.7 3.5 6.3 6.9 6.0 2.2 5.7 9.5 4.2 7.7Oct '12 - Oct '11 6.8 8.2 3.7 4.3 4.9 6.1 7.5 4.9 2.3 4.1 9.2 4.6 7.6Nov '12 - Nov '11 6.9 8.0 5.0 6.7 5.0 6.5 5.5 4.6 1.7 2.1 9.0 3.5 7.6Dec '12 - Dec'11 7.3 8.4 5.9 6.5 7.0 6.5 5.1 3.3 1.4 4.2 8.8 5.0 6.6Jan '13 - Jan '12 7.0 7.6 6.8 6.7 6.1 5.9 4.1 3.6 1.3 4.1 13.9 5.8 8.3Feb '13 - Feb '12 6.9 6.7 6.3 8.4 7.4 6.0 3.3 3.9 2.1 3.8 14.2 6.4 9.1Mar '13 - Mar '12 6.6 6.0 6.1 8.5 8.2 6.2 4.9 3.1 2.6 4.1 13.9 6.3 8.6Apr '13 - Apr '12 6.5 6.1 6.1 7.6 8.3 5.5 3.7 3.5 2.5 3.8 13.6 6.7 7.8<strong>May</strong> '13 - <strong>May</strong>'12 7.0 6.3 6.5 8.2 9.7 5.3 5.0 6.7 2.7 3.7 13.9 6.6 7.6Source: CSO, Prices Statistics, <strong>2013</strong>Contributions <strong>of</strong> different Items to Overall InflationOf the total 7.0 percent annual inflation raterecorded in <strong>May</strong> <strong>2013</strong>, food productsaccounted for 3.3 percentage points, whilenon-food products accounted for a total <strong>of</strong>3.7 percentage points.Percentage Points Contributions <strong>of</strong> different items to Overall InflationITEMS April <strong>2013</strong> <strong>May</strong> <strong>2013</strong>Food and Non-alcoholic beverages 3.2 3.3Alcoholic beverages and Tobacco 0.1 0.1Clothing and footwear 0.6 0.7Housing, Water, Electricity, Gas and Other fuels 1.1 1.2Furnishings, Household Equipment, Routine house maintenance 0.4 0.4Health 0.0 0.0Transport 0.2 0.4Communication 0.0 0.0Recreation and Culture 0.1 0.1Education 0.4 0.4Restaurant and Hotel 0.0 0.0Miscellaneous Goods and Services 0.4 0.4All items 6.5 7.0Source: CSO, Prices Statistics, <strong>2013</strong>3 | P age
<strong>The</strong> Annual Food and Non - food Inflation Rates<strong>The</strong> annual food inflation rate wasrecorded at 6.3 percent in <strong>May</strong> <strong>2013</strong>compared to 6.1 percent recorded inApril <strong>2013</strong>. This represents a 0.2percentage point increase in annualfood inflation. <strong>The</strong> annual non-foodinflation rate increased by 0.9percentage points from 6.9 percent inApril <strong>2013</strong> to 7.8 percent in <strong>May</strong> <strong>2013</strong>.Annual Inflation Rates: Food and Non- Food ItemsPeriod Total Food Non-FoodWeight 1 000.00 534.85 465.152011 Jan '11 - Jan '10 6.3 4.2 8.6Feb '11 - Feb '10 6.5 4.3 9.1Mar '11 - Mar '10 6.6 4.1 9.4Apr '11 - Apr '10 6.3 3.7 9.2<strong>May</strong> '11 - <strong>May</strong> '10 6.3 3.5 9.5Jun '11 - Jun '10 6.1 3.8 8.7Jul '11 - Jul '10 6.9 5.0 8.9Aug '11 - Aug '10 6.5 5.8 7.3Sep '11 - Sep '10 6.6 6.1 7.3Oct '11 - Oct '10 6.7 6.3 7.2Nov '11 - Nov '10 6.4 6.0 6.8Dec '11 - Dec '10 6.0 5.3 6.62012 Jan '12 - Jan '11 6.4 6.1 6.8Feb '12 - Feb '11 6.0 5.5 6.5Mar '12 - Mar '11 6.4 6.4 6.4Apr '12 - Apr '11 6.5 6.4 6.5<strong>May</strong> '12 - <strong>May</strong> '11 6.6 6.8 6.3Jun '12 - Jun '11 6.7 7.1 6.2Jul '12 - Jul '11 6.2 6.3 6.0Aug '12 - Aug '11 6.4 7.3 5.5Sep '12 - Sep '11 6.6 7.5 5.6Oct '12 - Oct '11 6.8 8.2 5.4Nov’12- Nov’11 6.9 8.0 5.8Dec '12 - Dec '11 7.3 8.4 6.1<strong>2013</strong> Jan '13 - Jan '12 7.0 7.6 6.3Feb '13- Feb '12 6.9 6.7 7.1Mar '13- Mar '12 6.6 6.0 7.2Apr '13 - Apr '12 6.5 6.1 6.9<strong>May</strong> '13 - <strong>May</strong> '12 7.0 6.3 7.8Source: CSO, Prices Statistics, <strong>2013</strong><strong>The</strong> Month on Month Food and Non-food Inflation Rate<strong>The</strong> month -on- month inflation rate wasrecorded at 0.9 percent in <strong>May</strong> <strong>2013</strong>compared to 0.6 percent recorded inApril <strong>2013</strong>.<strong>The</strong> month - on- month food inflation ratewas recorded at 0.4 percent in <strong>May</strong> <strong>2013</strong>compared to 0.7 percent recorded inApril <strong>2013</strong>. This implies that the monthlyfood inflation rate decreased by 0.3percentage points between April <strong>2013</strong>and <strong>May</strong> <strong>2013</strong>.Between April <strong>2013</strong> and <strong>May</strong> <strong>2013</strong>, thenon-food inflation rate increased by 0.8percentage points from 0.5 percent inApril <strong>2013</strong> to 1.3 percent in <strong>May</strong> <strong>2013</strong>.4 | Page
Month on month Inflation Rates: Food and Non Food Items, (2009 = 100)WeightPeriodTotal Food Non-Food1000.0 534.9 465.22011Jan '11 - Dec '10 0.7 1.1 0.2Feb '11 - Jan '11 0.7 0.5 0.9Mar '11 - Feb '11 1.1 1.0 1.1Apr '11 - Mar '11 0.6 0.6 0.6<strong>May</strong> '11 - Apr '11 0.3 -0.1 0.7Jun '11 - <strong>May</strong> '11 0.0 -0.6 0.6Jul '11 - Jun '11 1.2 1.5 0.9Aug '11 - Jul '11 0.6 0.1 1.1Sep '11 - Aug '11 0.4 0.3 0.4Oct '11 - Sep '11 -0.2 -0.2 -0.1Nov '11 - Oct '11 0.1 0.4 -0.2Dec '11 - Nov '11 0.5 0.6 0.32012 Jan '12 - Dec '11 1.1 1.8 0.3Feb '12 - Jan '12 0.3 -0.1 0.6Mar '12 - Feb '12 1.5 1.9 1.0Apr '12 - Mar '12 0.7 0.5 0.8<strong>May</strong> '12 - Apr '12 0.4 0.3 0.5Jun '12 - <strong>May</strong> '12 0.0 -0.4 0.5Jul '12 - Jun '12 0.7 0.8 0.7Aug '12 - July '12 0.9 1.1 0.6<strong>2013</strong>Sep '12 - Aug '12 0.5 0.5 0.4Oct '12 - Sep '12 0.1 0.4 -0.3Nov '12 - Oct '12 0.2 0.2 0.1Dec '12 - Nov '12 0.8 1.0 0.6Jan '13 - Dec '12 0.8 1.1 0.5Feb '13 - Jan '13 0.2 -0.9 1.4Mar '13 - Feb '13 1.2 1.2 1.1Apr '13 - Mar '13 0.6 0.7 0.5<strong>May</strong> '13 - Apr '13 0.9 0.4 1.3Source: CSO, Prices Statistics, <strong>2013</strong>Changes in Inflation Rates for Provinces<strong>The</strong> annual rate <strong>of</strong> inflation increased for<strong>Central</strong>, Luapula, Lusaka, Northern andNorth-western provinces, while itdecreased for Copperbelt, Eastern,Southern and Western provinces. NorthwesternProvince had the highest annualrate <strong>of</strong> inflation at 8.3 percent. This wasfollowed by Lusaka Province at 7.9percent, while Western Province had thelowest annual rate <strong>of</strong> inflation at 5.2percent in <strong>May</strong>, <strong>2013</strong>.Provincial Price Indices and inflation RatesPercentage change over Percentage change over 12Index (2009 = 100)one monthmonthsWeightProvince<strong>May</strong>-Mar-13 Apr-13 <strong>May</strong>-13 Mar-13 Apr-13Mar-13 Apr-13 <strong>May</strong>-13131000 128.8 129.6 130.7 1.2 0.6 0.9 6.6 6.5 7.0<strong>Central</strong> 107.19 127.0 127.9 128.7 0.7 0.7 0.7 5.6 5.4 6.7Copperbelt 219.68 128.6 129.2 130.0 1.0 0.5 0.6 7.9 7.2 6.7Eastern 88.98 131.7 131.9 133.0 0.3 0.2 1.4 6.4 6.0 5.8Luapula 50.60 127.7 128.0 129.8 0.3 0.2 1.4 3.8 3.3 5.8Lusaka 283.89 129.3 130.1 131.5 1.6 0.6 1.1 6.3 6.8 7.9Northern/ Muchinga 65.72 126.2 127.8 127.7 0.6 1.3 0.1 4.7 5.8 6.4North western 32.33 126.9 128.6 130.4 2.3 1.3 1.4 5.6 6.0 8.3Southern 109.19 132.2 132.8 134.0 1.0 0.5 0.9 8.7 8.6 7.8Western 42.42 123.5 124.0 125.5 0.8 0.4 1.2 6.9 5.3 5.2Source: CSO, Prices Statistics, <strong>2013</strong>5 | Page
Provincial Contribution to overall InflationLusaka Province made the largestcontribution <strong>of</strong> 2.2 percentage points tothe overall annual inflation rate <strong>of</strong> 7.0percent recorded in <strong>May</strong> <strong>2013</strong>. This wasfollowed by Copperbelt and Southernprovinces which contributed 1.5 and 0.9percentage points, respectively. WesternProvince had a lowest contribution <strong>of</strong> 0.2percentage points.Provincial Contribution to overall InflationProvince April <strong>2013</strong> <strong>May</strong> <strong>2013</strong><strong>Central</strong> 0.6 0.7Copperbelt 1.6 1.5Eastern 0.5 0.5Luapula 0.2 0.3Lusaka 1.9 2.2Northern/ Muchinga 0.4 0.4North Western 0.2 0.3Southern 0.9 0.9Western 0.2 0.2All items 6.5 7.0Source: CSO, Prices Statistics, <strong>2013</strong>National Average Prices <strong>of</strong> Selected ProductsA comparison <strong>of</strong> retail prices betweenApril <strong>2013</strong> and <strong>May</strong> <strong>2013</strong> shows that thenational average price <strong>of</strong> a 25 kg bag <strong>of</strong>breakfast Mealie meal was recorded atKR 58.17 from KR 58.16. <strong>The</strong> nationalaverage price <strong>of</strong> a 25 kg bag <strong>of</strong> rollermealie meal increased by 1.4 percentfrom KR 44.29 to KR44.89.<strong>The</strong> national average price <strong>of</strong> a 20 litre tin<strong>of</strong> Maize grain decreased by 6.9 percentfrom KR 27.02 to KR 25.15. <strong>The</strong> nationalaverage price <strong>of</strong> a litre <strong>of</strong> petrolincreased by 21.0 percent from KR 8.17 toKR 9.88 and the average price <strong>of</strong> a litre <strong>of</strong>Diesel increased by 21.3 percent from KR7.60 to KR 9.20.National Average Prices for selected Products and Months (ZMW)Product Description 12-Nov 12-Dec 13-Jan 13-Feb 13-Mar 13-Apr 13-<strong>May</strong><strong>May</strong>/ Apr%ChangeBreakfast Mealie Meal 49.38 56.67 57.56 54.41 55.77 58.16 58.17 0.0Roller Mealie Meal 36.13 42.96 45.09 43.20 42.53 44.29 44.89 1.4Maize grain 20.47 22.38 24.39 25.81 27.10 27.02 25.15 -6.9Brisket 26.87 26.86 27.70 27.36 27.40 26.32 27.34 3.9Mixed Cut 25.09 25.53 26.31 26.07 25.82 25.64 25.74 0.4Frozen Fish 19.26 19.35 19.94 20.04 17.14 17.60 18.10 2.8Buka Buka 20.59 20.35 20.50 21.41 21.72 21.41 21.88 2.2Fresh Kapenta 8.71 8.60 9.36 9.44 8.92 9.01 9.37 4.0Dried Bream 46.18 46.47 52.49 53.66 41.72 43.07 46.27 7.4Dried Kapenta (Mpulungu) 70.25 72.84 73.57 76.92 84.09 76.82 79.36 3.3Dried Kapenta (Siavonga) 73.76 74.62 76.66 85.69 85.00 81.24 78.96 -2.8Dried Kapenta (Chisense) 42.38 45.49 52.47 51.85 47.49 46.90 47.54 1.4Tomatoes 4.08 5.02 5.50 4.89 4.50 3.54 4.11 16.1Dried beans 9.57 11.37 12.15 11.85 11.53 10.76 10.65 -1.0Shake Shake 2.90 2.90 2.82 2.88 2.86 2.98 3.03 1.6Diesel 7.57 7.58 7.58 7.58 7.58 7.59 9.20 21.3Petrol 8.17 8.17 8.17 8.17 8.17 8.17 9.88 21.0Hammer milling charge 3.54 3.57 3.58 3.56 3.59 3.66 3.69 0.7Source: CSO, Prices Statistics, <strong>2013</strong>6 | Page
INTERNATIONAL MERCHANDIZE TRADEApril <strong>2013</strong> records Trade SurplusZambia recorded a trade surplus valuedat K 329.5 Billion (KR 329 Million) in April<strong>2013</strong> from K 307.2 Billion (KR 307.2 Million)recorded in March <strong>2013</strong>. This means thatthe country exported more in April <strong>2013</strong>than it imported, in nominal terms.<strong>The</strong> country has continued to recordtrade surpluses since January <strong>2013</strong> withthe highest valued at K329.5 Billion (KR329.5 Million) recorded in April and thelowest trade surplus was recorded inFebruary <strong>2013</strong>, valued at K133.2 Billion (KR133.2 Million).Total Exports (FOB) and Imports (CIF), January <strong>2013</strong> to April <strong>2013</strong>(K’ Million and KR’ Million)Months Imports(CIF)DomesticExports(FOB)Re-Exports(FOB) Total Exports(FOB) Trade BalanceJan-13K 4,163,183 K 3,859,340 K 524,253 K 4,383,594 K 220,410KR 4,163 KR 3,859 KR 524 KR 4,384 KR 220Feb-13K 4,302,489 K 3,896,219 K 539,462 K 4,435,681 K 133,191KR 4,302 KR 3,896 KR 539 KR 4,436 KR 133Mar-13K 4,371,721 K 4,119,640 K 559,234 K 4,678,874 K 307,154KR 4,372 KR 4,120 KR 559 KR 4,679 KR 307Quarter 1K 12,837,393 K 11,875,199 K 1,622,950 K 13,498,149 K 660,756KR 12,837 KR 11,875 KR 1,623 KR 13,498 KR 661Apr-13*K 4,637,524 K 4,312,254 K 654,724 K 4,966,979 K 329,455KR 4,638 KR 4,312 KR655 KR 4,967 KR 329Source: CSO, International Trade Statistics, <strong>2013</strong><strong>The</strong>se trade data are compiled based on the General Trade SystemNote: (*) ProvisionalExports by Major Product Categories, April and March <strong>2013</strong>Zambia’s major export products in April<strong>2013</strong> were from the intermediate goodscategory (mainly comprising coppercathodes and sections <strong>of</strong> refinedcopper) accounting for 81.7 percent.Other exports were from the Consumergoods, Raw materials and Capital goodscategories which collectively accountedfor 18.3 percent <strong>of</strong> total exports in April<strong>2013</strong>. This implies that between April andMarch <strong>2013</strong>, the country has been a netexporter <strong>of</strong> Intermediate goods, mainlyMetals and their articles, accounting foran average <strong>of</strong> 80.3 percent <strong>of</strong> the totalexports.Exports by Major Product Categories April and March <strong>2013</strong>April <strong>2013</strong>* March <strong>2013</strong>®DescriptionValueValue(K' million) (KR Million ) % Share (K' million) (KR Million ) % ShareConsumer Goods 557,818 558 11.2 489,332 489 10.5Raw Materials 240,104 240 4.8 178,367 178 3.8Intermediate Goods 4,057,138 4,057 81.7 3,691,762 3,692 78.9Capital Goods 111,919 112 2.3 319,413 319 6.8Total: 4,966,979 4,967 100.0 4,678,874 4,679 100.0Source: CSO, International Trade Statistics, <strong>2013</strong>Note: (*) Provisional(®) Revised7 | Page
Zambia’s Metal Exports and Non-Traditional Exports(NTEs), April and March <strong>2013</strong><strong>The</strong>re has been an increase in the totalvalue <strong>of</strong> Metal exports from K3,228.3Billion (KR 3,228.3 Million) in March <strong>2013</strong> toK3,621.8 Billion (KR 3,621.8 Million) in April<strong>2013</strong>. <strong>The</strong> overall contribution <strong>of</strong> Metalsand their products to the total exportearnings in March and February <strong>2013</strong>averaged 71.0 percent. <strong>The</strong> share <strong>of</strong> NTEsrecorded an average <strong>of</strong> 29.0 percent inrevenue earnings between April andMarch <strong>2013</strong>.Zambia’s Metal Exports and Non-Traditional Exports (NTEs), April and March <strong>2013</strong>GROUPValueApril <strong>2013</strong>* March <strong>2013</strong>®Value(K' million) (KR Million ) % Share (K' million) (KR Million )Traditional Exports (mainly Metals) 3,621,809 3,622 72.9 3,228,339 3,228 69.0Non-Traditional Exports 1,345,170 1,345 27.1 1,450,535 1,451 31.0Total Exports 4,966,979 4,967 100.0 4,678,874 4,679 100.0Source: CSO, International Trade Statistics, <strong>2013</strong>Note: (*) Provisional(®) RevisedZambia’s Major Export Destinations by Commodity in April<strong>2013</strong>%ShareZambia’s major export destination in April<strong>2013</strong> was Switzerland, which accountedfor 39.0 percent. <strong>The</strong> major exportproducts were Cathodes & Sections <strong>of</strong>Cathodes <strong>of</strong> refined Copper accountingfor 92.7 percent.China was the second major destination<strong>of</strong> Zambia’s exports accounting for 20.8percent. <strong>The</strong> major export product wasCopper blister (54.3 percent).South Africa was the third major exportdestination accounting for 13.4 percent.<strong>The</strong> main export products were Bars, rodsand pr<strong>of</strong>iles <strong>of</strong> copper alloys, accountingfor 47.8 percent.<strong>The</strong> fourth major export destination wasCongo DR, accounting for 6.5 percent.<strong>The</strong> main export product was Portlandcement (26.7 percent).<strong>The</strong> fifth major export destination was <strong>The</strong>United Arab Emirates which accountedfor 6.1 percent. <strong>The</strong> major exportproducts were Other Spirituousbeverages, which accounted for 57.4percent.<strong>The</strong>se five countries collectivelyaccounted for 85.8 percent <strong>of</strong> Zambia’stotal export earnings in April <strong>2013</strong>.8 | Page
Country /Hs-CodeZambia's Five Major Export Destinations by Product for April <strong>2013</strong>Description(K' Million)ValueApril <strong>2013</strong>*(KR 'Million)% ShareSWITZERLAND 1,934,654 1,935 100.074031100 Cathodes and sections <strong>of</strong> cathodes <strong>of</strong> refined copper 1,793,409 1,793 92.774031910 Copper blister 93,658 94 4.874091900Plates, sheets and strip, <strong>of</strong> refined copper, uncoiled, >0.15mmthick 25,662 26 1.352010000 Cotton, not carded or combed 10,813 11 0.674091100Plates, sheets and strip, <strong>of</strong> refined copper, in coils, >0.15mmthick 3,533 4 0.228369910 Other carbonates; peroxocarbonates in bulk 2,221 2 0.112081000 Soya bean flour and meal 2,143 2 0.114042000 Cotton linters 2,054 2 0.174032900 Copper (excl. Master) alloys, nes, unwrought 813 1 0.074099000 Plates, sheets and strip, <strong>of</strong> copper alloys, nes, >0.15mm thick 267 0 0.0Other Products 81 0 0.0Percent <strong>of</strong> Total April Exports 39.0CHINA 1,033,031 1,033 100.074031910 Copper blister 560,632 561 54.374031100 Cathodes and sections <strong>of</strong> cathodes <strong>of</strong> refined copper 211,013 211 20.474032900 Copper (excl. Master) alloys, nes, unwrought 193,206 193 18.781059000 Other: articles <strong>of</strong> cobalt, nes 57,762 58 5.626020000Manganese ores/concentrates(inc.ferruginous), withmanganese cont.<strong>of</strong>=>20% 7,081 7 0.726030000 Copper ores and concentrates 1,723 2 0.252030000 Cotton, carded or combed 1,189 1 0.144079900Wood, nes sawn or chipped lengthwise, sliced or peeled,>6mm thick 165 0 0.097011000 Paintings, drawings and pastels executed entirely by hand 127 0 0.003019900 Other live fish 53 0 0.0Other Products 80 0 0.0Percent <strong>of</strong> Total April Exports 20.8SOUTH AFRICA 664,388 664 100.074072900 Bars, rods and pr<strong>of</strong>iles <strong>of</strong> copper alloys, nes 317,305 317 47.871081300Semi-manufactured gold (incl. Gold plated with platinum),non-monetary 65,339 65 9.887029090Motor vehicles for transport <strong>of</strong> persons sitting capacity morethan 14 (petrol) 43,681 44 6.697050000 Collections and collector's pieces <strong>of</strong> zoological... Interest 43,462 43 6.528220010Cobalt oxides and hydroxides; commercial cobalt oxides inbulk 27,661 28 4.217031000 Cane molasses resulting from the extraction or refining <strong>of</strong> sugar 20,943 21 3.212072000 Cotton seeds 20,830 21 3.174081100Wire <strong>of</strong> refined copper, maximum cross-sectional dimension>6mm 20,065 20 3.085444900Electric conductors, nes, for a voltage
Country /Hs-CodeDescriptionApril <strong>2013</strong>*Value(K' Million) (KR 'Million)% Share28020010 Sulphur, sublimed or precipitated; colloidal sulphur - in bulk 14,177 14 4.438249000Chemical products and residual products <strong>of</strong> chemicalindustries, nes 13,209 13 4.117011300 Raw cane sugar specified in subheading note 2 to this chapter 11,404 11 3.517019900 Cane or beet sugar, in solid form, nes 10,197 10 3.211010000 Wheat or meslin flour 9,941 10 3.115<strong>121</strong>900Sunflower-seed and safflower oil (excl. Crude) and fractionsthere<strong>of</strong> 8,138 8 2.510059000 Maize (excl. Seed) 5,050 5 1.6Other Products 82,418 82 25.5Percent <strong>of</strong> Total April Exports 6.5UNITED ARAB EMIRATES 302,096 302 100.022089000 Other spirituous beverages, nes 173,420 173 57.424022000 Cigarettes containing tobacco 51,547 52 17.174031100 Cathodes and sections <strong>of</strong> cathodes <strong>of</strong> refined copper 42,772 43 14.222087000 Liqueurs and cordials 10,265 10 3.418063200Chocolate, etc, containing cocoa in blocks, slabs or bars, notfilled 4,894 5 1.633030000 Perfumes and toilet waters 4,704 5 1.624012000 Tobacco, partly or wholly stemmed/stripped 4,016 4 1.333079000 Other perfumery, cosmetic or toilet preparations, nes 2,718 3 0.948211000 Printed paper or paperboard labels <strong>of</strong> all kinds 1,789 2 0.639239000 Articles for the packing <strong>of</strong> goods, <strong>of</strong> plastics, nes 1,197 1 0.4Other Products 4,773 5 1.6Percent <strong>of</strong> Total April Exports 6.1Other Destinations K 709,977 KR 710 14.2Total Value <strong>of</strong> April Exports K 4,966,979 KR 4,967Source: CSO, International Trade Statistics, <strong>2013</strong>Note: (*) ProvisionalExport Market Shares by Regional Groupings, April andMarch <strong>2013</strong>Asia regional grouping was the largestmarket for Zambia’s total exports,accounting for 31.5 percent in April <strong>2013</strong>.Within Asia, China dominated the exportmarket, accounting for 66.0 percent.Other notable markets in Asia wereUnited Arab Emirates, India, Hong Kongand Japan.<strong>The</strong> Southern African DevelopmentCommunity (SADC) was the secondlargest market for Zambia’s total exports,accounting for 24.8 percent in April <strong>2013</strong>.Within SADC, South Africa was thedominant market with 54.0 percent.Other notable markets in SADC wereCongo DR, Zimbabwe, Namibia andMalawi.<strong>The</strong> Common Market for Eastern andSouthern Africa (COMESA) was the thirdlargest market for Zambia’s total exportsaccounting for 9.9 percent in April <strong>2013</strong>.Within COMESA, Congo DR was thedominant market with 65.9 percent.Other markets in COMESA wereZimbabwe, Malawi, Kenya and Mauritius.<strong>The</strong> European Union (EU) was the fourthlargest market for Zambia’s total exportsaccounting for 3.4 percent in April <strong>2013</strong>.Within the EU, United Kingdom was thedominant market with 50.0 percent.Other notable markets wereLuxembourg, Belgium, Netherlands, andGermany.10 | Page
GROUPINGExport Market Shares by Regional Groupings, April and March <strong>2013</strong>(K 'Million)April <strong>2013</strong>*Value(KRMillion)%ShareGROUPING(K'Million)March <strong>2013</strong>®Value(KRMillion)% ShareASIA 1,565,457 1,565 100.0 SADC 1,467,259 1,467 100.0CHINA 1,033,031 1,033 66.0 CONGO DR 824,961 825 56.2UNITED ARABEMIRATES 302,096 302 19.3 SOUTH AFRICA 411,740 412 28.1INDIA 153,103 153 9.8 ZIMBABWE 96,432 96 6.6HONG KONG 54,850 55 3.5 MOZAMBIQUE 56,932 57 3.9JAPAN 17,267 17 1.1 NAMIBIA 32,166 32 2.2Other ASIA 5,110 5 0.3 Other SADC 45,027 45 3.1% <strong>of</strong> Total AprilExports 31.5% <strong>of</strong> Total MarchExports 31.4SADC 1,229,477 1,229 100.0 ASIA 1,426,540 1,427 100.0SOUTH AFRICA 664,388 664 54.0 CHINA 1,081,524 1,082 75.8CONGO DR 322,832 323 26.3 INDIA 173,883 174 12.2ZIMBABWE 74,137 74 6.0 UNITED ARAB EMIRATES 149,536 150 10.5NAMIBIA 59,820 60 4.9 JAPAN 12,721 13 0.9MALAWI 47,984 48 3.9 SINGAPORE 7,689 8 0.5Other SADC 60,316 60 4.9 Other ASIA 1,187 1 0.1% <strong>of</strong> Total AprilExports 24.8% <strong>of</strong> Total MarchExports 30.5COMESA 490,046 490 100.0 COMESA 995,204 995 100.0CONGO DR 322,832 323 65.9 CONGO DR 824,961 825 82.9ZIMBABWE 74,137 74 15.1 ZIMBABWE 96,432 96 9.7MALAWI 47,984 48 9.8 KENYA 51,380 51 5.2KENYA 21,734 22 4.4 MALAWI 11,508 12 1.2MAURITIUS 15,465 15 3.2 RWANDA 4,108 4 0.4Other COMESA 7,894 8 1.6 Other COMESA 6,814 7 0.7% <strong>of</strong> Total AprilExports 9.9% <strong>of</strong> Total MarchExports 21.3EUROPEAN UNION 168,474 168 100.0 EUROPEAN UNION 76,562 77 100.0UNITED KINGDOM 84,235 84 50.0 UNITED KINGDOM 44,419 44 58.0LUXEMBOURG 42,621 43 25.3 LUXEMBOURG 12,971 13 16.9BELGIUM 23,479 23 13.9 NETHERLANDS 9,694 10 12.7NETHERLANDS 7,488 7 4.4 GERMANY 3,696 4 4.8GERMANY 5,614 6 3.3 SWEDEN 1,401 1 1.8Other EU 5,038 5 3.0 Other EU 4,381 4 5.7% <strong>of</strong> Total April% <strong>of</strong> Total MarchExports 3.4Exports 1.6Total Value <strong>of</strong> AprilTotal Value <strong>of</strong> MarchExports 4,966,979 4,967 Exports 4,678,874 4,679Source: CSO, International Trade Statistics, <strong>2013</strong>Note: (*) Provisional(R) RevisedImports by Major Product Categories, April and March <strong>2013</strong>Zambia’s major import products bycategory in April <strong>2013</strong> were Capitalgoods, accounting for 41.9 percent. <strong>The</strong>Raw materials category was second with22.6 percent, followed by intermediateGoods with 20.1 percent. Consumergoods category was fourth with 15.3percent. In April and March <strong>2013</strong>, thecountry has been a net importer <strong>of</strong>Capital goods, contributing an average<strong>of</strong> 43.5 percent <strong>of</strong> the total imports.11 | Page
DescriptionImports (cif) by Major Product Categories April and March <strong>2013</strong>ValueApril <strong>2013</strong>* March <strong>2013</strong>Value(K' million) (KR Million) % Share (K' million) (KR Million)% ShareConsumer Goods 711,724 712 15.3 722,446 722 16.5Raw Materials 1,050,220 1,050 22.6 906,166 906 20.7Intermediate Goods 932,611 933 20.1 770,113 770 17.6Capital Goods 1,942,970 1,943 41.9 1,972,996 1,973 45.1Total: 4,637,524 4,638 100.0 4,371,721 4,372 100.0Source: CSO, International Trade Statistics, <strong>2013</strong>Note: (*) Provisional(R) RevisedZambia’s Major Import Sources by Commodity in April <strong>2013</strong><strong>The</strong> major source <strong>of</strong> Zambia’s imports inApril <strong>2013</strong> was South Africa, accountingfor 29.7 percent. <strong>The</strong> major importproducts were Dumpers for <strong>of</strong>f-highwayuse, contributing 5.4 percent.<strong>The</strong> second main source <strong>of</strong> Zambia’simports was Congo DR which accountedfor 22.8 percent. <strong>The</strong> major importproducts were Copper ores andconcentrates, which accounted for 74.7percent.<strong>The</strong> third main source <strong>of</strong> Zambia’s importswas China, accounting for 9.2 percent <strong>of</strong>the total value <strong>of</strong> imports. <strong>The</strong> mainimport products were Base Stationsaccounting for 9.6 percent.Other sources <strong>of</strong> Zambia’s imports wereKenya and Japan, which collectivelyaccounted for 9.2 percent.Zambia’s Five Major Import Sources by Product for April <strong>2013</strong>Country /Hs-CodeDescriptionApril <strong>2013</strong>*Value(K' Million) (KR 'Million)%ShareSOUTH AFRICA 1,377,638 1,378 100.087041000 Dumpers for <strong>of</strong>f-highway use 73,958 74 5.473089090 Structures and parts <strong>of</strong> structures, nes, <strong>of</strong> iron or steel - Other 38,000 38 2.828020010 Sulphur, sublimed or precipitated; colloidal sulphur - In bulk 32,542 33 2.484749000 Parts <strong>of</strong> machinery <strong>of</strong> 84.74 27,989 28 2.0Other medicaments <strong>of</strong> mixed or unmixed products, for retail sale,30049000 nes 20,893 21 1.527101950 Cutting oil,grease cutting oils,cleaning oils etc. 18,821 19 1.431059000 Other fertilizers, nes 18,815 19 1.485171200 Telephones for cellular networks or for other wireless networks 18,079 18 1.384314900 Parts <strong>of</strong> machinery <strong>of</strong> 84.26, 84.29 and 84.30, nes 17,521 18 1.384378000 Machinery for milling or working cereals or dried vegetables 16,623 17 1.2Other Products 1,094,398 1,094 79.4Percent <strong>of</strong> Total April Imports 29.7CONGO DR 1,057,159 1,057 100.026030000 Copper ores and concentrates 789,752 790 74.726050000 Cobalt ores and concentrates 134,124 134 12.712 | Page
Country /Hs-CodeDescriptionApril <strong>2013</strong>*Value(K' Million) (KR 'Million)%Share28220010 Cobalt oxides and hydroxides; commercial cobalt oxides in bulk 116,709 117 11.028369910 Other carbonates; peroxocarbonates in bulk 4,292 4 0.4Rock drilling/earth boring tools(excl.with working part <strong>of</strong>82071900 cermets);parts 4,025 4 0.474061000 Copper powders <strong>of</strong> non-lamellar structure 3,549 4 0.3Parts for boring or sinking machinery <strong>of</strong> subheading 8430.41 or84314300 8430.49 2,081 2 0.284137000 Centrifugal pumps for liquids, nes 456 0 0.084304900 Boring or sinking machinery (excl. self-propelled) 333 0 0.084295100 Self-propelled front-end shovel loaders 208 0 0.0Other Products 1,629 2 0.2Percent <strong>of</strong> Total April Imports 22.8CHINA 427,507 428 100.085176100 Base stations 40,831 41 9.684109000 Parts <strong>of</strong> hydraulic turbines, water wheels including regulators 37,593 38 8.884742000 Crushing or grinding machines for earth, stone, ores, etc 27,228 27 6.473089090 Structures and parts <strong>of</strong> structures, nes, <strong>of</strong> iron or steel - Other 19,236 19 4.587042300 Goods vehicles, with diesel or semi-diesel engines, gvw >20tonnes 14,496 14 3.4Earth moving, excavating, extracting... machinery, not selfpropelled8430690012,471 12 2.984119900 Parts <strong>of</strong> gas turbines (excl. <strong>of</strong> turbo-jets and turbo-propellers) 12,194 12 2.9Structures and parts <strong>of</strong> structures, nes, <strong>of</strong> iron or steel - minlead73089020 frames & super strs 9,863 10 2.384295100 Self-propelled front-end shovel loaders 9,620 10 2.328080010 Nitric acid; sulphonitric acids in bulk 7,901 8 1.8Other Products 236,075 236 55.2Percent <strong>of</strong> Total April Imports 9.2KENYA 290,267 290 100.027101910 Gas oils. 177,360 177 61.12710<strong>121</strong>0 Motor Spirit 84,887 85 29.215171000 Margarine (excl. liquid) 3,103 3 1.124022000 Cigarettes containing tobacco 2,036 2 0.763014000 Blankets (excl. electric blankets), etc, <strong>of</strong> synthetic fibres 1,875 2 0.6Other soap and organic surface-active products in bars, etc, for34011190 toilet use 1,717 2 0.676069200 Plates (excl. rectangular) <strong>of</strong> aluminium alloys, >0.2mm thick 1,543 2 0.539202090 Other Plates <strong>of</strong> polymers <strong>of</strong> propylene, not reinforced, etc 1,410 1 0.534022000 Washing and cleaning preparations, put up for retail sale 1,141 1 0.4Table, kitchen or other household articles and parts there<strong>of</strong>; pot76151000 scourers, pads, gloves 1,111 1 0.4Other Products 14,085 14 4.9Percent <strong>of</strong> Total April Imports 6.3JAPAN 135,870 136 100.087032390Vehicles with engine capacity exceeding 1500cc but notexceeding 3000cc - OTHER. 43,893 44 32.387032290Vehicles with engine capacity exceeding 1000cc but notexceeding 1500cc:OTHER 21,834 22 16.187042190Diesel Non dual purpose vehicles for either persons or goods upto5 tonnes 18,647 19 13.713 | Page
Country /Hs-CodeDescriptionApril <strong>2013</strong>*Value(K' Million) (KR 'Million)%Share8703339087032490Vehicles with diesel... engine <strong>of</strong> cylinder capacity >=2500cc -OTHER 7,710 8 5.7Vehicles with spark-ignition engine <strong>of</strong> cylinder capacity >=3000cc -OTHER 4,336 4 3.268109100 Prefabricated structural components for building, etc, <strong>of</strong> cement... 4,271 4 3.1Other: Vehicles with spark-ignition engine <strong>of</strong> cylinder capacity87032190
Import Market Shares by Regional Groupings, April and March <strong>2013</strong>GROUPINGApril <strong>2013</strong>*March <strong>2013</strong>®ValueValue%(K 'Million) (KR Million) Share GROUPING(K 'Million) (KR Million)SADC 2,577,562 2,578 100.0 SADC 2,334,662 2,335 100.0South Africa 1,377,638 1,378 53.4 South Africa 1,393,182 1,393 59.7Congo DR 1,057,159 1,057 41.0 Congo DR 825,416 825 35.4Zimbabwe 48,098 48 1.9 Zimbabwe 44,623 45 1.9Tanzania 35,511 36 1.4 Tanzania 28,047 28 1.2Namibia 17,757 18 0.7 Namibia 15,150 15 0.6Other SADC 41,399 41 1.6 Other SADC 28,244 28 1.2% <strong>of</strong> April Imports 55.6 % <strong>of</strong> March Imports 53.4COMESA 1,427,438 1,427 100.0 COMESA 1,227,936 1,228 100.0Congo DR 1,057,159 1,057 74.1 Congo DR 825,416 825 67.2Kenya 290,267 290 20.3 Kenya 319,254 319 26.0Zimbabwe 48,098 48 3.4 Zimbabwe 44,623 45 3.6Swaziland 12,258 12 0.9 Egypt 13,471 13 1.1Egypt 8,330 8 0.6 Uganda 7,460 7 0.6Other COMESA 11,326 11 0.8 Other COMESA 17,712 18 1.4% <strong>of</strong> April Imports 30.8 % <strong>of</strong> March Imports 28.1ASIA 1,065,456 1,065 100.0 ASIA 1,090,954 1,091 100.0China 427,507 428 40.1 China 332,249 332 30.5Japan 135,870 136 12.8 Japan 212,626 213 19.5India 126,191 126 11.8 India 199,650 200 18.3Singapore 104,230 104 9.8 United Arab Emirates 111,629 112 10.2United Arab Emirates 90,931 91 8.5 Kuwait 51,872 52 4.8Other ASIA 180,727 181 17.0 Other ASIA 182,928 183 16.8% <strong>of</strong> April Imports 23.0 % <strong>of</strong> March Imports 25.0EUROPEAN UNION 470,380 470 100.0 EUROPEAN UNION 376,344 376 100.0United Kingdom 123,376 123 26.2 United Kingdom 100,591 101 26.7Germany 104,796 105 22.3 Ireland 50,019 50 13.3Sweden 49,038 49 10.4 Sweden 46,650 47 12.4Ireland 47,626 48 10.1 Netherlands 42,056 42 11.2Belgium 34,041 34 7.2 Spain 33,634 34 8.9Other EU 111,504 112 23.7 Other EU 103,392 103 27.4% <strong>of</strong> April Imports 10.1 % <strong>of</strong> March Imports 8.6%ShareTotal Value <strong>of</strong> AprilImports 4,637,524 4,638Source: CSO, International Trade Statistics, <strong>2013</strong>Note: (*) Provisional(R) Revised figuresTotal Value <strong>of</strong> MarchImports 4,371,721 4,37215 | Page
AGRICULTURE STATISTICS<strong>The</strong> National Food Balance Sheet for the <strong>2013</strong>/2014Agriculture Marketing Season<strong>The</strong> 2012/<strong>2013</strong> Crop Forecasting Survey(CFS) results show that the total nationalmaize requirement for Zambia during the<strong>2013</strong>/2014 agricultural marketing seasonis 2,534,026 metric tonnes.<strong>The</strong> total maize available this season ismade up <strong>of</strong> 2,532, 800 metric tonnes thatis expected to be produced during the2012/<strong>2013</strong> Agricultural Season and455,221 metric tonnes carry-over stocksavailable sat 1st <strong>May</strong> <strong>2013</strong>.Zambia is therefore expected to have amaize surplus <strong>of</strong> 453,995 metric tonnes inthe <strong>2013</strong>/2014 Agricultural MarketingSeason. This outcome is partly as a result<strong>of</strong> the good rains that were experiencedespecially in the northern part <strong>of</strong> thecountry.<strong>The</strong> country is also expected to havesurpluses <strong>of</strong> cassava flour equivalent, andwheat <strong>of</strong> 336,953 and 146,839 metrictonnes, respectively. On the other hand,the country is expected to have a deficit<strong>of</strong> 15, 000 metric tonnes <strong>of</strong> Paddy rice.<strong>The</strong> total food surpluses (i.e. all cerealsplus cassava and potatoes) whenconverted to maize meal equivalent isexpected to be 896,677 metric tonnes.National Food Balance Sheet for Zambia for the <strong>2013</strong>/2014 Agricultural Marketing SeasonBased on the 2012/<strong>2013</strong> MAL/CSO Crop Forecasting Survey and MAL/Private SectorUtilization Estimates(Metric Tonnes)A. Availability:(i)Opening stocks (1st <strong>May</strong><strong>2013</strong>) 1/(ii)Total production(2012/13) 2/Maize455,2212,532,800Paddy Rice2,73744,747Wheat168,255273,584Sorghum &Millet6,03638,914Sweet andIrishpotatoes0210,392Cassavaflour01,114,583Total(maizeequivalent)629,5563,984,553Total availabilityB. Requirements:(i) Staple food requirements:Human consumption 3/Strategic Reserve Stocks (net) 4/(ii)Industrial requirements:Stock feed 5/Breweries 6/Grain retained for other uses 7/(iii)Losses 8/(iv) Structural cross-border trade 9/2,988,0211,429,739500,000223,300100,00034,347126,640120,00047,48455,7690004,4782,237441,839281,321000013,67944,95040,5400002,4641,946210,392199,872000010,5201,114,583721,901000055,7294,614,1092,533,816500,000223,300100,00041,088199,228120,000Total requirements2,534,026 62,484 295,000 44,950 210,392 777,630 3,717,432C. Surplus/deficit(A-B) 10/ 453,995 -15,000 146,839 0 0 336,953 896,677D. Potential Commercial exports 11/ -453,995 15,000 -146,839 0 0 0 0E. Food aid import requirements 12/ 0 0 0 0 0 0 0Notes:1/Stocks expected to be held by commodity traders, millers, brewers, FRA, DMMU and commercial and small scale farmersas at 1st<strong>May</strong><strong>2013</strong>.2/Production estimates by MAL/CSO. Cassava production is based on the total area under cassava, using an annual yieldfigure <strong>of</strong> 11.7 tonnes per hectare (MAFF Root and Tuber Improvement Programme, 1996). A flour extraction rate <strong>of</strong> 25% isused. Other tubers are sweet potatoes and Irish potatoes.16 | Page
3/Human staple food consumption represents 70% (1,470kCal/person/day, CSO) <strong>of</strong> total diet (2,100kCal/person/day,National Food and Nutrition Commission) for the national population <strong>of</strong> 14.58 million people (based on CSO Censusprojections with 2.8% growth rate projected to October 2012, midmarket. <strong>The</strong> food balance shows an overall surplus <strong>of</strong>staple foods. Food prices may affect the level <strong>of</strong> food consumption.4/ National strategic requirements expected to be carried over into the next season by FRA. (This amount <strong>of</strong> 500,000 Mtincludes equivalent quantity that is already budgeted for).5/ Estimated requirements by major stock feed producers.6/ Estimated requirements by industrial breweries.7/ Estimated retention <strong>of</strong> grain for other uses by smallholders.8/ Post harvest losses are estimated at 5% for grains, sweet potatoes and cassava, in line with estimates from other SADCcountries.9/ Structural exports represents cross-border trade, mostly to the DRC, that occurs on a continuing basis and that is likely tooccur during the 2012/13 marketing season. It does not include large-scale formal trade.10/ Expected surpluses or deficits that arise after meeting minimum overall staple human consumption requirements as wellas industrial Requirements.<strong>The</strong> total surplus/deficit is expressed as maize equivalent using energy values.<strong>The</strong> rice deficit is based on a 3 year rolling average <strong>of</strong> what is known to be imported each year, as indicated under D.For cassava, the surplus represents cassava that is still in the ground and may not necessarily be harvested.11/ Commercial imports/exports represent expected regional and international trade by the privates Sector.12/ Total estimated requirement for food relief among vulnerable groups, to be imported. This could be met with maize orother grains.Maize Production expected to decrease, 2012/<strong>2013</strong> CFSResults reveal!<strong>The</strong> 2012/<strong>2013</strong> Crop Forecasting Survey(CFS) results show that the production <strong>of</strong>Maize is expected to decrease by 11.2percent from 2,852,687 metric tonnes(MT) during the 2011/2012 agriculturalseason to 2,532,800 metric tonnes duringthe 2012/<strong>2013</strong> agricultural season.<strong>The</strong> results also show that area planted tomaize increased by 2.9 percent from1,274,983 hectares to 1,312,402 hectares.Furthermore, area harvested to maize isexpected to decrease by 7.1 percentfrom 1,074,658 hectares during the2011/2012 agricultural season to 997,880hectares during the 2012/<strong>2013</strong>agricultural season.<strong>The</strong> expected decrease in maizeproduction in the 2012/<strong>2013</strong> agriculturalseason could be attributed to the poordistribution <strong>of</strong> rains especially in Southern,Eastern, Lusaka and <strong>Central</strong> provinces.<strong>The</strong> outbreak <strong>of</strong> Army Worms is anotherfactor which affected output.<strong>The</strong> average yield <strong>of</strong> maize per hectare isalso expected to decrease by 13.7percent from 2.24 MT in 2011/2012Agricultural season to 1.93 MT in the2012/<strong>2013</strong> agricultural season.17 | Page
At provincial level, Western and LusakaProvinces are expected to have anincrease in maize production <strong>of</strong> 1.6 and0.1 percent, respectively. <strong>The</strong> rest <strong>of</strong> theprovinces are expected to have a lowermaize production compared to the lastAgricultural Season (2011/2012). <strong>The</strong>largest reduction <strong>of</strong> 27.0 percent inestimated maize production is expectedto be recorded in Luapula province.Expected Maize Production for the 2012/<strong>2013</strong> Agricultural SeasonProvinceArea planted (ha) Area expected to be harvested (ha) Expected production (MT) Yield (MT)2011/2012 2012/<strong>2013</strong> % Change 2011/2012 2012/<strong>2013</strong> % Change 2011/2012 2012/<strong>2013</strong> % Change 2011/2012 2012/<strong>2013</strong> % ChangeZambia 1,274,983 1,312,402 2.9 1,074,658 997,880 (7.1) 2,852,687 2,532,800 (11.2) 2.24 1.93 (13.7)<strong>Central</strong> 184,048 217,001 17.9 156,386 159,371 1.9 494,215 478,734 (3.1) 2.69 2.21 (17.8)Copperbelt 95,215 80,196 (15.8) 85,065 71,070 (16.5) 248,624 208,544 (16.1) 2.61 2.60 (0.4)Eastern 277,625 297,394 7.1 246,611 267,227 8.4 577,525 572,289 (0.9) 2.08 1.92 (7.5)Luapula 46,827 37,116 (20.7) 43,090 32,927 (23.6) 128,776 94,033 (27.0) 2.75 2.53 (7.9)Lusaka 36,936 43,667 18.2 33,123 36,334 9.7 96,823 96,907 0.1 2.62 2.22 (15.3)Muchinga 70,144 71,066 1.3 65,659 64,356 (2.0) 226,989 205,412 (9.5) 3.24 2.89 (10.7)Northern 98,576 80,429 (18.4) 94,165 72,038 (23.5) 271,380 210,479 (22.4) 2.75 2.62 (4.9)North-Western64,305 59,198 (7.9) 60,311 51,052 (15.4) 156,077 132,527 (15.1) 2.43 2.24 (7.8)Southern 309,557 330,234 6.7 232,584 195,587 (15.9) 573,176 453,532 (20.9) 1.85 1.37 (25.8)Western 91,751 96,101 4.7 57,664 47,918 (16.9) 79,103 80,343 1.6 0.86 0.84 (3.0)Source: CSO/MAL, Crop Forecasting Survey, 2011/2012 and 2012/<strong>2013</strong> Agricultural SeasonsOf the total 2,532,800 metric tonnes <strong>of</strong>maize expected to be produced thisAgricultural season, Eastern Province willaccount for 23 percent, followed by<strong>Central</strong> Province, which will account for19 percent <strong>of</strong> the total expectedproduction, while Southern Province isexpected to account for 18 percent.Western Province will contribute thelowest proportion <strong>of</strong> 3 percent to thetotal forecast maize production.Percentage Distribution <strong>of</strong> Estimated Maize Production by Province, 2012/<strong>2013</strong> AgriculturalSeasonSource: CSO/MAL, Crop Forecasting Survey, 2012/<strong>2013</strong> Agricultural Seasons18 | Page
Surveys/Activities being undertakenPrinting <strong>of</strong> the 2010 Census <strong>of</strong> Population and Housing NationalProvincial Descriptive Tables2010/2011 Zambia Economic Census Data Processing<strong>2013</strong> Labour Force Survey <strong>Final</strong> Report WritingTraining <strong>of</strong> the <strong>2013</strong>/<strong>2013</strong> Zambia Demographic and Health Survey(ZDHS) Field StaffAvailable Reports2012/<strong>2013</strong> Crop Forecasting Survey (Electronic Copy)2007 Zambia Demographic and Health Survey (ZDHS) (Electronic andPrint copy)2010 Census <strong>of</strong> Population and Housing National Analytical andDescriptive Tables Reports (Electronic and Print copy)2010 Census <strong>of</strong> Population and Housing Summary Report (Electronicand Print copy)2006/2010 Living Conditions Monitoring Survey Report (Electronic andPrint copy)19 | Page
SELECTED SOCIO-ECONOMIC INDICATORSPOPULATION 2000 to 20102000 2001 2002 2003 2004 2005 2006 2007 2008 2009 2010Total Population 9,885,591 10,089,492 10,409,441 10,744,380 11,089,691 11,441,461 11,798,678 12,160,516 12,525,791 12,896,830 13,092,666Population Growth Rate 2.5 3.1 3.1 3.1 3.1 3.1 3 3 2.9 2.9 2.8Life Expectancy at Birth 50 51.8 51.9 52.4 52.4 52.6 51.9 51.4 51.3 51.2 -POPULATION BY PROVINCE<strong>Central</strong> 1,012,257 1,032,574 1,066,992 1,103,387 1,141,256 1,180,124 1,219,980 1,260,491 1,301,776 1,343,835 1,307,111Copperbelt 1,581,221 1,611,569 1,662,155 1,714,225 1,767,165 1,820,443 1,874,081 1,927,576 1,980,824 2034012 1,972,317Eastern** 1,231,283 1,348,070 1,391,690 1,436,120 1,482,290 1,530,118 1,579,960 1,631,890 1,684,910 1,740,180 1,592,661Luapula 775,353 791,067 817,326 845,076 873,969 903,746 934,317 965,605 997,579 1,030,572 991,927Lusaka 1,391,329 1,413,010 1,453,690 1,495,730 1,538,000 1,579,769 1,620,730 1,660,070 1,697,730 1,733,830 2,191,225Muchinga* 524,186 - - - - - - - - - 711,657Northern** 809,400 1,277,250 1,315,650 1,357,540 1,401,340 1,445,730 1,490,330 1,534,170 1,577,310 1,619,980 1,105,824North-western 583,350 596,010 616,496 638,004 660,322 683,367 707,074 731,351 756,261 781,800 727,044Southern 1,212,124 1,235,134 1,275,470 1,318,161 1,362,382 1,407,433 1,453,324 1,499,462 1,545,880 1,592,864 1,589,926Western 765,088 774,929 795,247 816,983 839,757 863294 887,540 912,226 937,419 963,107 902,974Source: CSO, Population Projections ReportNote: 2000 figures are from the 2000 Census <strong>of</strong> Population and Housing while the 2001 to 2009 figures are Population Projections from the Projections Report. <strong>The</strong> 2010 figures are final 2010 Census <strong>of</strong> Population and Housing figures.*Muchinga was created in 2011**2000 Census figures were adjusted following the new provincial demarcations20 | P age
PERCENTAGE CHANGES IN GDP BY KIND OF ECONOMIC ACTIVITY - CONSTANT 1994 PRICESKIND OF ECONOMIC ACTIVITY 2003 2004 2005 2006 2007 2008 2009 2010 2011 2012*Agriculture, Forestry and Fishing 5.0 4.3 (0.6) 2.2 0.4 2.6 7.2 6.6 8.0 7.1Agriculture 8.0 6.1 (4.0) 3.0 (2.7) 1.9 12.4 13.6 14.0 11.6Forestry 4.3 4.3 3.6 1.4 3.7 3.7 3.7 3.7 3.7 3.7Fishing (0.7) (0.7) 0.5 1.8 1.8 1.8 1.8 (7.0) (2.0) (2.0)Mining and Quarrying 3.4 13.9 7.9 7.3 3.6 2.5 20.3 15.2 (5.2) (13.2)Metal Mining 3.3 13.5 7.1 9.0 4.4 2.5 19.7 16.0 (5.3) (13.3)Other mining and quarrying 10.7 35.8 42.9 (45.8) (45.5) (3.5) 99.6 (48.8) 8.1 4.0PRIMARY SECTOR 4.5 7.5 2.5 4.1 1.7 2.5 12.4 10.2 2.2 (1.2)Manufacturing 7.6 4.7 2.9 5.7 3.0 1.8 2.2 4.2 8.0 11.2Food, Beverages and Tobacco 8.6 5.8 3.6 8.9 7.6 3.0 4.9 7.4 9.3 11.8Textile, and leather industries 3.2 (1.9) (2.9) (1.3) (19.5) (23.6) (20.0) (56.8) (54.7) (9.1)Wood and wood products 11.4 4.2 3.6 0.7 3.7 12.1 2.6 13.4 6.1 3.7Paper and Paper products 8.2 2.5 10.6 0.3 0.7 29.3 6.2 22.7 18.5 16.2Chemicals, rubber and plastic products 4.9 8.5 3.2 4.6 4.2 5.2 (0.3) 2.7 7.2 12.8Non-metallic mineral products 14.9 14.4 7.4 (5.2) 2.3 5.0 11.7 13.0 25.0 16.9Basic metal products 15.1 3.1 (2.0) 1.9 (4.8) 23.0 (4.8) (2.0) (0.9) 12.0Fabricated metal products 5.3 4.8 7.4 5.0 7.8 (2.5) (3.4) 12.8 16.6 7.7Electricity, Gas and Water 0.4 (1.7) 5.4 10.5 1.0 (1.2) 6.8 7.4 8.2 2.3Construction 21.6 20.5 21.2 14.4 20.0 8.7 9.5 8.1 8.9 15.3SECONDARY SECTOR 10.8 9.1 10.0 9.8 10.0 4.7 6.2 6.5 8.5 12.3Wholesale and Retail Trade 6.1 5.0 2.4 2.0 2.4 2.7 2.3 4.2 7.5 7.9Restaurants, Bars and Hotels 6.9 6.4 11.7 16.1 9.6 5.0 (13.4) 10.2 7.9 2.1Transport, Storage and Communications 4.8 6.4 11.0 22.1 19.2 15.8 7.6 14.9 13.7 11.3Rail Transport (8.1) (1.8) (11.6) (2.6) (18.7) (20.2) (23.8) 13.1 4.4 (34.1)Road Transport 3.9 4.2 6.3 6.4 6.4 13.2 13.3 6.3 10.8 10.9Air Transport 3.9 18.1 10.8 33.5 24.1 13.7 (23.4) 19.1 13.1 9.5Communications 10.0 5.0 23.2 40.5 33.6 21.1 19.4 20.0 16.0 13.0Financial Institutions and Insurance 3.5 3.5 3.3 4.0 4.1 8.7 5.2 6.0 4.9 12.0Real Estate and Business services 4.0 4.0 3.2 3.2 3.1 3.0 2.8 3.0 2.9 2.9Community, Social and Personal Services 1.6 0.6 11.4 9.0 12.5 11.7 8.6 5.3 8.4 8.4Public Administration & Defence/Public sanitary services 0.2 0.2 6.2 (8.7) 14.8 2.2 0.4 (3.1) 10.6 10.6Education 3.0 0.3 22.2 35.3 13.6 19.6 15.2 11.8 7.5 7.5Health 2.5 (0.8) (2.2) 5.2 1.0 18.3 7.7 7.2 13.3 13.3Recreation, Religious, 4.5 4.3 34.1 22.8 9.3 26.7 17.7 5.0 2.8 2.8Personal Services 3.5 3.5 3.5 3.5 3.5 3.5 3.5 3.5 3.5 3.5TERTIARY SECTOR 4.5 4.2 5.4 6.7 7.1 7.2 3.9 6.6 7.8 8.2Less: FISIM 2.5 2.5 2.5 2.5 2.5 2.5 3.3 2.3 2.3 2.3TOTAL GROSS VALUE ADDED 6.0 6.2 5.8 7.0 6.7 5.7 6.4 7.6 6.8 7.3Taxes less subsidies on Products (2.7) (2.7) (0.1) (3.1) (0.3) 5.7 6.4 7.6 6.8 7.3TOTAL G.D.P. AT MARKET PRICES 5.1 5.4 5.3 6.2 6.2 5.7 6.4 7.6 6.8 7.3Source: CSO, National Statistics, 2012*Preliminary Estimates21 | P age
GDP BY KIND OF ECONOMIC ACTIVITY AT CURRENT PTICES (K’ BILLION)KIND OF ECONOMIC ACTIVITY 2000 2001 2002 2003 2004 2005 2006 2007 2008 2009 2010 2011 2012*Agriculture, Forestry and Fishing 2,002.2 2,582.0 3,247.4 4,244.6 5,568.2 6,723.6 7,800.2 9,139.5 10,863.8 13,461.4 15,642.3 18,094.8 20,439.1Agriculture 561.1 627.3 749.8 1,008.2 1,249.5 1,421.7 1,537.0 1,575.1 1,826.4 2,344.3 2,801.4 3,351.7 3,978.2Forestry 1,285.0 1,778.5 2,274.3 2,960.3 3,998.5 4,920.3 5,855.7 7,127.7 8,531.6 10,528.8 12,265.5 14,151.6 15,844.2Fishing 156.1 176.3 223.3 276.1 320.2 381.6 407.5 436.7 505.8 588.2 575.3 591.5 616.7Mining and Quarrying 416.1 518.9 575.1 564.8 809.6 1,030.9 1,612.5 2,037.2 1,998.9 1,682.1 2,837.8 3,144.1 2,315.3Metal Mining 407.9 511.3 568.8 558.2 798.3 1,011.7 1,597.5 2,027.2 1,989.8 1,669.3 2,828.1 3,131.9 2,304.6Other Mining and Quarrying 8.2 7.6 6.3 6.6 11.3 19.1 15.0 9.9 9.2 12.9 9.6 12.2 10.7PRIMARY SECTOR 2,418.4 3,101.0 3,822.5 4,809.4 6,377.7 7,754.5 9,412.8 11,176.7 12,862.7 15,143.5 18,480.0 21,238.9 22,754.4Manufacturing 1,024.6 1,293.1 1,693.6 2,241.0 2,827.7 3,430.2 4,015.7 4,487.4 5,149.6 6,016.9 6,770.8 7,797.5 9,201.6Food, Beverages and Tobacco 613.9 768.4 1,033.4 1,397.2 1,726.6 2,<strong>121</strong>.0 2,423.5 2,745.1 3,218.4 3,859.0 4,358.0 4,996.3 5,935.8Textile, and Leather Industries 180.4 224.2 284.5 352.9 450.7 500.4 630.8 611.4 506.7 445.2 214.5 106.7 103.9Wood and Wood Products 64.1 89.9 118.4 164.7 222.2 273.4 323.2 393.5 509.2 621.6 791.9 934.7 1,046.8Paper and Paper products 40.0 55.1 69.0 93.1 123.6 162.4 191.3 226.1 337.3 426.4 587.7 774.6 971.7Chemicals, rubber and plastic products 85.8 111.3 142.6 178.9 231.7 281.2 331.2 372.4 432.6 519.1 613.2 703.2 833.3Non-metallic mineral products 14.3 18.5 21.9 30.0 41.0 51.8 55.3 61.1 70.8 95.1 123.7 165.3 203.0Basic metal products 3.2 2.9 2.8 3.1 4.0 4.7 6.9 8.0 9.4 6.2 8.9 11.0 10.5Fabricated metal products 22.9 23.0 21.0 21.0 27.7 35.2 53.6 69.9 65.2 44.2 72.8 105.6 96.6Electricity, Gas and Water 328.0 445.3 488.3 595.1 694.7 922.7 1,165.9 1,345.0 1,512.4 1,779.8 2,201.8 2,910.4 3,137.7Construction 500.5 728.6 1,067.7 1,590.0 2,321.5 3,216.4 4,703.7 6,692.7 8,811.4 11,819.5 15,703.6 20,815.0 29,471.2SECONDARY SECTOR 1,853.1 2,466.9 3,249.6 4,426.1 5,843.9 7,569.2 9,885.3 12,525.1 15,473.4 19,616.2 24,676.1 31,522.8 41,810.5Wholesale and Retail trade 1,879.8 2,340.5 3,004.1 3,873.8 4,843.7 5,868.9 6,524.7 7,395.5 8,539.1 9,908.2 11,204.2 13,089.8 15,028.2Restaurants, Bars and Hotels 207.0 315.9 406.8 527.7 670.9 894.0 1,120.1 1,354.2 1,610.8 1,545.2 1,838.6 2,143.8 2,290.3Transport, Storage and Communications 635.7 852.6 1,055.9 1,058.2 1,252.3 1,395.6 1,629.2 1,984.4 2,248.9 2,355.2 3,076.5 3,578.4 4,009.1Rail Transport 54.9 72.7 82.7 89.5 100.8 93.8 94.7 91.9 79.0 66.2 105.9 122.6 86.0Road Transport 255.2 311.3 334.3 393.9 464.0 543.0 640.4 755.7 891.8 1,052.6 1,242.6 1,467.9 1,734.5Air Transport 99.0 133.7 129.7 152.7 203.0 243.8 356.0 488.6 573.4 453.6 611.0 737.2 844.9Communications 226.6 334.9 509.1 422.1 484.6 515.0 538.2 648.3 704.8 782.7 1,117.0 1,250.6 1,343.8Financial Intermediaries and Insurance 982.2 1,238.8 1,493.1 1,847.7 2,282.7 2,771.5 3,246.9 3,647.2 4,373.6 5,534.6 6,745.1 7,568.8 8,903.7Real Estate and Business services 660.6 832.8 1,041.2 1,341.2 1,691.8 1,979.4 2,296.4 2,678.2 3,138.4 3,671.6 4,306.1 5,327.9 5,811.3Community, Social and Personal Services 951.3 1,297.1 1,478.4 1,828.9 2,122.8 2,806.9 3,462.2 4,324.1 5,465.5 6,649.0 8,148.6 9,696.2 11,533.2Public Administration and Defence 500.1 610.2 646.8 752.2 797.3 1,002.2 983.0 1,258.3 1,446.1 1,647.3 1,732.7 2,082.4 2,502.7Education 256.1 394.3 496.9 688.6 867.7 1,254.2 1,842.6 2,335.3 3,092.8 3,890.8 4,694.2 5,542.0 6,542.9Health 107.0 175.5 203.6 252.4 292.8 338.8 389.9 445.2 576.9 690.9 1,246.2 1,522.9 1,861.2Recreation, Religious, Culture 36.4 52.7 48.5 29.1 31.7 50.3 67.1 81.8 114.7 147.4 167.1 188.6 212.9Personal services 51.7 64.4 82.7 106.6 133.3 161.5 179.6 203.5 235.0 272.7 308.3 360.2 413.6TERTIARY SECTOR 5,316.6 6,877.8 8,479.5 10,477.5 12,864.2 15,716.4 18,279.4 21,383.6 25,376.4 29,663.9 35,319.1 41,404.9 47,575.8Less: FISIM (564.4) (711.9) (858.1) (1,061.8) (1,311.8) (1,592.8) (1,865.9) (2,096.0) (2,513.4) (2,922.4) (3,876.3) (4,349.6) (5,116.8)TOTAL GROSS VALUE ADDED 9,023.6 11,733.7 14,693.6 18,651.2 23,774.0 29,447.4 35,711.6 42,989.4 51,199.1 61,501.2 74,599.0 89,816.9 107,023.9Taxes less subsidies on Products 1,097.7 1,460.0 1,630.8 1,899.9 2,219.1 2,594.2 2,849.2 3,205.4 3,640.4 3,114.3 3,067.6 3,527.5 4,025.5TOTAL G.D.P. AT MARKET PRICES 10,<strong>121</strong>.3 13,193.7 16,324.4 20,551.1 25,993.1 32,041.510 38,560.8 46,194.8 54,839.4 64,615.6 77,666.6 93,344.4 111,049.4Source: CSO, National Statistics, 2012*Preliminary Estimates22 | P age
PERIODTOTAL INDEXTOTAL MININGCoal2012 1ST QUARTER INDEX OF INDUSTRIAL PRODUCTION - ZAMBIAMININGNon-ferrousOreStone QuarryingTOTALMANUFACTURINGFood,Beverages& TobaccoTextile,Clothing& LeatherMANUFACTURINGWood &WoodProductsPaper &PaperProductsChemicals,Rubbers &PlasticsNonmetallicMineralProductsTOTALELECTRICITYWEIGHT 1000.0 572.0 14.0 557.0 1.0 367.0 104.0 74.0 13.0 21.0 67.0 19.0 9.0 61.0 61.01980 100.0 100.0 100.0 100.0 100.0 100.0 100.0 100.0 100.0 100.0 100.0 100.0 100.0 100.0 100.01981 98.6 91.2 87.6 91.3 77.7 108.7 111.7 119.7 96.6 117.2 101.4 101.3 86.7 103.3 106.21982 99.1 94.4 104.3 94.2 84.0 103.9 109.5 116.3 88.1 125.6 85.4 100.3 79.7 99.8 114.71983 100.1 92.7 78.2 93.0 82.1 110.2 117.9 125.8 71.8 136.1 102.5 95.3 80.3 94.6 109.21984 97.7 89.5 88.2 89.5 88.9 109.1 109.7 134.2 64.5 132.2 98.3 79.4 81.4 103.8 106.31985 98.5 86.8 88.2 86.8 81.2 114.9 117.7 162.9 68.1 <strong>121</strong>.9 89.3 91.2 96.4 97.3 109.11986 96.8 85.6 96.2 85.3 83.8 112.8 106.9 146.9 64.7 124.4 105.3 102.0 90.1 102.0 106.41987 96.2 83.6 80.0 83.7 84.7 116.6 109.1 124.7 68.6 190.9 119.0 130.2 91.7 100.4 91.31988 96.8 80.6 82.9 80.6 93.7 123.0 117.7 152.9 77.2 188.9 109.3 125.9 91.7 101.4 90.71989 98.1 81.9 68.2 82.1 162.2 122.0 112.7 159.9 87.0 145.8 109.0 129.7 66.8 111.0 73.11990 96.3 78.9 65.3 79.2 126.3 125.4 127.0 166.6 109.4 137.0 112.6 122.2 49.4 98.2 84.31991 90.0 72.0 65.4 72.0 142.1 117.8 130.9 139.4 109.8 134.4 99.4 117.9 50.2 95.0 94.21992 96.7 80.5 74.2 80.5 114.7 125.8 164.4 134.7 105.4 122.4 92.8 114.3 60.4 97.0 82.51993 88.3 73.5 56.7 73.8 92.7 111.8 158.5 95.2 111.1 <strong>121</strong>.8 97.4 104.2 59.3 73.5 85.31994 77.3 60.9 28.1 61.6 106.6 101.1 154.3 90.2 91.6 120.9 75.1 71.5 55.9 62.7 88.31995 73.1 54.5 26.2 55.1 94.5 98.5 161.4 79.9 83.4 94.7 67.6 75.6 54.0 65.8 89.71996 73.5 62.3 22.1 63.2 70.5 90.2 120.1 102.4 36.9 80.1 93.9 80.7 41.1 44.7 77.51997 75.5 62.4 28.4 63.1 <strong>121</strong>.9 93.4 84.0 174.3 24.7 66.7 98.0 77.3 33.7 43.0 89.81998 75.9 70.6 33.5 71.5 98.3 83.2 85.1 131.8 22.1 75.6 81.2 77.7 39.9 46.1 82.51999 66.5 52.8 26.1 53.4 105.2 86.2 87.9 146.4 23.8 79.4 81.1 82.9 41.6 38.3 76.2YEAR-ON-YEAR PERCENTAGE CHANGE1981 -1.4 -8.8 -12.4 -8.7 -22.3 8.7 11.7 19.7 -3.4 17.2 1.4 1.3 -13.3 3.3 6.21982 0.5 3.5 19.1 3.2 8.1 -4.4 -2.0 -2.8 -8.8 7.2 -15.8 -1.0 -8.1 -3.4 8.01983 1.0 -1.8 -25.0 -1.3 -2.3 6.1 7.7 8.2 -18.5 8.4 20.0 -5.0 0.8 -5.2 -4.81984 -2.4 -3.5 12.8 -3.8 8.3 -1.0 -7.0 6.7 -10.2 -2.9 -4.1 -16.7 1.4 9.7 -2.71985 0.8 -3.0 0.0 -3.0 -8.7 5.3 7.3 21.4 5.6 -7.8 -9.2 14.9 18.4 -6.3 2.61986 -1.7 -1.4 9.1 -1.7 3.2 -1.8 -9.2 -9.8 -5.0 2.1 17.9 11.8 -6.5 4.8 -2.51987 -0.6 -2.3 -16.8 -1.9 1.1 3.4 2.1 -15.1 6.0 53.5 13.0 27.6 1.8 -1.6 -14.21988 0.6 -3.6 3.6 -3.7 10.6 5.5 7.9 22.6 12.5 -1.0 -8.2 -3.3 0.0 1.0 -0.71989 1.3 1.6 -17.7 1.9 73.1 -0.8 -4.2 4.6 12.7 -22.8 -0.3 3.0 -27.2 9.5 -19.41990 -1.8 -3.7 -4.3 -3.5 -22.1 2.8 12.7 4.2 25.7 -6.0 3.3 -5.8 -26.0 -11.5 15.31991 -6.5 -8.7 0.2 -9.1 12.5 -6.1 3.1 -16.3 0.4 -1.9 -11.7 -3.5 1.6 -3.3 11.71992 7.4 11.8 13.5 11.8 -19.3 6.8 25.6 -3.4 -4.0 -8.9 -6.6 -3.1 20.3 2.1 -12.41993 -8.7 -8.7 -23.6 -8.3 -19.2 -11.1 -3.6 -29.3 5.4 -0.5 5.0 -8.8 -1.8 -24.2 3.41994 -12.5 -17.1 -50.4 -16.5 15.0 -9.6 -2.6 -5.3 -17.6 -0.7 -22.9 -31.4 -5.7 -14.7 3.51995 -5.4 -10.5 -6.8 -10.6 -11.4 -2.6 4.6 -11.4 -9.0 -21.7 -10.0 5.7 -3.4 4.9 1.61996 0.5 14.3 -15.6 14.7 -25.4 -8.4 -25.6 28.2 -55.8 -15.4 38.9 6.7 -23.9 -32.1 -13.61997 2.7 0.2 28.5 -0.2 72.9 3.5 -30.1 70.2 -33.1 -16.7 4.4 -4.2 -18.0 -3.8 15.91998 0.5 13.1 18.0 13.3 -19.4 -10.9 1.3 -24.4 -10.5 13.3 -17.1 0.5 18.4 7.2 -8.11999 -12.4 -25.2 -22.1 -25.3 7.0 3.6 3.3 11.1 7.7 5.0 -0.1 6.7 4.3 -16.9 -7.6BasicMetalIndustriesFabricatedMetalProducts23 | P age
PERIODTOTAL INDEXTOTAL MININGCoal2012 1ST QUARTER INDEX OF INDUSTRIAL PRODUCTION - ZAMBIAMININGNon-ferrousOreStone QuarryingTOTALMANUFACTURINGFood,Beverages& TobaccoTextile,Clothing& LeatherMANUFACTURINGWood &WoodProductsPaper &PaperProductsChemicals,Rubbers &PlasticsNonmetallicMineralProductsTOTALELECTRICITYWEIGHT 1.000 0.350 0.005 0.242 0.103 0.511 0.235 0.060 0.006 0.017 0.059 0.025 0.009 0.100 0.1392000 100.0 100.0 100.0 100.0 100.0 100.0 100.0 100.0 100.0 100.0 100.0 100.0 100.0 100.0 100.02001 Q1 108.6 114.3 60.4 120.8 101.3 101.1 113.4 64.4 110.8 68.8 66.2 93.7 61.3 124.8 <strong>121</strong>.72001 Q2 105.4 107.6 87.8 114.3 92.7 100.7 116.5 64.9 143.4 70.7 82.5 105.7 45.7 101.7 116.92001 Q3 101.1 110.6 68.4 114.3 103.6 90.9 108.6 71.5 126.6 65.6 60.0 131.1 63.2 73.4 115.02001 Q4 105.3 123.1 47.5 139.1 89.0 92.5 111.8 71.0 111.0 73.6 62.7 96.4 56.1 81.7 107.82001 105.1 113.9 66.0 122.1 96.7 96.3 112.6 68.0 123.0 69.7 67.9 106.7 56.6 95.4 115.32002 Q1 99.5 118.2 39.0 138.7 73.5 79.6 96.9 61.1 138.8 69.6 79.4 103.1 93.5 41.2 125.52002 Q2 100.6 107.1 43.2 123.6 71.0 97.2 <strong>121</strong>.8 74.6 132.5 69.0 73.5 107.6 44.0 71.3 96.52002 Q3 108.9 112.2 53.6 122.0 91.8 109.5 138.7 88.4 125.6 62.0 79.5 102.1 55.6 84.4 98.92002 Q4 105.4 108.2 65.2 119.6 83.3 103.1 130.8 64.8 132.3 84.4 62.8 <strong>121</strong>.2 42.9 87.0 106.62002 103.6 111.4 50.2 126.0 79.9 97.3 122.0 72.2 132.3 71.2 73.8 108.5 59.0 71.0 106.92003 Q1 110.5 132.6 42.0 149.0 98.1 94.4 107.0 73.6 152.5 79.7 74.4 <strong>121</strong>.8 70.9 82.7 113.82003 Q2 115.8 129.8 44.0 144.2 99.7 108.1 134.1 74.7 152.0 73.6 80.0 139.5 57.5 83.3 109.22003 Q3 115.9 130.6 54.2 138.0 116.4 109.3 137.1 75.0 145.9 75.1 80.6 <strong>121</strong>.7 80.7 84.5 103.52003 Q4 110.2 113.9 36.5 128.8 82.4 110.3 139.2 74.8 138.6 80.0 83.3 115.1 62.4 86.2 100.72003 113.1 126.7 44.2 140.0 99.1 105.5 129.4 74.5 147.3 77.1 79.6 124.5 67.9 84.1 106.82004 Q1 125.5 167.1 28.6 184.8 131.6 101.2 108.1 65.7 164.3 84.3 101.4 134.7 66.6 99.3 110.62004 Q2 119.8 144.6 53.0 165.0 100.8 107.3 134.6 52.7 166.4 82.7 78.8 154.5 74.7 83.9 103.12004 Q3 120.1 139.8 81.3 155.8 104.8 111.4 143.1 57.2 126.2 66.4 87.5 139.8 73.7 86.2 102.82004 Q4 126.4 139.0 83.6 140.3 138.7 125.6 161.9 116.6 157.1 82.8 72.3 141.3 65.0 83.3 97.62004 122.9 147.6 61.6 161.5 119.0 111.3 136.9 73.1 153.5 79.1 85.0 142.5 70.0 88.2 103.52005 Q1 131.8 174.0 68.6 174.7 177.1 108.8 123.4 63.3 177.6 91.1 104.4 150.7 63.8 96.3 110.02005 Q2 130.4 166.0 97.3 174.7 148.6 111.2 137.1 46.9 173.0 90.3 81.8 171.9 64.7 94.8 111.32005 Q3 133.9 167.1 84.7 164.6 176.5 118.0 147.9 56.4 140.7 75.3 109.8 147.2 72.4 91.8 108.72005 Q4 140.4 170.6 105.2 177.4 157.6 128.0 166.3 111.5 144.7 92.4 67.0 154.4 67.7 87.5 109.62005 133.2 169.4 89.0 172.8 165.0 114.8 143.7 69.5 159.0 87.3 90.8 156.0 67.2 92.6 109.92006 Q1 147.8 214.3 35.4 217.0 215.9 108.0 126.8 62.9 166.6 93.3 111.0 139.1 66.2 83.8 126.72006 Q2 144.8 194.4 58.9 209.0 166.2 115.0 144.8 46.8 164.1 91.8 87.6 163.6 62.3 95.3 129.62006 Q3 143.9 179.9 45.6 176.2 194.5 125.7 162.5 55.7 156.5 72.6 96.6 150.2 74.2 103.8 120.32006 Q4 142.4 158.3 9.5 150.3 183.7 137.5 185.4 98.0 157.2 91.2 69.7 143.9 70.9 99.1 120.72006 144.7 186.7 37.4 188.1 190.1 <strong>121</strong>.5 154.9 65.9 161.1 87.2 91.2 149.2 68.4 95.5 124.32007 Q1 146.5 206.9 8.5 196.6 239.8 109.9 129.0 61.1 176.4 92.4 116.6 117.7 64.5 91.0 129.52007 Q2 153.1 211.5 10.5 200.5 246.4 120.8 162.1 42.4 171.6 92.7 95.4 148.3 61.1 85.6 125.12007 Q3 155.1 200.5 6.0 210.2 186.2 133.7 178.3 33.1 164.6 69.2 96.2 153.3 67.2 <strong>121</strong>.3 119.52007 Q4 159.5 195.8 8.3 191.4 214.5 143.8 197.1 75.6 155.3 96.9 72.0 149.6 67.8 114.1 126.22007 153.6 203.7 8.3 199.7 221.7 127.0 166.6 53.0 167.0 87.8 95.0 142.2 65.1 103.0 125.12008 Q1 159.0 243.1 7.4 227.8 289.4 113.5 131.9 54.8 205.3 107.4 134.2 125.4 80.2 88.8 114.62008 Q2 158.1 219.5 0.1 197.0 281.9 125.3 169.0 37.3 216.8 123.1 98.2 152.7 86.6 82.5 124.12008 Q3 163.5 217.9 0.0 196.2 278.3 137.8 189.5 21.7 159.5 88.4 95.0 155.1 84.8 118.3 <strong>121</strong>.82008 Q4 164.0 209.8 0.0 196.8 249.6 142.5 196.2 48.5 167.2 135.2 77.6 164.2 68.9 112.0 127.82008 161.2 222.5 1.9 204.4 274.8 129.8 171.6 40.6 187.2 113.5 101.3 149.3 80.1 100.4 122.1BasicMetalIndustriesFabricatedMetalProducts24 | P age
PERIODMININGMANUFACTURINGTOTALTOTALNonferrousMANUFACTURIN Beverages & Clothing &Rubbers & MineralMetalTOTALFood, Textile,Chemicals, Non-metallicFabricatedTOTALStoneWood & Wood Paper & PaperBasic MetalELECTRICITINDEXCoalMININGQuarryingProducts ProductsIndustriesYOreGTobacco LeatherPlastics ProductsProducts2009 Q1 169.0 266.3 0.0 251.4 312.8 111.6 136.9 45.5 219.4 112.5 137.1 136.7 82.1 66.5 134.92009 Q2 169.8 247.3 83.1 229.0 297.3 127.0 177.2 29.2 230.3 132.1 98.9 166.6 84.9 70.6 132.82009 Q3 170.7 232.3 48.6 208.3 296.6 138.8 196.7 15.2 162.2 96.7 85.9 178.8 76.9 109.0 133.02009 Q4 174.4 228.2 0.0 208.0 285.9 150.0 210.5 40.1 156.2 138.0 80.8 182.9 61.0 116.0 128.72009 171.0 243.5 32.9 224.2 298.1 131.8 180.3 32.5 192.1 119.8 100.7 166.2 76.2 90.5 132.42010 Q1 180.1 287.0 0.0 272.7 333.4 117.2 146.0 26.3 248.2 136.4 136.9 150.8 80.3 75.8 142.42010 Q2 186.9 273.4 0.0 261.7 312.9 138.5 193.6 22.8 261.2 171.5 98.6 189.8 84.8 80.6 147.22010 Q3 190.1 272.4 0.0 261.9 308.9 146.7 204.6 3.5 177.9 120.2 87.5 199.6 78.4 126.7 142.52010 Q4 193.1 260.6 0.0 248.3 301.0 160.2 230.3 3.6 183.4 159.9 90.8 211.1 55.4 125.4 144.22010 187.5 273.3 0.0 261.1 314.1 140.6 193.6 14.0 217.7 147.0 103.5 187.8 74.7 102.1 144.12011 Q1 193.9 307.0 0.0 297.0 343.9 125.1 153.0 14.1 261.7 169.3 154.5 178.8 79.0 83.5 162.42011 Q2 197.8 279.8 0.0 264.5 328.1 152.0 212.4 4.5 275.3 184.1 99.0 233.1 83.6 101.9 159.9Q1+Q2 195.8 293.4 0.0 280.8 336.0 138.5 182.7 9.3 268.5 176.7 126.7 205.9 81.3 92.7 161.22011 Q3 198.3 260.7 0.0 226.1 353.6 166.3 227.5 3.4 194.8 149.5 91.5 253.0 77.3 151.2 159.02011 Q4 202.0 255.4 0.0 227.3 332.6 178.8 253.2 3.4 192.3 193.5 98.7 274.1 56.2 139.9 152.92011 198.0 275.7 0.0 253.7 339.5 155.6 211.5 6.4 231.0 174.1 110.9 234.7 74.0 119.1 158.62012 Q1 195.8 277.3 0.0 248.2 357.8 148.4 186.0 13.0 276.4 197.9 174.4 235.4 82.6 93.4 165.02012 Q2 195.2 255.433.4223.0 341.2 160.7 222.4 3.9 280.6 212.7 111.6 246.1 99.5 106.4 170.9Q1+Q2 195.5 266.3 16.7 235.6 349.5 154.5 204.2 8.4 278.5 205.3 143.0 240.7 91.1 99.9 168.0YEAR-ON-YEAR PERCENTAGE CHANGES e.g. (Q2 2005/Q2 2004-1)*1002001 5.1 13.9 (34.0) 22.1 (3.3) (3.7) 12.6 (32.0) 23.0 (30.3) (32.1) 6.7 (43.4) (4.6) 15.32002 Q1 (8.4) 3.4 (35.4) 14.8 (27.4) (21.3) (14.6) (5.2) 25.3 1.2 20.0 10.0 52.6 (67.0) 3.1Q2 (4.6) (0.5) (50.8) 8.1 (23.4) (3.5) 4.6 15.0 (7.6) (2.5) (10.9) 1.8 (3.6) (29.8) (17.5)Q3 7.7 1.5 (21.7) 6.7 (11.4) 20.4 27.7 23.6 (0.8) (5.5) 32.6 (22.1) (12.0) 15.0 (14.0)Q4 0.0 (12.1) 37.3 (14.0) (6.4) 11.5 16.9 (8.8) 19.2 14.6 0.1 25.7 (23.6) 6.4 (1.0)2002 (1.4) (2.2) (23.9) 3.1 (17.3) 1.1 8.4 6.3 7.6 2.2 8.8 1.7 4.3 (25.6) (7.3)2003 Q1 11.0 12.2 7.6 7.5 33.4 18.6 10.5 20.6 9.9 14.5 (6.3) 18.2 (24.2) 100.9 (9.3)Q2 15.2 21.2 1.9 16.6 40.4 11.2 10.1 0.1 14.7 6.7 8.8 29.6 30.7 16.7 13.1Q3 6.4 16.4 1.1 13.1 26.8 (0.1) (1.2) (15.2) 16.1 21.2 1.3 19.2 45.1 0.0 4.7Q4 4.6 5.3 (44.0) 7.7 (1.1) 7.0 6.5 15.4 4.8 (5.2) 32.7 (5.0) 45.4 (0.9) (5.6)2003 9.2 13.7 (12.1) 11.1 24.1 8.4 6.0 3.2 11.3 8.2 7.8 14.8 15.0 18.5 (0.1)2004 Q1 13.6 26.0 (32.0) 24.0 34.2 7.2 1.0 (10.8) 7.8 5.8 36.2 10.6 (6.0) 20.1 (2.8)Q2 3.4 11.4 20.5 14.4 1.1 (0.8) 0.4 (29.4) 9.4 12.4 (1.5) 10.7 29.8 0.8 (5.5)Q3 3.6 7.1 50.0 12.9 (10.0) 1.9 4.4 (23.7) (13.5) (11.6) 8.6 14.8 (8.7) 2.1 (0.7)Q4 14.6 22.1 128.9 8.9 68.4 13.8 16.3 56.0 13.3 3.5 (13.2) 22.7 4.2 (3.3) (3.1)2004 8.7 16.5 39.5 15.3 20.0 5.5 5.9 (2.0) 4.2 2.5 6.8 14.5 3.1 4.8 (3.0)2005 Q1 5.0 4.1 140.3 (5.5) 34.5 7.5 14.1 (3.5) 8.1 8.0 2.9 11.9 (4.3) (3.1) (0.5)Q2 8.9 14.8 83.5 5.9 47.4 3.7 1.8 (11.0) 4.0 9.1 3.8 11.3 (13.4) 13.0 8.0Q3 11.4 19.5 4.2 5.7 68.3 5.9 3.4 (1.5) 11.6 13.5 25.6 5.4 (1.7) 6.6 5.6Q4 11.1 22.7 25.9 26.5 13.7 2.0 2.7 (4.4) (7.9) 11.5 (7.3) 9.3 4.2 5.0 12.32005 8.4 14.8 44.4 7.1 38.6 3.1 4.9 (4.8) 3.6 10.4 6.8 9.5 (4.1) 5.0 6.225 | P age
PERIODTOTALINDEXTOTAL MININGCoalMININGNon-ferrousOreStone QuarryingTOTALMANUFACTURINGFood,Beverages &TobaccoTextile,Clothing&LeatherWood &WoodProductsMANUFACTURINGPaper &PaperProductsChemicals,Rubbers &PlasticsNonmetallicMineralProductsBasicMetalIndustriesFabricatedMetalProductsTOTALELECTRICITY2006 Q1 12.2 23.2 (48.4) 24.2 21.9 (0.7) 2.7 (0.7) (6.2) 2.5 6.3 (7.7) 3.8 (12.9) 15.1Q2 11.0 17.1 (39.4) 19.6 11.8 3.4 5.6 (0.2) (5.2) 1.7 7.2 (4.8) (3.7) 0.5 16.4Q3 7.5 7.7 (46.2) 7.0 10.2 6.5 9.8 (1.2) 11.2 (3.7) (12.1) 2.0 2.4 13.0 10.7Q4 1.5 (7.2) (91.0) (15.3) 16.5 7.3 11.5 (12.1) 8.7 (1.3) 4.0 (6.8) 4.7 13.2 10.12006 8.6 10.2 (58.0) 8.8 15.2 5.9 7.8 (5.3) 1.3 (0.0) 0.5 (4.4) 1.9 3.1 13.12007 Q1 (0.8) (3.5) (76.0) (9.4) 11.1 1.7 1.8 (3.0) 5.9 (0.9) 5.0 (15.4) (2.6) 8.5 2.32007 Q2 5.7 8.8 (82.2) (4.1) 48.3 5.0 12.0 (9.4) 4.6 1.0 8.9 (9.3) (1.9) (10.2) (3.4)2007 Q3 7.8 11.4 (86.8) 19.3 (4.2) 6.4 9.7 (40.6) 5.2 (4.6) (0.4) 2.1 (9.5) 16.9 (0.7)2007 Q4 12.0 23.7 (12.8) 27.3 16.7 4.6 6.3 (22.9) (1.2) 6.2 3.3 4.0 (4.4) 15.1 4.62007 6.1 9.1 (64.4) 6.1 18.0 4.5 7.6 (19.5) 3.7 0.7 4.2 (4.7) (4.8) 7.8 0.62008 Q1 8.5 17.5 (12.8) 15.8 20.7 3.3 2.2 (10.2) 16.4 16.3 15.2 6.5 24.3 (2.4) (11.5)2008 Q2 3.2 3.8 (99.0) (1.7) 14.4 3.7 4.2 (12.1) 26.4 32.8 2.9 3.0 41.8 (3.5) (0.8)2008 Q3 5.5 8.7 (99.8) (6.7) 49.5 3.0 6.3 (34.4) (3.1) 27.6 (1.2) 1.1 26.2 (2.5) 2.02008 Q4 2.8 7.1 (99.9) 2.8 16.4 (0.9) (0.5) (35.8) 7.7 39.5 7.8 9.7 1.6 (1.8) 1.32008 4.9 9.3 (77.4) 2.4 23.9 2.2 3.0 (23.5) 12.1 29.3 6.6 5.0 23.0 (2.5) (2.4)2009 Q1 6.3 9.5 (99.9) 10.4 8.1 (1.7) 3.8 (17.0) 6.9 4.7 2.1 9.0 2.3 (25.1) 17.72009 Q2 7.5 12.7 82991 16.2 5.5 1.3 4.8 (21.7) 6.2 7.3 0.6 9.1 (1.9) (14.4) 7.02009 Q3 4.3 6.6 441336 6.2 6.6 0.7 3.8 (29.8) 1.7 9.4 (9.6) 15.3 (9.2) (7.8) 9.12009 Q4 6.3 8.8 0.0 5.7 14.6 5.3 7.3 (17.5) (6.6) 2.1 4.1 11.4 (11.4) 3.6 0.62009 6.1 9.4 1648.9 9.7 8.5 1.6 5.0 (19.9) 2.6 5.6 (0.6) 11.3 (4.8) (9.8) 8.42010 Q1 6.6 7.8 (100.0) 8.5 6.6 5.0 6.6 (42.2) 13.1 21.2 (0.1) 10.3 (2.1) 14.1 5.62010 Q2 10.0 10.6 (100.0) 14.2 5.3 9.1 9.2 (21.9) 13.4 29.8 (0.3) 14.0 (0.2) 14.2 10.82010 Q3 11.4 6.1 (100.0) 25.7 4.2 5.7 4.0 (77.2) 9.7 24.4 1.8 11.6 1.8 16.2 7.22010 Q4 10.7 14.2 (100.0) 19.4 5.2 6.8 9.4 (91.0) 17.4 15.8 12.4 15.4 (9.3) 8.1 12.12010 9.7 12.3 (100.0) 16.5 5.3 6.7 7.4 (56.8) 13.4 22.7 2.8 13.0 (2.0) 12.8 8.92011 Q1 7.7 6.9 (100.0) 8.9 3.2 6.7 4.8 (46.6) 5.4 24.1 12.8 18.6 (1.6) 10.2 14.02011 Q2 5.8 2.4 (100.0) 1.1 4.9 9.7 9.7 (80.1) 5.4 7.4 0.5 22.8 (1.4) 26.4 8.72011 Q3 4.3 (4.3) (100.0) (13.7) 14.5 13.4 11.2 (0.7) 9.5 24.3 4.5 26.7 (1.3) 19.3 11.62011 Q4 4.6 (2.0) (100.0) (8.4) 10.5 11.6 10.0 (5.6) 4.8 21.1 8.6 29.8 1.5 11.6 6.12011 5.6 0.9 (100.0) (2.8) 8.1 10.6 9.3 (54.7) 6.1 18.4 7.2 25.0 (0.9) 16.6 10.12012 Q1 1.0 (9.7) (100.0) (16.5) 4.0 18.6 21.6 (7.7) 5.6 16.9 12.9 31.7 4.6 11.8 1.62012 Q2(1.3)(8.7) 334,178.7 (15.7) 4.0 5.8 4.7(13.7)2.0 15.5 12.7 5.619.04.4 6.9Q1+Q2 -0.2 -9.2 167039.3 -16.1 4.0 12.2 13.1 -10.7 3.8 16.2 12.8 18.6 11.8 8.1 4.226 | P age
20112012<strong>2013</strong>All ItemsFood & NonalcoholicbeveragesAlcoholicbeverages &TobaccoALL ITEMS CONSUMER PRICE INDEX (CPI) AND ANNUAL INFLATION RATESClothing &FootwearHousing,Water,Electricity,Gas & OtherfuelsFurnishings,HouseholdEquip..,Routine HseMtcConsumer Price Index (2009 = 100)Health Transport CommunicationRecreation &CultureWeight 1 000.00 534.85 15.21 80.78 114.11 82.36 8.15 58.08 12.94 13.84 26.62 3.37 49.69EducationRestaurant& HotelMiscellaneousGoods &ServicesJanuary 111.61 108.85 106.60 111.87 126.48 111.21 112.63 111.78 102.64 109.21 111.60 112.10 111.53 0.7 6.3February 112.36 109.37 107.29 113.49 128.59 111.40 114.40 112.43 102.66 109.58 112.12 112.15 111.62 0.7 6.5March 113.56 110.50 107.05 115.33 129.95 112.03 114.96 114.86 102.80 109.85 114.20 115.35 112.21 1.1 6.6April 114.24 111.11 108.95 118.31 129.76 111.94 116.98 116.07 102.89 110.46 114.15 115.79 112.40 0.6 6.3<strong>May</strong> 114.56 110.97 108.33 119.16 130.95 113.37 117.78 117.03 102.87 113.12 113.23 116.37 112.46 0.3 6.3June 114.52 110.31 108.49 119.96 131.68 114.42 118.29 117.06 102.91 112.67 115.03 118.32 113.09 0.0 6.1July 115.89 111.93 108.52 120.70 132.16 116.40 118.40 119.38 102.89 114.12 116.22 115.46 114.02 1.2 6.9August 116.60 112.09 108.32 122.38 134.66 117.00 119.03 <strong>121</strong>.49 102.90 115.67 115.81 117.33 114.13 0.6 6.5September 117.01 112.48 108.09 <strong>121</strong>.39 135.65 119.01 119.87 <strong>121</strong>.66 102.64 115.44 116.87 116.62 113.67 0.4 6.6October 116.80 112.21 109.74 <strong>121</strong>.18 134.22 119.98 118.32 <strong>121</strong>.19 102.65 116.27 117.10 116.59 114.31 -0.2 6.7November 116.94 112.71 109.33 <strong>121</strong>.08 133.87 119.61 120.33 119.16 102.79 117.52 118.15 118.61 114.36 0.1 6.4December 117.47 113.39 109.15 <strong>121</strong>.69 134.61 118.56 120.12 120.78 102.71 116.84 118.36 116.97 115.29 0.5 6.0January 118.77 115.48 109.11 122.24 134.20 119.04 <strong>121</strong>.79 <strong>121</strong>.27 103.76 117.93 <strong>121</strong>.18 117.96 115.01 1.1 6.4February 119.09 115.41 110.41 122.74 134.71 119.96 122.84 122.46 104.05 118.03 122.87 117.95 115.86 0.3 6.0March 120.84 117.59 110.77 124.43 136.32 120.67 123.52 123.83 104.05 118.70 123.27 118.86 117.53 1.5 6.4April <strong>121</strong>.63 118.22 111.61 125.91 137.21 <strong>121</strong>.89 124.26 124.47 104.12 119.31 123.56 119.57 118.67 0.7 6.5<strong>May</strong> 122.11 118.56 111.92 126.32 137.95 123.06 124.42 124.74 104.02 <strong>121</strong>.15 123.79 120.13 119.50 0.4 6.6June 122.16 118.11 112.38 126.48 138.81 123.47 123.63 125.64 103.92 <strong>121</strong>.77 124.75 120.77 120.58 0.0 6.7July 123.06 119.00 114.16 127.43 139.17 124.38 124.80 126.47 104.61 122.33 127.37 120.77 <strong>121</strong>.79 0.7 6.2August 124.11 120.30 113.72 128.49 140.68 125.98 126.38 125.63 104.63 <strong>121</strong>.71 127.14 120.44 122.37 0.9 6.4September 124.72 120.95 114.42 128.31 140.42 126.50 128.16 129.02 104.86 122.02 127.92 <strong>121</strong>.55 122.41 0.5 6.6October 124.80 <strong>121</strong>.40 113.85 126.42 140.75 127.28 127.17 127.09 104.99 <strong>121</strong>.01 127.93 <strong>121</strong>.95 122.97 0.1 6.8November 125.04 <strong>121</strong>.70 114.75 129.21 140.50 127.35 126.98 124.61 104.50 120.04 128.83 122.80 123.10 0.2 6.9December 126.08 122.96 115.61 129.63 143.99 126.27 126.23 124.75 104.12 <strong>121</strong>.75 128.81 122.78 122.84 0.8 7.3January 127.08 124.27 116.57 130.39 142.41 126.08 125.61 125.61 105.11 122.71 128.02 124.83 124.57 0.8 7.0February 127.32 123.13 117.33 133.09 144.73 127.20 126.92 127.21 106.18 122.51 140.35 125.55 126.46 0.2 6.9March 128.81 124.66 117.55 134.97 147.48 128.10 129.54 127.66 106.71 123.59 140.37 126.34 127.69 1.2 6.6April 129.57 125.48 118.37 135.48 148.60 128.65 128.86 128.87 106.71 123.86 140.37 127.59 127.93 0.6 6.5<strong>May</strong> 130.67 125.99 119.23 136.64 151.30 129.64 130.61 133.12 106.83 125.61 140.98 128.11 128.64 0.9 7.0Source: CSO, Prices Statistics, <strong>2013</strong>InflationRate (%)<strong>Monthly</strong>InflationRate (%)Annual27 | P age
CONSUMER INDEX NUMBERS OF CONSUMER PRICES - FOOD AND NON-FOOD (NATIONAL)2009 = 100Period Total Food CPI Non-Food CPIWeight 1000.0 534.9 465.22010 January 105.01 104.43 105.67February 105.47 104.87 106.15March 106.55 106.13 107.03April 107.48 107.11 107.9<strong>May</strong> 107.74 107.23 108.34June 107.93 106.26 109.85July 108.45 106.57 110.62August 109.45 105.97 113.44September 109.72 106.05 113.93October 109.44 105.6 113.86November 109.92 106.36 114.02December 110.86 107.65 114.56December 110.86 107.65 114.562011 January 111.61 108.85 114.78February 112.36 109.37 115.8March 113.56 110.5 117.09April 114.24 111.11 117.83<strong>May</strong> 114.56 110.97 118.67June 114.52 110.31 119.37July 115.89 111.93 120.45August 116.6 112.09 <strong>121</strong>.78September 117.01 112.48 122.22October 116.8 112.21 122.08November 116.94 112.71 <strong>121</strong>.8December 117.47 113.39 122.172012 January 118.77 115.48 122.54February 119.09 115.41 123.33March 120.84 117.59 124.56April <strong>121</strong>.63 118.22 125.54<strong>May</strong> 122.11 118.56 126.2June 122.16 118.11 126.82July 123.06 119.00 127.73August 124.11 120.30 128.50September 124.72 120.95 129.05October 124.80 <strong>121</strong>.40 128.70November 125.04 <strong>121</strong>.70 128.88December 126.08 122.96 129.67<strong>2013</strong> January 127.08 124.27 130.28February 127.32 123.13 132.13March 128.81 124.66 133.59April 129.57 125.48 134.26<strong>May</strong> 130.67 125.99 136.06Source: CSO, Prices Statistics, <strong>2013</strong>28 | P age
CONSUMER PRICE INDICES (2009=100)Year Month Annual CPI Average Annual Inflation Rate1965 0.0021966 0.002 0.01967 0.002 0.01968 0.002 0.01969 0.002 0.01970 0.002 0.01971 0.002 33.31972 0.002 0.01973 0.002 0.01974 0.002 0.01975 0.003 25.01976 0.003 20.01977 0.004 16.71978 0.004 14.31979 0.005 12.51980 0.005 11.11981 0.006 10.01982 0.006 9.11983 0.008 25.01984 0.010 20.01985 0.015 50.01986 January 0.02 58.61986 February 0.02 58.51986 March 0.02 60.51986 April 0.02 59.01986 <strong>May</strong> 0.02 59.81986 June 0.02 61.31986 July 0.02 59.21986 August 0.02 62.81986 September 0.02 58.51986 October 0.02 48.91986 November 0.02 42.11986 December 0.03 41.61987 January 0.03 43.31987 February 0.03 40.71987 March 0.03 36.61987 April 0.03 48.01987 <strong>May</strong> 0.03 45.21987 June 0.03 46.31987 July 0.03 46.81987 August 0.03 46.51987 September 0.04 53.61987 October 0.04 54.01987 November 0.04 55.91987 December 0.04 50.01988 January 0.04 50.41988 February 0.04 55.11988 March 0.05 59.71988 April 0.05 48.11988 <strong>May</strong> 0.05 49.81988 June 0.05 49.41988 July 0.05 53.01988 August 0.05 50.01988 September 0.05 46.51988 October 0.05 45.31988 November 0.06 47.21988 December 0.06 58.51989 January 0.07 62.51989 February 0.07 65.81989 March 0.08 72.01989 April 0.08 79.31989 <strong>May</strong> 0.09 85.11989 June 0.10 93.71989 July 0.12 138.21989 August 0.14 161.81989 September 0.14 170.129 | P age
Year Month Annual CPI Average Annual Inflation Rate1989 October 0.15 176.41989 November 0.16 171.51989 December 0.16 153.21990 January 0.17 143.81990 February 0.18 140.71990 March 0.19 135.21990 April 0.20 134.11990 <strong>May</strong> 0.21 135.51990 June 0.21 123.31990 July 0.24 92.81990 August 0.25 80.11990 September 0.26 77.21990 October 0.27 78.91990 November 0.32 106.01990 December 0.34 110.61991 January 0.36 112.81991 February 0.38 113.31991 March 0.39 109.41991 April 0.40 104.91991 <strong>May</strong> 0.42 101.01991 June 0.44 105.31991 July 0.45 90.31991 August 0.47 90.11991 September 0.49 90.41991 October 0.53 94.21991 November 0.58 80.71991 December 0.68 99.71992 January 0.76 111.01992 February 0.86 126.51992 March 0.97 148.01992 April 1.02 151.71992 <strong>May</strong> 1.09 159.31992 June 1.15 162.51992 July 1.19 163.81992 August 1.28 173.21992 September 1.43 192.81992 October 1.54 192.31992 November 1.65 185.21992 December 1.90 180.71993 January 2.08 174.41993 February 2.31 168.81993 March 2.59 168.51993 April 2.90 184.51993 <strong>May</strong> 3.19 193.61993 June 3.67 218.41993 July 4.03 237.81993 August 4.13 222.71993 September 4.33 203.01993 October 4.32 180.51993 November 4.14 150.41993 December 4.33 128.11994 January 4.55 118.61994 February 4.95 114.01994 March 5.14 98.31994 April 5.27 82.21994 <strong>May</strong> 5.39 69.11994 June 5.47 49.11994 July 5.55 37.71994 August 5.62 35.91994 September 5.60 29.31994 October 5.66 31.31994 November 5.75 39.01994 December 5.99 38.31995 January 6.36 39.61995 February 6.64 34.11995 March 6.82 32.71995 April 6.85 30.01995 <strong>May</strong> 6.77 25.61995 June 6.95 27.01995 July 7.13 28.61995 August 7.23 28.71995 September 7.52 34.21995 October 8.13 43.51995 November 8.50 47.71995 December 8.75 46.030 | P age
Year Month Annual CPI Average Annual Inflation Rate1996 January 9.07 42.81996 February 9.46 42.61996 March 9.74 42.71996 April 10.04 46.51996 <strong>May</strong> 10.20 50.71996 June 10.42 50.01996 July 10.49 47.11996 August 10.79 49.31996 September 10.95 45.61996 October 11.05 35.91996 November 11.34 33.51996 December 11.83 35.21997 January 12.12 33.61997 February 12.75 34.71997 March 12.86 32.01997 April 12.72 26.71997 <strong>May</strong> 12.59 23.51997 June 12.82 23.11997 July 12.88 22.71997 August 12.98 20.31997 September 13.13 19.91997 October 13.39 21.21997 November 13.75 21.21997 December 14.02 18.61998 January 14.41 18.91998 February 14.82 16.31998 March 15.27 18.81998 April 15.62 22.81998 <strong>May</strong> 15.82 25.71998 June 16.00 24.81998 July 16.26 26.31998 August 16.50 27.11998 September 16.74 27.51998 October 17.09 27.61998 November 17.33 26.11998 December 18.31 30.61999 January 18.96 31.61999 February 19.34 30.51999 March 19.62 28.51999 April 19.77 26.61999 <strong>May</strong> 20.02 26.61999 June 20.39 27.51999 July 20.88 28.41999 August 20.99 27.21999 September 21.05 25.81999 October 21.35 25.01999 November 21.72 25.31999 December 22.09 20.62000 January 22.88 20.72000 February 23.78 23.02000 March 24.31 23.92000 April 24.94 26.22000 <strong>May</strong> 25.07 25.22000 June 25.24 23.82000 July 26.29 25.92000 August 26.65 27.02000 September 27.45 30.42000 October 28.00 31.22000 November 26.89 23.82000 December 28.74 30.12001 January 29.74 30.02001 February 30.71 29.12001 March 31.31 28.82001 April 31.12 24.82001 <strong>May</strong> 30.64 22.22001 June 30.35 20.22001 July 30.80 17.12001 August 31.14 16.82001 September 31.58 15.02001 October 32.16 14.82001 November 32.97 22.62001 December 34.12 18.72002 January 35.58 19.62002 February 36.61 19.22002 March 36.97 18.131 | P age
Year Month Annual CPI Average Annual Inflation Rate2002 April 36.66 17.82002 <strong>May</strong> 37.05 20.92002 June 37.51 23.62002 July 38.01 23.42002 August 38.52 23.72002 September 39.11 23.82002 October 39.82 23.82002 November 41.32 25.32002 December 43.21 26.72003 January 44.21 24.32003 February 44.98 22.92003 March 45.31 22.62003 April 45.41 23.92003 <strong>May</strong> 45.83 23.72003 June 45.73 21.92003 July 45.68 20.22003 August 46.34 20.32003 September 47.36 21.12003 October 48.22 21.12003 November 49.20 19.12003 December 50.62 17.22004 January 51.93 17.42004 February 52.52 16.82004 March 53.30 17.62004 April 53.47 17.82004 <strong>May</strong> 53.82 17.42004 June 54.24 18.62004 July 54.57 19.52004 August 55.10 18.92004 September 55.77 17.82004 October 56.91 18.02004 November 58.20 18.32004 December 59.48 17.52005 January 61.39 18.22005 February 62.33 18.72005 March 62.57 17.42005 April 63.41 18.62005 <strong>May</strong> 64.12 19.12005 June 64.67 19.22005 July 64.77 18.72005 August 65.73 19.32005 September 66.64 19.52005 October 67.34 18.32005 November 68.23 17.22005 December 68.91 15.92006 January 68.86 12.22006 February 68.74 10.32006 March 69.26 10.72006 April 69.37 9.42006 <strong>May</strong> 69.65 8.62006 June 70.19 8.52006 July 70.37 8.72006 August 70.96 8.02006 September 72.13 8.22006 October 72.63 7.92006 November 73.73 8.12006 December 74.59 8.22007 January 75.64 9.82007 February 77.40 12.62007 March 78.04 12.72007 April 77.99 12.42007 <strong>May</strong> 77.83 11.82007 June 77.99 11.12007 July 78.25 11.22007 August 78.53 10.72007 September 78.87 9.32007 October 79.13 9.02007 November 80.17 8.72007 December 81.25 8.92008 January 82.70 9.32008 February 84.78 9.52008 March 85.66 9.82008 April 85.91 10.12008 <strong>May</strong> 86.28 10.92008 June 87.43 12.132 | P age
Year Month Annual CPI Average Annual Inflation Rate2008 July 88.15 12.62008 August 88.93 13.22008 September 90.08 14.22008 October 91.15 15.22008 November 92.46 15.32008 December 94.71 16.62009 January 95.96 16.02009 February 96.61 14.02009 March 96.88 13.12009 April 98.17 14.32009 <strong>May</strong> 98.94 14.72009 June 100.02 14.42009 July 100.48 14.02009 August 101.62 14.32009 September 101.75 13.02009 October 102.34 12.32009 November 103.11 11.52009 December 104.11 9.92010 January 105.01 9.42010 February 105.47 9.22010 March 106.55 10.02010 April 107.48 9.52010 <strong>May</strong> 107.74 8.92010 June 107.93 7.92010 July 108.45 7.92010 August 109.45 7.72010 September 109.72 7.82010 October 109.44 6.92010 November 109.92 6.62010 December 110.86 6.52011 January 111.61 6.32011 February 112.36 6.52011 March 113.56 6.62011 April 114.24 6.32011 <strong>May</strong> 114.56 6.32011 June 114.52 6.12011 July 115.89 6.92011 August 116.60 6.52011 September 117.01 6.62011 October 116.80 6.72011 November 116.94 6.42011 December 117.47 6.02012 January 118.77 6.42012 February 119.09 6.02012 March 120.84 6.42012 April <strong>121</strong>.63 6.52012 <strong>May</strong> 122.11 6.62012 June 122.16 6.72012 July 123.06 6.22012 August 124.11 6.42012 September 124.72 6.62012 October 124.80 6.82012 November 125.04 6.92012 December 126.08 7.3<strong>2013</strong> January 127.08 7.0<strong>2013</strong> February 127.30 6.9<strong>2013</strong> March 128.80 6.6<strong>2013</strong> April 129.60 6.5Note: Inflation rates are computed using unrounded consumer price indices33 | P age
ZAMBIA'S TRADE FLOWS IN ABSOLUTE ZAMBIAN KWACHA (2000 TO <strong>2013</strong>)Flow YearImportsDomesticRe-ExportsTotal Exports(cif)Exports(fob)(fob)(fob)Trade Balance2000 2,751,563,199,592 2,680,166,733,376 36,390,914,760 2,716,557,648,136 (35,005,551,456)2001 3,900,496,869,495 3,523,388,830,726 13,818,082,693 3,537,206,913,419 (363,289,956,076)2002 4,732,881,915,324 4,045,881,104,946 24,035,820,066 4,069,916,925,012 (662,964,990,312)2003 7,439,867,256,553 4,614,120,921,468 27,918,721,735 4,642,039,643,203 (2,797,827,613,350)2004 10,279,302,826,391 7,460,407,702,259 65,872,413,353 7,526,280,115,612 (2,753,022,710,779)2005 11,466,668,652,907 9,564,984,512,688 47,924,948,183 9,612,909,460,871 (1,853,759,192,036)2006 11,049,770,813,126 13,388,136,276,100 22,808,958,125 13,410,945,234,225 2,361,174,421,0992007 15,945,289,847,742 18,301,278,319,118 97,855,426,894 18,399,133,746,013 2,453,843,898,2712008 18,476,489,239,723 17,951,197,614,094 701,811,672,590 18,653,009,286,684 176,520,046,9612009 18,941,137,478,672 20,312,466,564,733 1,052,293,639,721 21,364,760,204,454 2,423,622,725,7822010 25,507,487,313,137 32,876,095,550,370 1,623,955,907,893 34,500,051,458,263 8,992,564,145,1262011 35,440,939,195,530 37,914,339,432,072 5,000,699,119,386 42,915,038,551,459 7,474,099,355,9282012* 45,264,559,783,299 44,565,899,720,765 3,625,306,595,730 48,191,206,316,494 2,926,646,533,195Total: 211,196,454,391,492 217,198,363,282,715 12,340,692,221,129 229,539,055,503,845 18,342,601,112,353Source: CSO, Trade Statistics, 2012Provisional34 | P age
Subscribe for your free electronic copy <strong>of</strong> “<strong>The</strong> <strong>Monthly</strong>” online at www.zamstats.gov.zm<strong>The</strong> Editorial Team would like to thank all Media Institutions and Users <strong>of</strong>…..“<strong>The</strong> <strong>Monthly</strong> Bulletin”Thank you for supporting usSecretariatJohn Kalumbi - DirectorPeter Mukuka - Deputy DirectorLinda N. Chonya - A/Publications and Marketing <strong>Office</strong>rAnthony Nkole - Desktop Publishing <strong>Office</strong>rPerry Musenge - Assistant Desktop Publishing <strong>Office</strong>rPetronella Kaputu - Press Liaison <strong>Office</strong>rEtambuyu Lukonga - DocumentalistChisuwa S. Nalishuwa - Assistant Field Co-ordinatorDaniel Chipaila - StatisticianGeorge Mhango - Sales <strong>Office</strong>rEditorial TeamJohn Kalumbi - DirectorPeter Mukuka - Deputy Director (IRD)Goodson Sinyenga - Deputy Director (ECON)Iven Sikanyiti- A/Deputy Director (SOC)Daniel Daka- A/Deputy Director (Agric)Charles Mugala - Field Co-ordinatorJosephine Chewe - StatisticianGerson Banda - StatisticianPalver Sikanyiti - StatisticianCecilia M. Munjita - A/Senior Gender Analyst35 | P age