Fire Safety and Concrete Structures - Febelcem
Fire Safety and Concrete Structures - Febelcem
Fire Safety and Concrete Structures - Febelcem

Create successful ePaper yourself
Turn your PDF publications into a flip-book with our unique Google optimized e-Paper software.
expansion (%)<br />
5<br />
4<br />
3<br />
2<br />
1<br />
epsilon,cu1<br />
epsilon,c1<br />
epsilon,sy<br />
expansion of the siliceous concrete<br />
steel reinforcement expansion<br />
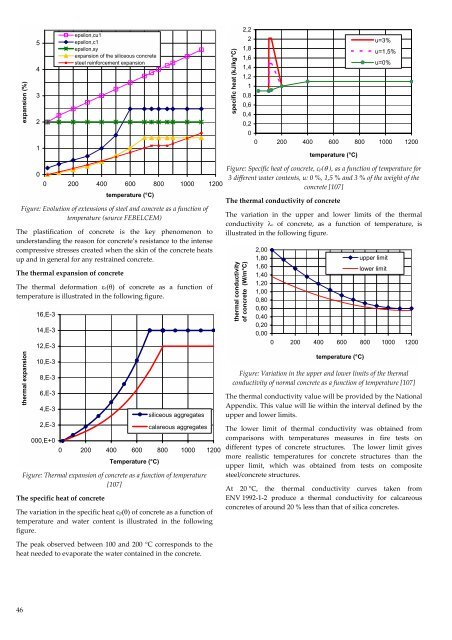
specific heat (kJ/kg°C)<br />
2,2<br />
2<br />
u=3%<br />
1,8<br />
u=1,5%<br />
1,6<br />
u=0%<br />
1,4<br />
1,2<br />
1<br />
0,8<br />
0,6<br />
0,4<br />
0,2<br />
0<br />
0 200 400 600 800 1000 1200<br />
temperature (°C)<br />
0<br />
0 200 400 600 800 1000 1200<br />
temperature (°C)<br />
Figure: Evolution of extensions of steel <strong>and</strong> concrete as a function of<br />
temperature (source FEBELCEM)<br />
The plastification of concrete is the key phenomenon to<br />
underst<strong>and</strong>ing the reason for concrete’s resistance to the intense<br />
compressive stresses created when the skin of the concrete heats<br />
up <strong>and</strong> in general for any restrained concrete.<br />
The thermal expansion of concrete<br />
The thermal deformation εc(θ) of concrete as a function of<br />
temperature is illustrated in the following figure.<br />
thermal expansion<br />
16,E-3<br />
14,E-3<br />
12,E-3<br />
10,E-3<br />
8,E-3<br />
6,E-3<br />
Figure: Thermal expansion of concrete as a function of temperature<br />
[107]<br />
The specific heat of concrete<br />
The variation in the specific heat cp(θ) of concrete as a function of<br />
temperature <strong>and</strong> water content is illustrated in the following<br />
figure.<br />
The peak observed between 100 <strong>and</strong> 200 °C corresponds to the<br />
heat needed to evaporate the water contained in the concrete.<br />
Figure: Specific heat of concrete, cp(θ ), as a function of temperature for<br />
3 different water contents, u: 0 %, 1,5 % <strong>and</strong> 3 % of the weight of the<br />
concrete [107]<br />
The thermal conductivity of concrete<br />
The variation in the upper <strong>and</strong> lower limits of the thermal<br />
conductivity λc of concrete, as a function of temperature, is<br />
illustrated in the following figure.<br />
thermal conductivity<br />
of concrete (W/m°C)<br />
2,00<br />
1,80<br />
1,60<br />
1,40<br />
1,20<br />
1,00<br />
0,80<br />
0,60<br />
0,40<br />
0,20<br />
0,00<br />
0 200 400 600 800 1000 1200<br />
temperature (°C)<br />
upper limit<br />
lower limit<br />
Figure: Variation in the upper <strong>and</strong> lower limits of the thermal<br />
conductivity of normal concrete as a function of temperature [107]<br />
The thermal conductivity value will be provided by the National<br />
Appendix. This value will lie within the interval defined by the<br />
upper <strong>and</strong> lower limits.<br />
4,E-3<br />
siliceous aggregates<br />
2,E-3<br />
calareous aggregates The lower limit of thermal conductivity was obtained from<br />
000,E+0<br />
comparisons with temperatures measures in fire tests on<br />
0 200 400 600 800 1000 1200<br />
different types of concrete structures. The lower limit gives<br />
more realistic temperatures for concrete structures than the<br />
Temperature (°C)<br />
upper limit, which was obtained from tests on composite<br />
steel/concrete structures.<br />
At 20 °C, the thermal conductivity curves taken from<br />
ENV 1992‐1‐2 produce a thermal conductivity for calcareous<br />
concretes of around 20 % less than that of silica concretes.<br />
46