Vibrational Circular Dichroism - Hinds Instruments
Vibrational Circular Dichroism - Hinds Instruments
Vibrational Circular Dichroism - Hinds Instruments

You also want an ePaper? Increase the reach of your titles
YUMPU automatically turns print PDFs into web optimized ePapers that Google loves.
VIBRATION CIRCULAR<br />
DICHROISM<br />
PHOTOELASTIC MODULATORS<br />
APPLICATION NOTE<br />
T E C H N O L O G Y F O R P O L A R I Z A T I O N M E A S U R E M E N T<br />
VIBRATIONAL CIRCULAR DICHROISM<br />
BY DR. LINDA HIRSCHY<br />
Infrared absorption spectroscopy (IR) is the principal tool available for the study of molecular<br />
vibrations. <strong>Vibrational</strong> circular dichroism (VCD) is the differential absorption of left and right<br />
circularly polarized infrared light by vibrating molecules. The two techniques are often combined<br />
to create the spectroscopic measurement technique that will be described here, FTIR-VCD.<br />
FTIR-VCD is used to study the subtle differences in vibrational spectra that result from molecules<br />
that differ only in their three dimensional geometry. The technique has been shown to be<br />
particularly useful for the study of the conformational characteristics of large biological samples<br />
such as proteins and nucleic acids and smaller molecules like chiral pharmaceuticals. It can be<br />
used in conjunction with ab initio calculations to determine the absolute configuration of newly<br />
synthesized molecules, and can be used to determine enantiomeric purity in molecules whose<br />
absolute configuration is already known.<br />
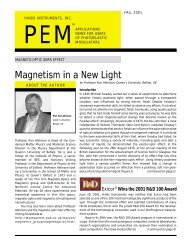
The use of an interferometer, like a Michelson interferometer, to modulate the IR signal before it<br />
enters a sample makes vibrational spectroscopy much faster and easier to do. The information<br />
obtained by this method must be decoded by a computer. The decoding (or demodulating)<br />
process is called a Fourier Transform, hence the acronym FTIR. In FTIR-VCD the infrared light<br />
emerging from the Michelson interferometer is polarization modulated using a photoelastic<br />
modulator (PEM). The light oscillates between left and right circularly polarized at the PEM<br />
Michelson<br />
Interferometer<br />
with IR Source<br />
Polarizer PEM Sample Focusing<br />
Lens<br />
FIGURE 1. A BLOCK DIAGRAM FOR AN FTIR-VCD SET-UP<br />
frequency, and this is how information about the differential absorption of the two polarizations<br />
is obtained. The VCD signal is four to six orders of magnitude smaller than the normal IR<br />
absorption signal. The use of PEM modulation gives VCD an ac detection advantage as well as a<br />
dynamic range advantage.<br />
Figure 1 is a block diagram of a typical instrument that used for FTIR-VCD. The infrared light<br />
is modulated by the Michelson interferometer and then enters the VCD portion of the set up.<br />
By passing through a linear polarizer and a PEM, the Fourier modulated IR beam is further<br />
Page 1<br />
Detector
VIBRATION CIRCULAR<br />
DICHROISM<br />
PHOTOELASTIC MODULATORS<br />
APPLICATION NOTE<br />
modulated at the PEM frequency. To obtain a VCD spectrum the doubly modulated signal is<br />
first demodulated at the PEM frequency by a lock-in amplifier, then Fourier transformed by a<br />
computer. Figure 2 is a block diagram outlining the steps in the demodulation of the IR signal.<br />
Hign Pass<br />
Filter<br />
Lock-in Amplifier<br />
Detector<br />
F<br />
F<br />
T<br />
÷<br />
FTIR-VCD<br />
Output<br />
Pre-amp<br />
Low Pass<br />
Filter<br />
Computer<br />
FIGURE 2. AN ELECTRONIC BLOCK DIAGRAM FOR A TYPICAL FTIR-VCD SET-UP<br />
The output from the detector is typically amplified by an ac-coupled detector preamplifier and is<br />
then processed through two independent paths to obtain the average and differential IR signals.<br />
The low pass filter allows the FTIR signal to pass through to the computer and is the source of a<br />
conventional IR spectrum. The high pass filter allows information at the PEM frequency (usually<br />
20-60 kHz) to pass to the lock-in amplifier. The lock-in is referenced to the PEM frequency and<br />
this is how the VCD spectrum is generated. The two signals are recombined at the computer<br />
where the FTIR and VCD signals are ratioed to give the final, complete FTIR-VCD spectrum.<br />
The absolute configuration of chiral compounds has been historically difficult to determine. The<br />
technique most often used was Xray crystallography which required that the sample be a single<br />
crystal. Many organic and bio-organic compounds are difficult to crystallize, so an alternative<br />
technique for making the determination of absolute configuration was needed. This need<br />
increased in1992 after the FDA required that the absolute configuration of chiral pharmaceuticals<br />
be determined before they were introduced.<br />
Gossypol is a naturally occurring compound that has been investigated as a male fertilityinhibiting<br />
compound. It is a chiral compound, but its absolute configuration has been difficult<br />
to determine since it is an oil at room temperature and therefore difficult to crystallize. Teresa<br />
Freedman and coworkers used FTIR-VCD to do this determination in conjunction with ab initio<br />
calculations that predict the VCD spectrum of each configuration. 1 Their work is included here<br />
with the permission of Laurence A. Nafie.<br />
1<br />
T.B. Freedman, Xiaolin Cao, R.V. Oliveira, Q.B. Cass, and L.A. Nafie, CHIRALITY 15: 196-200 (2003)<br />
Page 2
VIBRATION CIRCULAR<br />
DICHROISM<br />
PHOTOELASTIC MODULATORS<br />
APPLICATION NOTE<br />
FIGURE 3. COMPARISON OF IR AND VCD SPECTRA OF (+) AND (-) GOSSYPOL WITH CALCULATED SPECTRA<br />
Figure 3 shows a comparison of (+) and (-) gossypol’s VCD spectra and the spectra predicted<br />
by calculations using Gaussian 98. This data provided the information necessary to determine<br />
which configuration is attributable to the (+) and (-) forms of gossypol.<br />
.<br />
FURTHER READING<br />
1. K.W. Hipps, and G.A, Crosby, J. Phys. Chem., 83, 555, 1979.<br />
2. A.F. Drake, J. Phys. E:Sci Instrum. 19, 1986<br />
3. B. Wang, Amer. Lab., April 1996.<br />
4. L.A. Nafie, T.A. Keiderling and P.J. Stephens, J.Amer.Chem. Soc. 98, 1976<br />
5. T.A. Keiderling, in Practical Fourier Transform Infrared Spectroscopy, ed. J.R. Ferraro and K. Krishnan,<br />
(academic, San Diego, 1990)<br />
6. L.A. Nafie and D.W. Vidrine in Fourier Transform Infrared Spectroscopy, Vol. 3, ed. J.R.Ferraro and L.J.<br />
Basile,(Academic, New York,1982)<br />
<strong>Hinds</strong> <strong>Instruments</strong>, Inc / 7245 NW Evergreen Pkwy / Hillsboro, OR 97124 / USA<br />
T: 503.690.2000 / F: 503.690.3000 / sales@hindsinstruments.com / www.hindsinstruments.com<br />
PEMlabs is a Trademark of <strong>Hinds</strong> <strong>Instruments</strong>, Inc. Manufactured in USA<br />
© 2005, 2009 <strong>Hinds</strong> <strong>Instruments</strong>, Inc. All rights reserved. Printed in USA<br />
Page 3