San Diego International Airport Part 150 Update Noise Exposure Maps
San Diego International Airport Part 150 Update Noise Exposure Maps
San Diego International Airport Part 150 Update Noise Exposure Maps

Create successful ePaper yourself
Turn your PDF publications into a flip-book with our unique Google optimized e-Paper software.
14 CFR <strong>Part</strong> <strong>150</strong> <strong>Update</strong> August 2009<br />
<strong>San</strong> <strong>Diego</strong> <strong>International</strong> <strong>Airport</strong> Page 33<br />
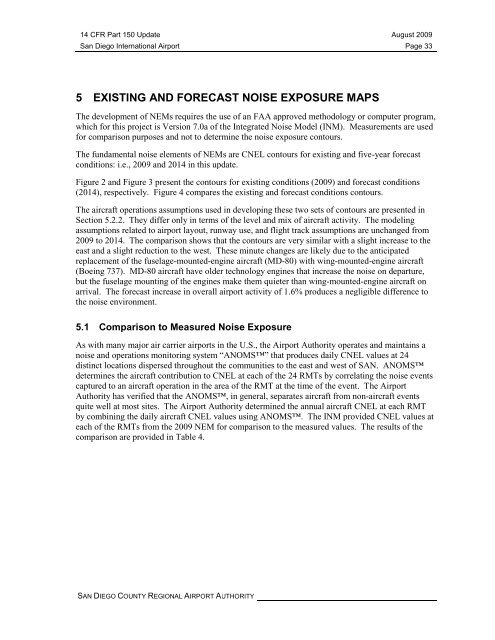
5 EXISTING AND FORECAST NOISE EXPOSURE MAPS<br />
The development of NEMs requires the use of an FAA approved methodology or computer program,<br />
which for this project is Version 7.0a of the Integrated <strong>Noise</strong> Model (INM). Measurements are used<br />
for comparison purposes and not to determine the noise exposure contours.<br />
The fundamental noise elements of NEMs are CNEL contours for existing and five-year forecast<br />
conditions: i.e., 2009 and 2014 in this update.<br />
Figure 2 and Figure 3 present the contours for existing conditions (2009) and forecast conditions<br />
(2014), respectively. Figure 4 compares the existing and forecast conditions contours.<br />
The aircraft operations assumptions used in developing these two sets of contours are presented in<br />
Section 5.2.2. They differ only in terms of the level and mix of aircraft activity. The modeling<br />
assumptions related to airport layout, runway use, and flight track assumptions are unchanged from<br />
2009 to 2014. The comparison shows that the contours are very similar with a slight increase to the<br />
east and a slight reduction to the west. These minute changes are likely due to the anticipated<br />
replacement of the fuselage-mounted-engine aircraft (MD-80) with wing-mounted-engine aircraft<br />
(Boeing 737). MD-80 aircraft have older technology engines that increase the noise on departure,<br />
but the fuselage mounting of the engines make them quieter than wing-mounted-engine aircraft on<br />
arrival. The forecast increase in overall airport activity of 1.6% produces a negligible difference to<br />
the noise environment.<br />
5.1 Comparison to Measured <strong>Noise</strong> <strong>Exposure</strong><br />
As with many major air carrier airports in the U.S., the <strong>Airport</strong> Authority operates and maintains a<br />
noise and operations monitoring system “ANOMS” that produces daily CNEL values at 24<br />
distinct locations dispersed throughout the communities to the east and west of SAN. ANOMS<br />
determines the aircraft contribution to CNEL at each of the 24 RMTs by correlating the noise events<br />
captured to an aircraft operation in the area of the RMT at the time of the event. The <strong>Airport</strong><br />
Authority has verified that the ANOMS, in general, separates aircraft from non-aircraft events<br />
quite well at most sites. The <strong>Airport</strong> Authority determined the annual aircraft CNEL at each RMT<br />
by combining the daily aircraft CNEL values using ANOMS. The INM provided CNEL values at<br />
each of the RMTs from the 2009 NEM for comparison to the measured values. The results of the<br />
comparison are provided in Table 4.<br />
SAN DIEGO COUNTY REGIONAL AIRPORT AUTHORITY