Indirect gradient analysis - Alaska Geobotany Center
Indirect gradient analysis - Alaska Geobotany Center
Indirect gradient analysis - Alaska Geobotany Center

Create successful ePaper yourself
Turn your PDF publications into a flip-book with our unique Google optimized e-Paper software.
Vegetation<br />
Ecosystem<br />
Environmental<br />
factors<br />
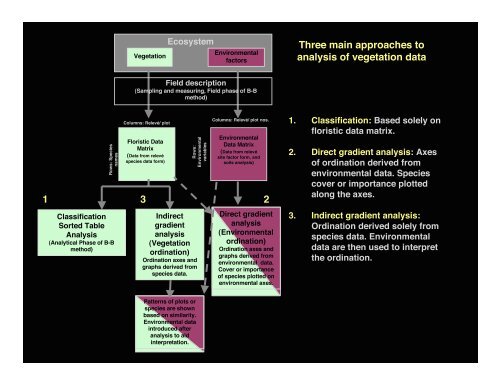
Three main approaches to<br />
<strong>analysis</strong> of vegetation data<br />
Field description<br />
(Sampling and measuring, Field phase of B-B<br />
method)<br />
Site factors<br />
and soils<br />
data<br />
Rows: Species<br />
names<br />
Columns: Relevé/ plot<br />
nos.<br />
Relevé<br />
species<br />
data<br />
Floristic Data<br />
Matrix<br />
(Data from relevé<br />
species data form)<br />
Rows:<br />
Environmental<br />
variables<br />
Columns: Relevé/ plot nos.<br />
Environmental<br />
Data Matrix<br />
(Data from relevé<br />
site factor form, and<br />
soils <strong>analysis</strong>)<br />
1 3 2<br />
Classification<br />
Sorted Table<br />
Analysis<br />
(Analytical Phase of B-B<br />
method)<br />
<strong>Indirect</strong><br />
<strong>gradient</strong><br />
<strong>analysis</strong><br />
(Vegetation<br />
ordination)<br />
Ordination axes and<br />
graphs derived from<br />
species data.<br />
Direct <strong>gradient</strong><br />
<strong>analysis</strong><br />
(Environmental<br />
ordination)<br />
Ordination axes and<br />
graphs derived from<br />
environmental data.<br />
Cover or importance<br />
of species plotted on<br />
environmental axes.<br />
1. Classification: Based solely on<br />
floristic data matrix.<br />
2. Direct <strong>gradient</strong> <strong>analysis</strong>: Axes<br />
of ordination derived from<br />
environmental data. Species<br />
cover or importance plotted<br />
along the axes.<br />
3. <strong>Indirect</strong> <strong>gradient</strong> <strong>analysis</strong>:<br />
Ordination derived solely from<br />
species data. Environmental<br />
data are then used to interpret<br />
the ordination.<br />
Patterns of plots or<br />
species are shown<br />
based on similarity.<br />
Environmental data<br />
introduced after<br />
<strong>analysis</strong> to aid<br />
interpretation.