Recent Annual Report - Gabelli
Recent Annual Report - Gabelli
Recent Annual Report - Gabelli

Create successful ePaper yourself
Turn your PDF publications into a flip-book with our unique Google optimized e-Paper software.
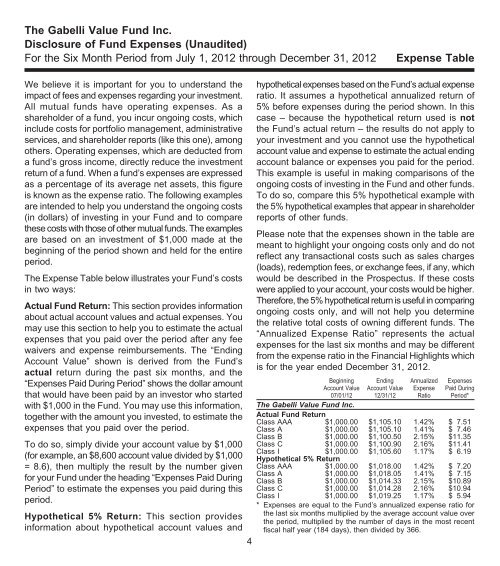
The <strong>Gabelli</strong> Value Fund Inc.<br />
Disclosure of Fund Expenses (Unaudited)<br />
For the Six Month Period from July 1, 2012 through December 31, 2012<br />
Expense Table<br />
We believe it is important for you to understand the<br />
impact of fees and expenses regarding your investment.<br />
All mutual funds have operating expenses. As a<br />
shareholder of a fund, you incur ongoing costs, which<br />
include costs for portfolio management, administrative<br />
services, and shareholder reports (like this one), among<br />
others. Operating expenses, which are deducted from<br />
a fund’s gross income, directly reduce the investment<br />
return of a fund. When a fund’s expenses are expressed<br />
as a percentage of its average net assets, this figure<br />
is known as the expense ratio. The following examples<br />
are intended to help you understand the ongoing costs<br />
(in dollars) of investing in your Fund and to compare<br />
these costs with those of other mutual funds. The examples<br />
are based on an investment of $1,000 made at the<br />
beginning of the period shown and held for the entire<br />
period.<br />
The Expense Table below illustrates your Fund’s costs<br />
in two ways:<br />
Actual Fund Return: This section provides information<br />
about actual account values and actual expenses. You<br />
may use this section to help you to estimate the actual<br />
expenses that you paid over the period after any fee<br />
waivers and expense reimbursements. The “Ending<br />
Account Value” shown is derived from the Fund’s<br />
actual return during the past six months, and the<br />
“Expenses Paid During Period” shows the dollar amount<br />
that would have been paid by an investor who started<br />
with $1,000 in the Fund. You may use this information,<br />
together with the amount you invested, to estimate the<br />
expenses that you paid over the period.<br />
To do so, simply divide your account value by $1,000<br />
(for example, an $8,600 account value divided by $1,000<br />
= 8.6), then multiply the result by the number given<br />
for your Fund under the heading “Expenses Paid During<br />
Period” to estimate the expenses you paid during this<br />
period.<br />
Hypothetical 5% Return: This section provides<br />
information about hypothetical account values and<br />
4<br />
hypothetical expenses based on the Fund’s actual expense<br />
ratio. It assumes a hypothetical annualized return of<br />
5% before expenses during the period shown. In this<br />
case – because the hypothetical return used is not<br />
the Fund’s actual return – the results do not apply to<br />
your investment and you cannot use the hypothetical<br />
account value and expense to estimate the actual ending<br />
account balance or expenses you paid for the period.<br />
This example is useful in making comparisons of the<br />
ongoing costs of investing in the Fund and other funds.<br />
To do so, compare this 5% hypothetical example with<br />
the 5% hypothetical examples that appear in shareholder<br />
reports of other funds.<br />
Please note that the expenses shown in the table are<br />
meant to highlight your ongoing costs only and do not<br />
reflect any transactional costs such as sales charges<br />
(loads), redemption fees, or exchange fees, if any, which<br />
would be described in the Prospectus. If these costs<br />
were applied to your account, your costs would be higher.<br />
Therefore, the 5% hypothetical return is useful in comparing<br />
ongoing costs only, and will not help you determine<br />
the relative total costs of owning different funds. The<br />
“<strong>Annual</strong>ized Expense Ratio” represents the actual<br />
expenses for the last six months and may be different<br />
from the expense ratio in the Financial Highlights which<br />
is for the year ended December 31, 2012.<br />
Beginning<br />
Account Value<br />
07/01/12<br />
Ending<br />
Account Value<br />
12/31/12<br />
<strong>Annual</strong>ized<br />
Expense<br />
Ratio<br />
Expenses<br />
Paid During<br />
Period*<br />
The <strong>Gabelli</strong> Value Fund Inc.<br />
Actual Fund Return<br />
Class AAA $1,000.00 $1,105.10 1.42% $ 7.51<br />
Class A $1,000.00 $1,105.10 1.41% $ 7.46<br />
Class B $1,000.00 $1,100.50 2.15% $11.35<br />
Class C $1,000.00 $1,100.90 2.16% $11.41<br />
Class I $1,000.00 $1,105.60 1.17% $ 6.19<br />
Hypothetical 5% Return<br />
Class AAA $1,000.00 $1,018.00 1.42% $ 7.20<br />
Class A $1,000.00 $1,018.05 1.41% $ 7.15<br />
Class B $1,000.00 $1,014.33 2.15% $10.89<br />
Class C $1,000.00 $1,014.28 2.16% $10.94<br />
Class I $1,000.00 $1,019.25 1.17% $ 5.94<br />
* Expenses are equal to the Fund’s annualized expense ratio for<br />
the last six months multiplied by the average account value over<br />
the period, multiplied by the number of days in the most recent<br />
fiscal half year (184 days), then divided by 366.