Recent Annual Report - Gabelli
Recent Annual Report - Gabelli
Recent Annual Report - Gabelli

Create successful ePaper yourself
Turn your PDF publications into a flip-book with our unique Google optimized e-Paper software.
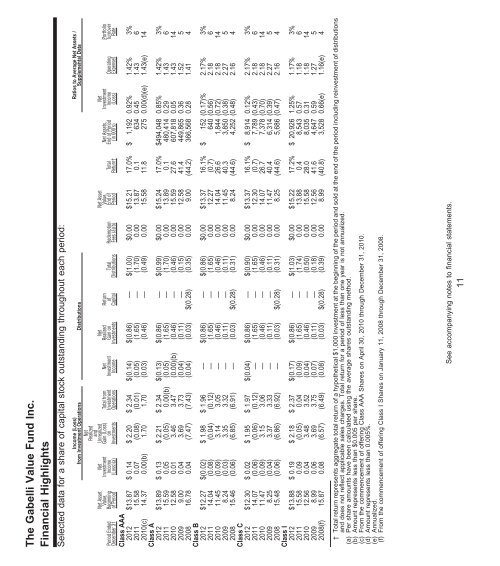
The <strong>Gabelli</strong> Value Fund Inc.<br />
Financial Highlights<br />
Selected data for a share of capital stock outstanding throughout each period:<br />
Period Ended<br />
December 31<br />
Net Asset<br />
Value,<br />
Beginning<br />
of Period<br />
Net<br />
Investment<br />
Income<br />
(Loss)(a)<br />
Income (Loss)<br />
from Investment Operations Distributions<br />
Net<br />
Realized<br />
and<br />
Unrealized<br />
Gain (Loss)<br />
on<br />
Investments<br />
Total from<br />
Investment<br />
Operations<br />
Net<br />
Investment<br />
Income<br />
Net<br />
Realized<br />
Gain on<br />
Investments<br />
Return<br />
of<br />
Capital<br />
Total<br />
Distributions<br />
Redemption<br />
Fees (a)(b)<br />
Net Asset<br />
Value,<br />
End of<br />
Period<br />
Total<br />
Return†<br />
Net Assets,<br />
End of Period<br />
(in 000’s)<br />
Ratios to Average Net Assets /<br />
Supplemental Data<br />
Class AAA<br />
2012 $13.87 $ 0.14 $ 2.20 $ 2.34 $(0.14) $(0.86) — $(1.00) $0.00 $15.21 17.0% $ 1,192 0.92% 1.42% 3%<br />
2011 15.58 0.07 (0.08) (0.01) (0.05) (1.65) — (1.70) 0.00 13.87 0.1 634 0.45 1.43 6<br />
2010(c) 14.37 0.00(b) 1.70 1.70 (0.03) (0.46) — (0.49) 0.00 15.58 11.8 275 0.00(d)(e) 1.43(e) 14<br />
Class A<br />
2012 $13.89 $ 0.13 $ 2.21 $ 2.34 $(0.13) $(0.86) — $(0.99) $0.00 $15.24 17.0% $494,048 0.85% 1.42% 3%<br />
2011 15.59 0.05 (0.05) 0.00(b) (0.05) (1.65) — (1.70) 0.00 13.89 0.1 480,414 0.29 1.43 6<br />
2010 12.58 0.01 3.46 3.47 (0.00)(b) (0.46) — (0.46) 0.00 15.59 27.6 607,818 0.05 1.43 14<br />
2009 9.00 0.04 3.69 3.73 (0.04) (0.11) — (0.15) 0.00 12.58 41.4 449,865 0.36 1.52 5<br />
2008 16.78 0.04 (7.47) (7.43) (0.04) (0.03) $(0.28) (0.35) 0.00 9.00 (44.2) 366,568 0.28 1.41 4<br />
Class B<br />
2012 $12.27 $(0.02) $ 1.98 $ 1.96 — $(0.86) — $(0.86) $0.00 $13.37 16.1% $ 152 (0.17)% 2.17% 3%<br />
2011 14.04 (0.08) (0.04) (0.12) — (1.65) — (1.65) 0.00 12.27 (0.7) 640 (0.56) 2.18 6<br />
2010 11.45 (0.09) 3.14 3.05 — (0.46) — (0.46) 0.00 14.04 26.6 1,844 (0.72) 2.18 14<br />
2009 8.24 (0.03) 3.35 3.32 — (0.11) — (0.11) 0.00 11.45 40.3 3,850 (0.38) 2.27 5<br />
2008 15.46 (0.06) (6.85) (6.91) — (0.03) $(0.28) (0.31) 0.00 8.24 (44.6) 4,252 (0.48) 2.16 4<br />
Class C<br />
2012 $12.30 $ 0.02 $ 1.95 $ 1.97 $(0.04) $(0.86) — $(0.90) $0.00 $13.37 16.1% $ 8,914 0.12% 2.17% 3%<br />
2011 14.07 (0.06) (0.06) (0.12) — (1.65) — (1.65) 0.00 12.30 (0.7) 7,789 (0.43) 2.18 6<br />
2010 11.47 (0.09) 3.15 3.06 — (0.46) — (0.46) 0.00 14.07 26.7 7,378 (0.70) 2.18 14<br />
2009 8.25 (0.04) 3.37 3.33 — (0.11) — (0.11) 0.00 11.47 40.4 6,314 (0.39) 2.27 5<br />
2008 15.48 (0.06) (6.86) (6.92) — (0.03) $(0.28) (0.31) 0.00 8.25 (44.6) 5,686 (0.47) 2.16 4<br />
Class I<br />
2012 $13.88 $ 0.19 $ 2.18 $ 2.37 $(0.17) $(0.86) — $(1.03) $0.00 $15.22 17.2% $ 20,926 1.25% 1.17% 3%<br />
2011 15.58 0.09 (0.05) 0.04 (0.09) (1.65) — (1.74) 0.00 13.88 0.4 8,543 0.57 1.18 6<br />
2010 12.56 0.04 3.48 3.52 (0.04) (0.46) — (0.50) 0.00 15.58 28.0 8,035 0.31 1.18 14<br />
2009 8.99 0.06 3.69 3.75 (0.07) (0.11) — (0.18) 0.00 12.56 41.6 4,647 0.59 1.27 5<br />
2008(f) 15.87 0.08 (6.57) (6.49) (0.08) (0.03) $(0.28) (0.39) 0.00 8.99 (40.8) 3,528 0.66(e) 1.16(e) 4<br />
Net<br />
Investment<br />
Income<br />
(Loss)<br />
Operating<br />
Expenses<br />
Portfolio<br />
Turnover<br />
Rate<br />
† Total return represents aggregate total return of a hypothetical $1,000 investment at the beginning of the period and sold at the end of the period including reinvestment of distributions<br />
and does not reflect applicable sales charges. Total return for a period of less than one year is not annualized.<br />
(a) Per share amounts have been calculated using the average shares outstanding method.<br />
(b) Amount represents less than $0.005 per share.<br />
(c) From the commencement of offering Class AAA Shares on April 30, 2010 through December 31, 2010.<br />
(d) Amount represents less than 0.005%.<br />
(e) <strong>Annual</strong>ized.<br />
(f) From the commencement of offering Class I Shares on January 11, 2008 through December 31, 2008.<br />
See accompanying notes to financial statements.<br />
11