Recent Annual Report - Gabelli
Recent Annual Report - Gabelli
Recent Annual Report - Gabelli

You also want an ePaper? Increase the reach of your titles
YUMPU automatically turns print PDFs into web optimized ePapers that Google loves.
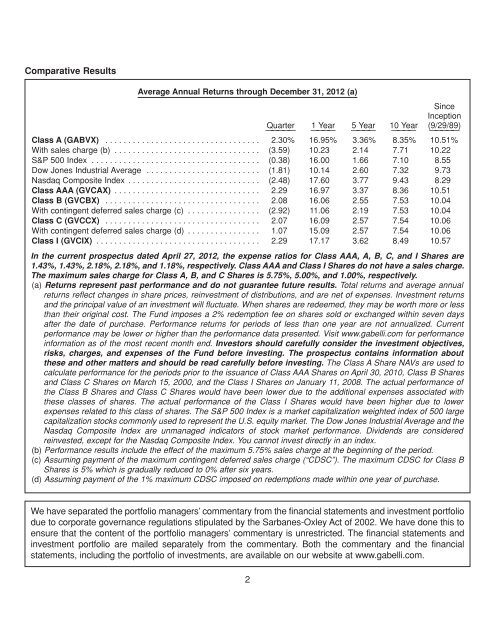
Comparative Results<br />
Average <strong>Annual</strong> Returns through December 31, 2012 (a)<br />
Since<br />
Inception<br />
Quarter<br />
—————<br />
1 Year<br />
————<br />
5 Year<br />
————<br />
10 Year<br />
————<br />
(9/29/89)<br />
—————<br />
Class A (GABVX) . . . . . . . . . . . . . . . . . . . . . . . . . . . . . . . . . . 2.30% 16.95% 3.36% 8.35% 10.51%<br />
With sales charge (b) . . . . . . . . . . . . . . . . . . . . . . . . . . . . . . . . (3.59) 10.23 2.14 7.71 10.22<br />
S&P 500 Index . . . . . . . . . . . . . . . . . . . . . . . . . . . . . . . . . . . . . (0.38) 16.00 1.66 7.10 8.55<br />
Dow Jones Industrial Average . . . . . . . . . . . . . . . . . . . . . . . . . (1.81) 10.14 2.60 7.32 9.73<br />
Nasdaq Composite Index . . . . . . . . . . . . . . . . . . . . . . . . . . . . . (2.48) 17.60 3.77 9.43 8.29<br />
Class AAA (GVCAX) . . . . . . . . . . . . . . . . . . . . . . . . . . . . . . . . 2.29 16.97 3.37 8.36 10.51<br />
Class B (GVCBX) . . . . . . . . . . . . . . . . . . . . . . . . . . . . . . . . . . 2.08 16.06 2.55 7.53 10.04<br />
With contingent deferred sales charge (c) . . . . . . . . . . . . . . . . (2.92) 11.06 2.19 7.53 10.04<br />
Class C (GVCCX) . . . . . . . . . . . . . . . . . . . . . . . . . . . . . . . . . . 2.07 16.09 2.57 7.54 10.06<br />
With contingent deferred sales charge (d) . . . . . . . . . . . . . . . . 1.07 15.09 2.57 7.54 10.06<br />
Class I (GVCIX) . . . . . . . . . . . . . . . . . . . . . . . . . . . . . . . . . . . . 2.29 17.17 3.62 8.49 10.57<br />
In the current prospectus dated April 27, 2012, the expense ratios for Class AAA, A, B, C, and I Shares are<br />
1.43%, 1.43%, 2.18%, 2.18%, and 1.18%, respectively. Class AAA and Class I Shares do not have a sales charge.<br />
The maximum sales charge for Class A, B, and C Shares is 5.75%, 5.00%, and 1.00%, respectively.<br />
(a) Returns represent past performance and do not guarantee future results. Total returns and average annual<br />
returns reflect changes in share prices, reinvestment of distributions, and are net of expenses. Investment returns<br />
and the principal value of an investment will fluctuate. When shares are redeemed, they may be worth more or less<br />
than their original cost. The Fund imposes a 2% redemption fee on shares sold or exchanged within seven days<br />
after the date of purchase. Performance returns for periods of less than one year are not annualized. Current<br />
performance may be lower or higher than the performance data presented. Visit www.gabelli.com for performance<br />
information as of the most recent month end. Investors should carefully consider the investment objectives,<br />
risks, charges, and expenses of the Fund before investing. The prospectus contains information about<br />
these and other matters and should be read carefully before investing. The Class A Share NAVs are used to<br />
calculate performance for the periods prior to the issuance of Class AAA Shares on April 30, 2010, Class B Shares<br />
and Class C Shares on March 15, 2000, and the Class I Shares on January 11, 2008. The actual performance of<br />
the Class B Shares and Class C Shares would have been lower due to the additional expenses associated with<br />
these classes of shares. The actual performance of the Class I Shares would have been higher due to lower<br />
expenses related to this class of shares. The S&P 500 Index is a market capitalization weighted index of 500 large<br />
capitalization stocks commonly used to represent the U.S. equity market. The Dow Jones Industrial Average and the<br />
Nasdaq Composite Index are unmanaged indicators of stock market performance. Dividends are considered<br />
reinvested, except for the Nasdaq Composite Index. You cannot invest directly in an index.<br />
(b) Performance results include the effect of the maximum 5.75% sales charge at the beginning of the period.<br />
(c) Assuming payment of the maximum contingent deferred sales charge (“CDSC”). The maximum CDSC for Class B<br />
Shares is 5% which is gradually reduced to 0% after six years.<br />
(d) Assuming payment of the 1% maximum CDSC imposed on redemptions made within one year of purchase.<br />
We have separated the portfolio managers’ commentary from the financial statements and investment portfolio<br />
due to corporate governance regulations stipulated by the Sarbanes-Oxley Act of 2002. We have done this to<br />
ensure that the content of the portfolio managers’ commentary is unrestricted. The financial statements and<br />
investment portfolio are mailed separately from the commentary. Both the commentary and the financial<br />
statements, including the portfolio of investments, are available on our website at www.gabelli.com.<br />
2