Recent Annual Report - Gabelli
Recent Annual Report - Gabelli
Recent Annual Report - Gabelli

You also want an ePaper? Increase the reach of your titles
YUMPU automatically turns print PDFs into web optimized ePapers that Google loves.
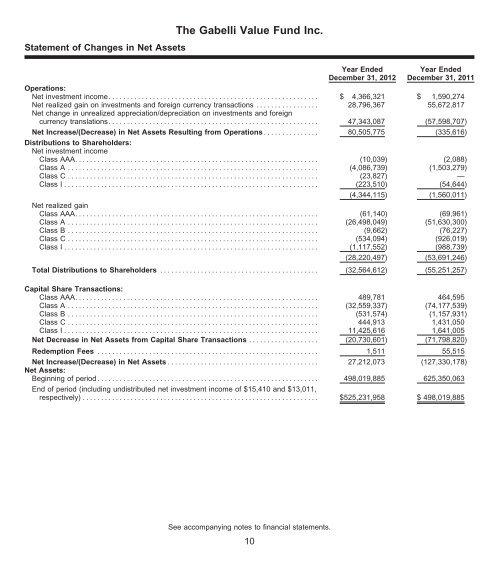
Statement of Changes in Net Assets<br />
The <strong>Gabelli</strong> Value Fund Inc.<br />
Year Ended<br />
December 31, 2012<br />
Year Ended<br />
December 31, 2011<br />
Operations:<br />
Netinvestmentincome......................................................... $ 4,366,321 $ 1,590,274<br />
Net realized gain on investments and foreign currency transactions ................. 28,796,367 55,672,817<br />
Net change in unrealized appreciation/depreciation on investments and foreign<br />
currency translations......................................................... 47,343,087 (57,598,707)<br />
Net Increase/(Decrease) in Net Assets Resulting from Operations ............... 80,505,775 (335,616)<br />
Distributions to Shareholders:<br />
Net investment income<br />
Class AAA.................................................................. (10,039) (2,088)<br />
Class A .................................................................... (4,086,739) (1,503,279)<br />
Class C .................................................................... (23,827) —<br />
Class I ..................................................................... (223,510) (54,644)<br />
(4,344,115) (1,560,011)<br />
Net realized gain<br />
Class AAA.................................................................. (61,140) (69,961)<br />
Class A .................................................................... (26,498,049) (51,630,300)<br />
Class B .................................................................... (9,662) (76,227)<br />
Class C .................................................................... (534,094) (926,019)<br />
Class I ..................................................................... (1,117,552) (988,739)<br />
(28,220,497) (53,691,246)<br />
Total Distributions to Shareholders ........................................... (32,564,612) (55,251,257)<br />
Capital Share Transactions:<br />
Class AAA.................................................................. 489,781 464,595<br />
Class A .................................................................... (32,559,337) (74,177,539)<br />
Class B .................................................................... (531,574) (1,157,931)<br />
Class C .................................................................... 444,913 1,431,050<br />
Class I ..................................................................... 11,425,616 1,641,005<br />
Net Decrease in Net Assets from Capital Share Transactions ................... (20,730,601) (71,798,820)<br />
Redemption Fees ............................................................ 1,511 55,515<br />
Net Increase/(Decrease) in Net Assets ......................................... 27,212,073 (127,330,178)<br />
Net Assets:<br />
Beginning of period ............................................................ 498,019,885 625,350,063<br />
End of period (including undistributed net investment income of $15,410 and $13,011,<br />
respectively)................................................................ $525,231,958 $ 498,019,885<br />
See accompanying notes to financial statements.<br />
10