Recent Annual Report - Gabelli
Recent Annual Report - Gabelli
Recent Annual Report - Gabelli

Create successful ePaper yourself
Turn your PDF publications into a flip-book with our unique Google optimized e-Paper software.
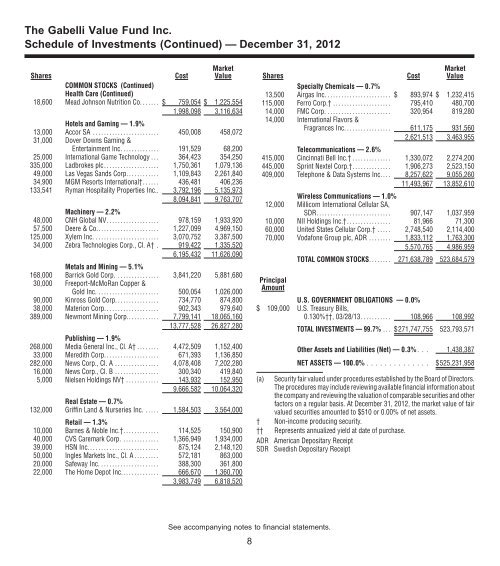
The <strong>Gabelli</strong> Value Fund Inc.<br />
Schedule of Investments (Continued) — December 31, 2012<br />
Shares<br />
Cost<br />
Market<br />
Value<br />
COMMON STOCKS (Continued)<br />
Health Care (Continued)<br />
18,600 Mead Johnson Nutrition Co. ...... $ 759,054 $ 1,225,554<br />
1,998,098 3,116,634<br />
Hotels and Gaming — 1.9%<br />
13,000 Accor SA ........................ 450,008 458,072<br />
31,000 Dover Downs Gaming &<br />
Entertainment Inc. ............. 191,529 68,200<br />
25,000 International Game Technology . . . 364,423 354,250<br />
335,000 Ladbrokes plc.................... 1,750,361 1,079,136<br />
49,000 Las Vegas Sands Corp. ........... 1,109,843 2,261,840<br />
34,900 MGM Resorts International†...... 436,481 406,236<br />
133,541 Ryman Hospitality Properties Inc.. 3,792,196 5,135,973<br />
8,094,841 9,763,707<br />
Machinery — 2.2%<br />
48,000 CNH Global NV................... 978,159 1,933,920<br />
57,500 Deere & Co....................... 1,227,099 4,969,150<br />
125,000 Xylem Inc. ....................... 3,070,752 3,387,500<br />
34,000 Zebra Technologies Corp., Cl. A† . 919,422 1,335,520<br />
6,195,432 11,626,090<br />
Metals and Mining — 5.1%<br />
168,000 Barrick Gold Corp. ............... 3,841,220 5,881,680<br />
30,000 Freeport-McMoRan Copper &<br />
Gold Inc. ...................... 500,054 1,026,000<br />
90,000 Kinross Gold Corp. ............... 734,770 874,800<br />
38,000 Materion Corp. ................... 902,343 979,640<br />
389,000 Newmont Mining Corp............ 7,799,141 18,065,160<br />
13,777,528 26,827,280<br />
Publishing — 1.9%<br />
268,000 Media General Inc., Cl. A† ........ 4,472,509 1,152,400<br />
33,000 Meredith Corp. ................... 671,393 1,136,850<br />
282,000 News Corp., Cl. A ................ 4,078,408 7,202,280<br />
16,000 News Corp., Cl. B ................ 300,340 419,840<br />
5,000 Nielsen Holdings NV† ............ 143,932 152,950<br />
9,666,582 10,064,320<br />
Real Estate — 0.7%<br />
132,000 Griffin Land & Nurseries Inc. ..... 1,584,503 3,564,000<br />
Retail — 1.3%<br />
10,000 Barnes & Noble Inc.†............. 114,525 150,900<br />
40,000 CVS Caremark Corp. ............. 1,366,949 1,934,000<br />
39,000 HSN Inc.......................... 875,124 2,148,120<br />
50,000 Ingles Markets Inc., Cl. A ......... 572,181 863,000<br />
20,000 Safeway Inc. ..................... 388,300 361,800<br />
22,000 The Home Depot Inc.............. 666,670 1,360,700<br />
3,983,749 6,818,520<br />
Shares<br />
Cost<br />
Market<br />
Value<br />
Specialty Chemicals — 0.7%<br />
13,500 Airgas Inc. ....................... $ 893,974 $ 1,232,415<br />
115,000 Ferro Corp.† ..................... 795,410 480,700<br />
14,000 FMC Corp. ....................... 320,954 819,280<br />
14,000 International Flavors &<br />
Fragrances Inc. ................ 611,175 931,560<br />
2,621,513 3,463,955<br />
Telecommunications — 2.6%<br />
415,000 Cincinnati Bell Inc.† .............. 1,330,072 2,274,200<br />
445,000 Sprint Nextel Corp.†.............. 1,906,273 2,523,150<br />
409,000 Telephone & Data Systems Inc. . . . 8,257,622 9,055,260<br />
11,493,967 13,852,610<br />
Wireless Communications — 1.0%<br />
12,000 Millicom International Cellular SA,<br />
SDR........................... 907,147 1,037,959<br />
10,000 NII Holdings Inc.†................ 81,966 71,300<br />
60,000 United States Cellular Corp.† ..... 2,748,540 2,114,400<br />
70,000 Vodafone Group plc, ADR ........ 1,833,112 1,763,300<br />
5,570,765 4,986,959<br />
TOTAL COMMON STOCKS........ 271,638,789 523,684,579<br />
Principal<br />
Amount<br />
U.S. GOVERNMENT OBLIGATIONS — 0.0%<br />
$ 109,000 U.S. Treasury Bills,<br />
0.130%††, 03/28/13........... 108,966 108,992<br />
TOTAL INVESTMENTS — 99.7% ... $271,747,755 523,793,571<br />
Other Assets and Liabilities (Net) — 0.3% . . . 1,438,387<br />
NET ASSETS — 100.0% .............. $525,231,958<br />
(a) Security fair valued under procedures established by the Board of Directors.<br />
The procedures may include reviewing available financial information about<br />
the company and reviewing the valuation of comparable securities and other<br />
factors on a regular basis. At December 31, 2012, the market value of fair<br />
valued securities amounted to $510 or 0.00% of net assets.<br />
† Non-income producing security.<br />
†† Represents annualized yield at date of purchase.<br />
ADR American Depositary Receipt<br />
SDR Swedish Depositary Receipt<br />
See accompanying notes to financial statements.<br />
8