Chapter 7 - Ensemble methods.pdf
Chapter 7 - Ensemble methods.pdf
Chapter 7 - Ensemble methods.pdf
SHOW LESS

Create successful ePaper yourself
Turn your PDF publications into a flip-book with our unique Google optimized e-Paper software.
• Follow the same process for all other pairs of<br />
observations and forecasts at this time.<br />
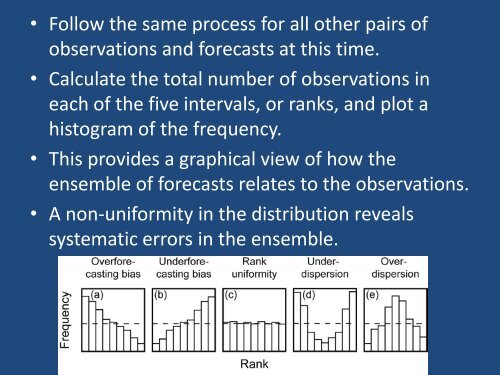
• Calculate the total number of observations in<br />
each of the five intervals, or ranks, and plot a<br />
histogram of the frequency.<br />
• This provides a graphical view of how the<br />
ensemble of forecasts relates to the observations.<br />
• A non-uniformity in the distribution reveals<br />
systematic errors in the ensemble.